
Marine
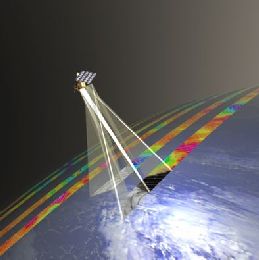
Joseph Sienkiewicz provides an overview of the measuring principles of scatterometers on polar orbiters. The presentation concludes on practical examples showing also attenuation effect by rain droplets.
Ocean surface vector winds derived from polar satellite based scatterometers (radars) allow marine forecasters to view high resolution wind fields over the global ocean. Operational forecasters first access to near real time ocean vector winds began in the early 1990s with the launch of ERS-1 and followed by ERS-2, NASA's NSCAT and QuikSCAT. Of these instruments QuikSCAT, during its ten year life span, provided a wide swath capability allowing forecasters to see entire storms in a single swath. Today, ASCAT on Metop-A, OSCAT on Indian Space Research Organisation (ISRO) OceanSat-2 satellite and in the near future ASCAT-B on Metop-B will continue to provide global coverage. Scatterometer winds provide forecasters a high resolution "sea" truth, give an enhanced situational awareness, the ability to assess the validity of numerical model initial conditions and short term forecasts, and the location and intensity of warning criteria winds. This talk will discuss the above issues by giving examples and also discuss how to interpret remotely sensed ocean winds.
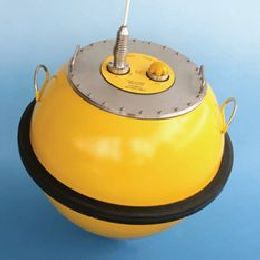
Jose Candido from WavEC talks in his presentation about the use of satellite derived altimetry data for wave energy applications.
Altimeter estimates of the significant wave height Hs are quite accurate. The assessment of the wave energy resource in deep water locations requires not only the knowledge of Hs but also of the wave period, in particular the energy period Te. Several models have been proposed in order to derive the mean zero-crossing period from the altimeter backscatter coefficient with reasonable accuracy. The attempts to establish a relation between Tz and Te revealed significant constraints. As a consequence, the exclusive use of altimeter data may be suitable only for preliminary wave energy resource assessment purposes. Additionally, given their wide geographic availability, altimeter Hs estimates are typically applied in the validation of wave model data used in wave energy resource assessment studies.
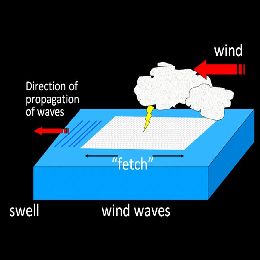
Sergio Muacho from IPMA gives a presentation on Jason-2 altimetry data. He explains the measuring principle and applies the data to track an Atlantic wave storm.
This presentation reports on the use of significant wave height (SWH) altimetry product, derived from OSTM/Jason-2 data, during a recent wave storm in the Northeast region of the Atlantic Ocean at mid-April 2012. Altimetric measurements provide data for wave model assimilation and also support ocean forecasts. Sérgio Muacho will focus on remote-sensed observations that cover a period of one week, and track the wave storm over the Atlantic between south of Iceland and the Portuguese Continental West coast, and the Gulf of Biscay. This study provides a summary of this wave storm and highlights the importance of having altimetry data in ocean areas, where there is a lack of observations, especially in off-shore regions.
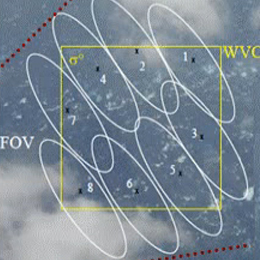
The Advanced Scatterometer (ASCAT) is one of the new-generation European instruments carried on MetOp and will be used to determine information about the wind for use primarily in weather forecasting and climate research.
The Advanced Scatterometer (ASCAT) is one of the new-generation European instruments carried on MetOp and will be used to determine information about the wind for use primarily in weather forecasting and climate research. Data from ASCAT will also find applications in a number of other areas such as the monitoring of land- and sea-ice, snow cover and soil moisture.
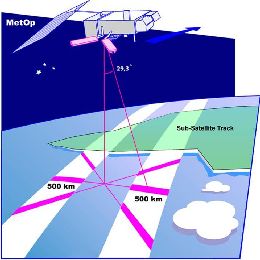
Scatterometer is a main instrument that is gathering information on ocean winds. It is a radar instrument mounted on a satellite.
Another presenter from the OSI SAF, Anton Verhoef (KNMI), did a lecture on Wind products which are closely related to the concept of scatterometry. Scatterometer is a main instrument that is gathering information on ocean winds. It is a radar instrument mounted on a satellite. In this lecture the explanation of principle of scatterometry is given along with explanation of deriving wind fields from scatterometer data. Also there is brief overview of currently available wind products and of tools and methods which are available for visualisation and monitoring of the information. At the end of presentation some words will be given about Quality information and Data formats.
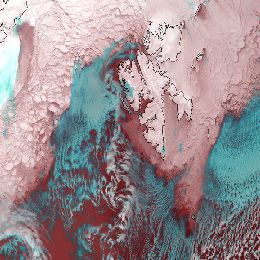
To track and measure sea ice motion and concentration, Passive microwave imagers are used (SSM/I or AMSR-E). These instruments are measuring emitted radiances from below.
Thomas Lavergne from Norwegian Meteorological Institute is presenting the work that has been done within OSI SAF on Sea Ice Applications. General physical role of the sea ice in Earth\'s system we can look through the radiation. In winter time sea is relatively warmer than atmosphere and when sea ice is present it acts like cover to the sea radiation. On the breaking points of ice thus there is suddenly transfer of moisture and heat from the sea to atmosphere, both sensible heat and radiation. This process is responsible for cloud formation and the weather conditions overall. So for (e.g. ship) safety, weather prediction, climate monitoring or ecosystem studies the information on sea ice coverage is crucial. To track and measure sea ice motion and concentration, Passive microwave imagers are used (SSM/I or AMSR-E). These instruments are measuring emitted radiances from below. Thus they don\'t need solar light and can operate both day and night.
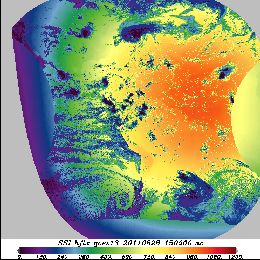
Presentation on OSI SAF radiative fluxes Products and Services.
This short presentation on OSI SAF radiative fluxes Products and Services is given by Pierre Le Borgne from Meteo-France. Two main products that are described here are Surface Solar Irradiance (SSI) product and Downward Longwave Irradiance (DLI) product. For SSI product, physical parametrization is applied and for DLI product bulk parametrization. What is derived from satellite is the visible channel for SSI and cloud precipitation DLI. Hourly SSI and DLI products and the flux validation results are also shown in this lecture.
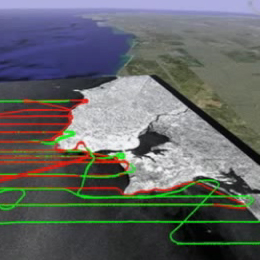
Presentation on "Coastal Upwelling and associated phenomena" in which a brief review of the Ekman layers is presented.
Presentation on "Coastal Upwelling and associated phenomena" in which a brief review of the Ekman layers is presented, followed by an overview of several phenomena resulting from wind driven coastal divergence. In addition the presentation of general processes occurring in these areas, several aspects of the summer upwelling off Western Iberia are discussed.
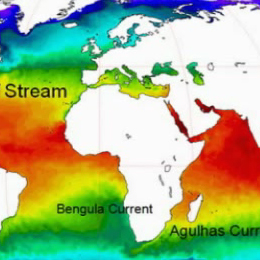
Sea surface temperature (SST), defined as one of the essential climate variables, has a key role in climate research and weather prediction by representing the boundary condition for both the ocean and the atmosphere.
Sea surface temperature (SST), defined as one of the essential climate variables, has a key role in climate research and weather prediction by representing the boundary condition for both the ocean and the atmosphere.
This presentation shows how the SST is retrieved from satellite observations and its main retrieval errors, the instruments and satellites used in its retrieval and the main SST applications. At the end, a brief overview of the future satellite SST-related missions is given.
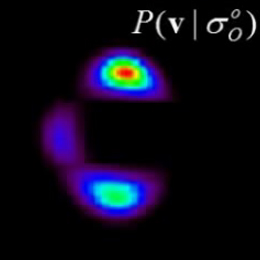
Scatterometer winds are used by all major NWP centres and by the oceanographic community. At KNMI high resolution ASCAT scatterometer data is assimilated in the NWP High-Resolution Limited Area Model (HiRLAM).
Over the last years the processing of ERS scatterometer winds has been refined. Subsequently, High Resolution Limited Area Model, HIRLAM, and ECMWF model data assimilation experiments have been carried out to assess the impact of one scatterometer, ERS-1 and of two scatterometers, ERS-1 and ERS-2, on the analyses and forecasts. We found that scatterometer winds have a clear and beneficial impact in the data assimilation cycle and on the forecasts. Furthermore, ECMWF has shown that ERS scatterometer data improve the prediction of tropical cyclones in 4Dvar, where unprecedented skillful medium-range forecasts result of potential large social-economic value. Nevertheless, scatterometer winds contain much sub-synoptic scale information where the smallest scales resolved are difficult to assimilate into a Numerical Weather Prediction, NWP, model. This is mainly due to the otherwise general sparsity of the observing system over the ocean. In line with this it is found that scatterometer data coverage is very important for obtaining a large impact. In that respect future scatterometer systems such as SeaWinds on QuikSCAT and ADEOSII, and ASCAT on EPS are promising.
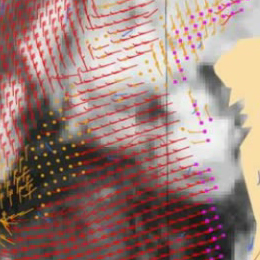
Satellite based scatterometers provide high resolution all-weather wind vector fields over the seas. Wind speed and wind direction are provided at high accuracy under all weather conditions.
Scatterometers uniquely define the mesoscale wind vector field at the sea surface by measuring the radar backscatter signal from wind-generated cm-sized, so-called gravity-capillary sea waves. Because of the wavelength (5 cm), the signal of ASCAT is not affected by rain, and is therefore an "all-weather" system.
The all-weather capability of the ASCAT scatterometer provides unique wind field products of the most intense and often cloud-covered wind phenomena, such as polar front disturbances and tropical cyclones. As such, it has been demonstrated that scatterometer winds are extremely useful in the prediction of extra-tropical and tropical cyclone). Moreover, high-resolution near-surface winds as provided by scatterometers are very relevant because these winds drive the ocean water circulation, which in turn plays a major role in the climate system and in marine life and its exploitation (e.g., fishery).
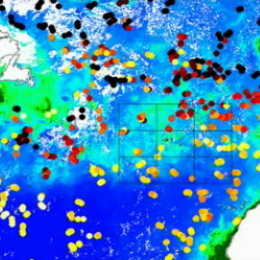
Presentation about satellite images of phytoplankton chlorophyll in the North Atlantic.
Presentation about satellite images of phytoplankton chlorophyll in the North Atlantic. André Valente introduces how phytoplankton chlorophyll is measured from space, describing the spatial and temporal patterns observed in the satellite images and identify the physical processes responsible for the observed variability.
The most important light-absorbing substance in the oceans is chlorophyll, which phytoplankton use to produce carbon by photosynthesis. Due to this green pigment - chlorophyll - phytoplankton preferentially absorb the red and blue portions of the light spectrum (for photosynthesis) and reflect green light. So, the ocean over regions with high concentrations of phytoplankton will appear as certain shades, from blue-green to green, depending upon the type and density of the phytoplankton population there. The basic principle behind the remote sensing of ocean color from space is this: the more phytoplankton in the water, the greener it is....the less phytoplankton, the bluer it is.