
Weather
Three different approaches to forecast road weather at Meteo-France are presented.
Length: 36 minutes.
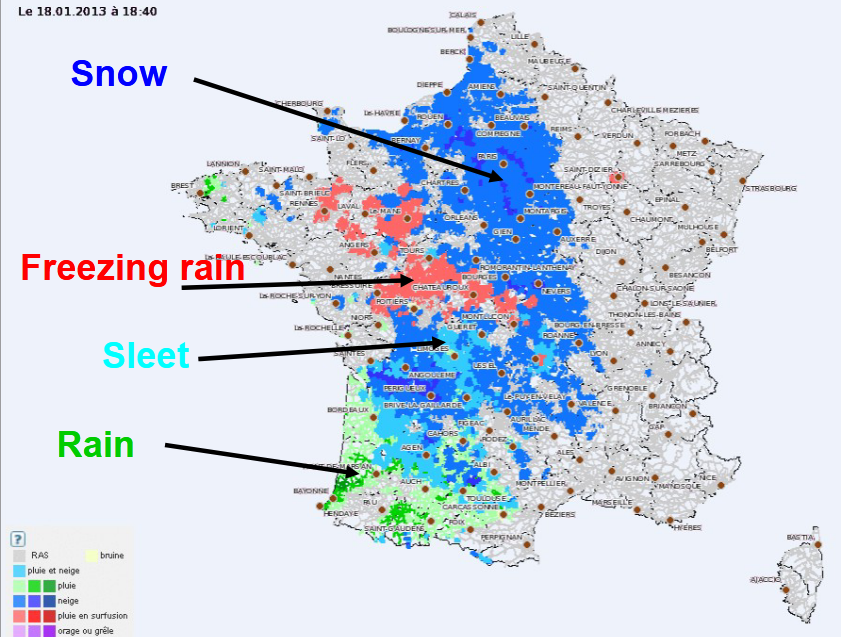
During winter, snow or ice presence on the road might have serious consequences on road traffic and security and many efforts were done for several years to develop decision-making tools for road management in winter. For this purpose, Météo-France uses, in an operational way a specific system dedicated to the road weatherforecast.
The first one, OPTIMA is a high-frequency (5 min) nowcasting system providing 1 hour forecasting and based on data fusion approach. It is dedicated to real time and short range anticipation of road impacting phenomenon. It was specially developed to work at the road network resolution (5km).
The data OPTIMA uses for the forecast process:
- Radar observation and nowcasting
- Surface observation network and road weather stations observations from customers
- Best available weather forecast (i.e. expertized by human forecasters)
- Specific road weather forecast
As an input for this decision-making tool, Météo-France uses numerical road models, which permit to simulate the behavior of a road under the influence of atmospheric conditions and the behavior of the snow on the road. Since 2012, road models are forced by human expertized atmospheric forecast instead of a direct coupling with numerical weather prediction models. Thissystems, called PEIR (Expertise Predictions for ISBA-Route), are the basis of road conditions forecasting products for French road managers.
Since the beginning of operational road weather forecast in Météo-France, all the products were based on deterministic forecasts, however since 2018/2019 winter, a new approach is tested, based on ensemble forecast.
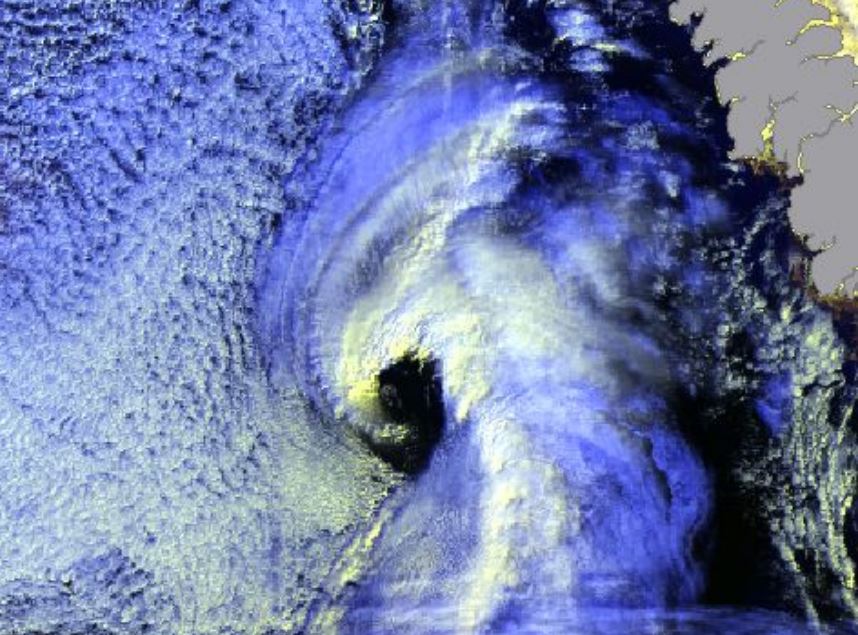
Gunnar Noer presents facts on Polar Lows, how they are forecasted, and gives examples of interpretation of satellite imagery.
Length: 55 min
Author: Gunnar Noer (MetNo)
Polar Lows can be seen as small Arctic hurricanes, and they have a severe impact on shipping and coastal communities in Scandinavia. They are most common in the Barents Sea and the Norwegian Sea, but are also known to occur in the central North Sea and surrounding coastal areas. Polar lows are the most intense type of wintery convection weather phenomenon in this area. Thus, a familiarity with Polar Lows will also increase our ability to forecast the more common snow shower events in the winter season. This talk will present some facts on Polar Lows, how they are forecasted, and give examples of interpretation of satellite imagery.
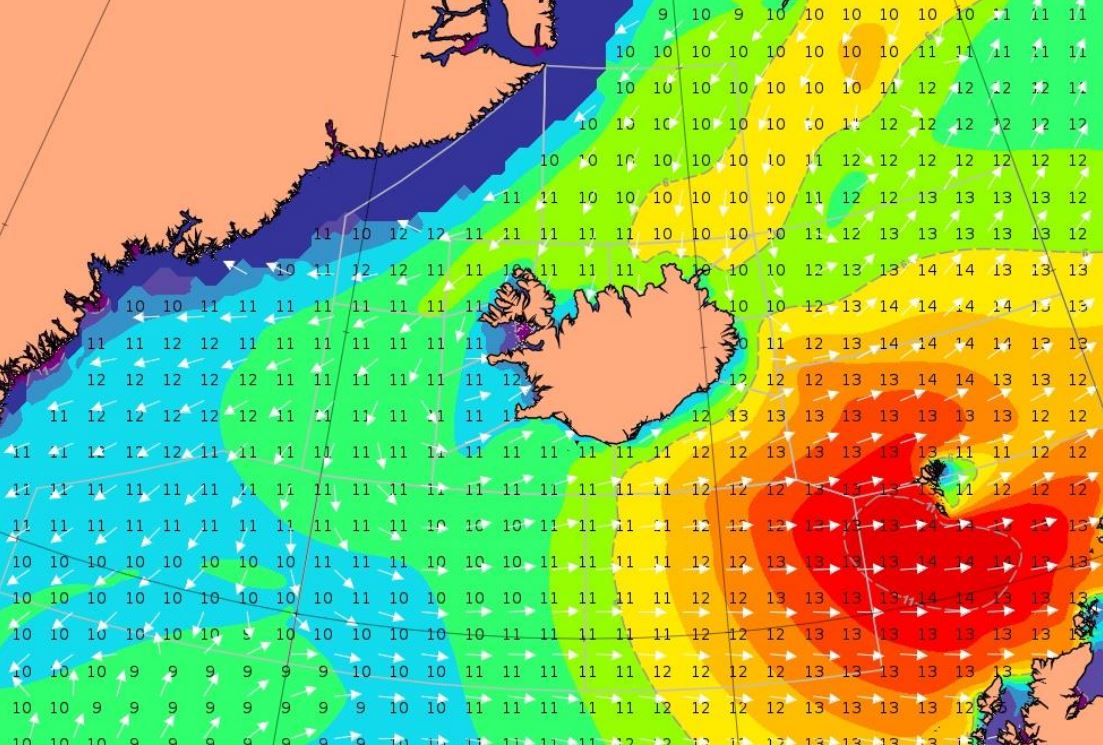
Björn Einarsson analyzes a storm moving south-east of Iceland.
Length: 30 min
Author: Björn Einarsson
Case 1. Between April 2. and April 4. 2018, gale to storm force winds from the west propagated from Cape Farewell, the southernmost point of Greenland over 1000 nautical miles across the Atlantic towards and past the Faroes Islands with high waves. This type of eastward wind/wave field propagation south of Iceland happens few times a year with varying intensity. Case 2. A showcase of the westerly Greenland tip jet creating large waves – but looking at the forecasted winds and waves versus observations, they seem contradictory, making the forecaster think twice.
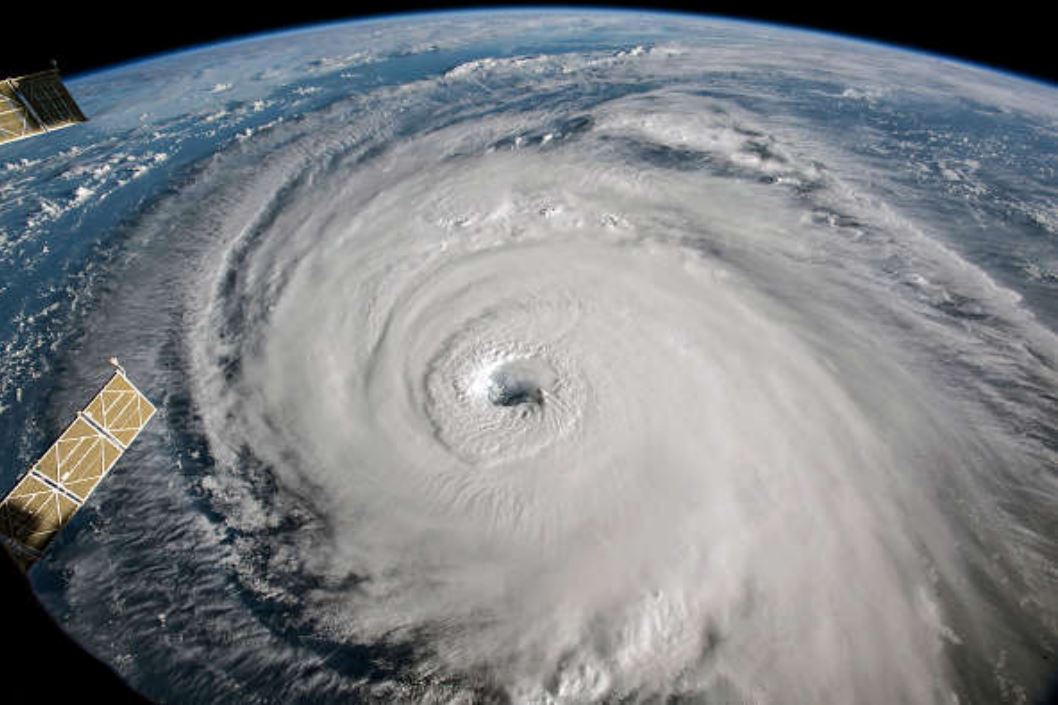
Carlos Ramalho presents some tropical and extra-tropical cyclones that affected the Azores and the challenges forecasters face in this situations.
Length: 30 min
Author: Carlos Ramalho (IPMA)
Due to the Azores geographical location, this archipelago is occasionally affected by strong Extratropical cyclones and Tropical cyclones. Extratropical cyclones are more frequent in winter and are often associated with strong winds, heavy precipitation and heavy waves which can be damaging and contribute to social and economic distress. Tropical cyclones, on the other hand occur mostly in September and October and in the past have caused loss of lives and property damage. Forecasting this type of systems is very challenging, mostly because a small variation in path can cause large difference in the impacts. This talk presents some tropical and extratropical cyclones that affected the Azores and also the challenges that forecasters face in this situations.
Annika Hjelmsten reports about the challenges in ship routing.
Length: 25 min
Author: Annika Hjelmsten (SMHI)
In a world where vessels grow larger and larger and the fuel prices are steadily increasing, finding ways to minimizing the fuel consumption is of the outermost importance for the shipping industry. By optimizing the routes with respect to meteorological and oceanographic parameters, as well as the parameters set by individual vessels characteristics, we can significantly reduce the fuel consumption. This is most beneficial not only for our clients who save money, but also for the environmental. As different kinds of vessels have very different characteristics, the job requires an extensive knowledge of both the ships and the shipping industry, as well as in meteorology and oceanography.
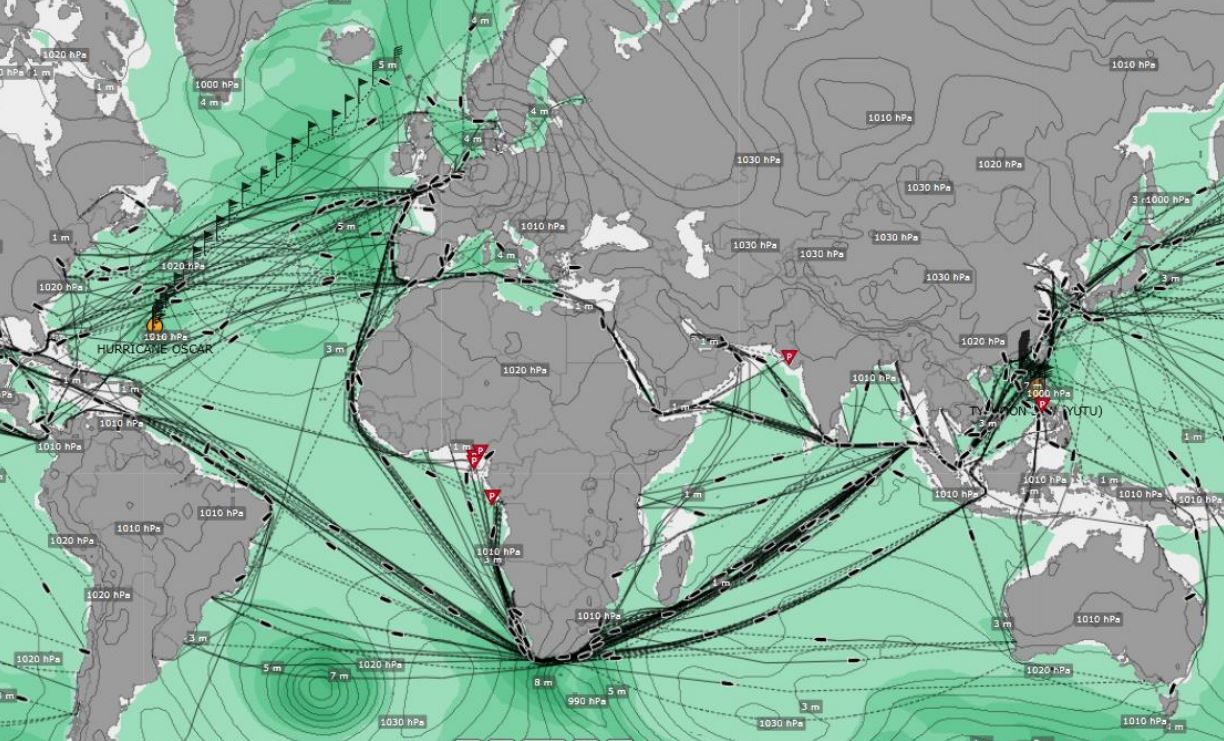
Joseph Sienkiewicz discusses forecasting challenges for large ocean areas along with the application of satellite winds and waves.
Length: 60 min
Author: Joseph Sienkiewicz (NOAA)
The NOAA Ocean Prediction Center (OPC) is responsible for weather warnings and forecasts for the western North Atlantic and eastern and central North Pacific Oceans. The oceans remain relatively data sparse for observed conditions. To compensate, OPC has successfully used winds from scatterometers and wave heights from altimeters to better understand and predict hazardous conditions over the waters of responsibility. Weather forecasting challenges for large ocean areas will be discussed along with the application of satellite winds and waves.
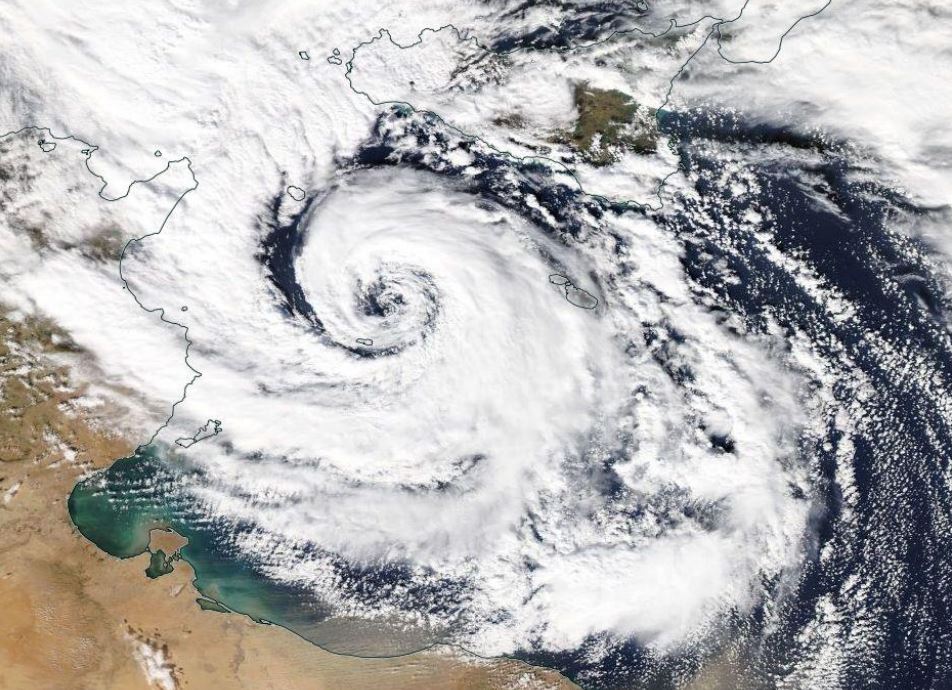
Ioannis Pytharoulis shows past cases of Medicanes, the description of their structure and characteristics.
Length: 50 min
Author: Ioannis Pytharoulis (Aristotle University of Thessaloniki)
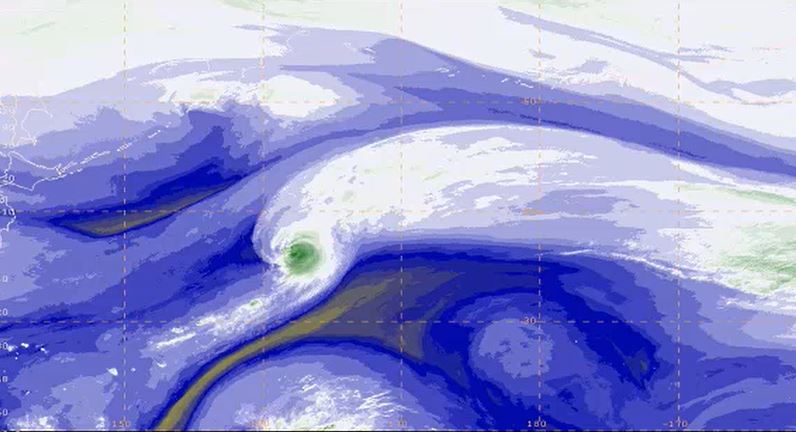
The Mediterranean tropical-like cyclones are intense sub-synoptic maritime lows with strong winds, axisymmetric warm-core structure and tropical cyclone features, such as a cloud-free eye and spiral deep convection. They are frequently referred to as medicanes (MEDIterranean hurriCANES) due to their resemblance to tropical cyclones. Despite their low frequency (of about 1.1-1.6 systems per year), medicanes constitute a serious natural hazard to life, property and the environment of the coastal regions of the Mediterranean basin and the Black Sea. Their accurate prediction is a challenge for the numerical weather prediction models. This presentation includes some past cases of medicanes, the description of their structure and characteristics, criteria that are used to define them, the development mechanisms, climatology, consequences and finally a detailed case study of medicane Qendresa (November 2014).
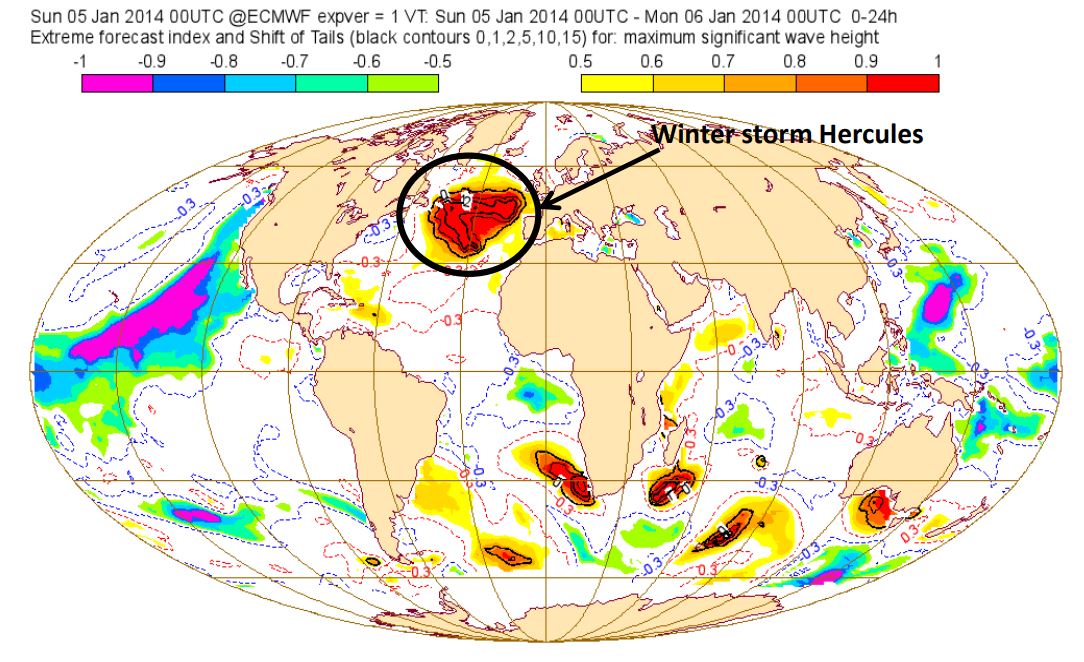
Ivan Tsonevsky demonstrates two recent EFI/SOT products for forecasting severe thunderstorms, their interpretation and practical use.
Length: 50 min
Author: Ivan Tsonevsky (ECMWF)
ECMWF provides the Extreme Forecast Index (EFI) and Shift Of Tails (SOT) as tools to help forecasting anomalous and extreme weather by measuring the difference between the Cumulative Distribution Function (CDF) of the real-time ensemble forecast and the model climate (M-climate) CDF. The definition of the EFI and SOT will be presented alongside the M-climate configuration. Verification results and EFI/SOT products will be shown with examples to demonstrate their use and interpretation. Some advantages and limitations of the EFI and SOT will be discussed. Examples focused on the available EFI/SOT for marine forecasting will be given as well. Two recent EFI/SOT products for forecasting severe thunderstorms and their interpretation and practical use will be demonstrated.
Zorana Jelenak describes how altimeters work, how data is used for everyday marine forecasting at NOAA and assimilation.
Length: 60 min
Author: Zorana Jelenak (NOAA)
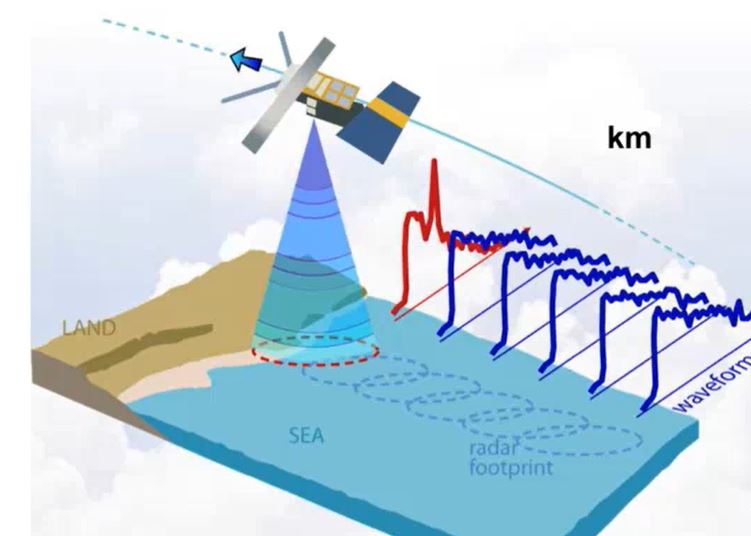
Altimeter data have been used to produce maps of sea surface height, geostrophic velocity, significant wave height and wind speed. This information is of proven use to mariners as well as to the scientific community. Uses of the data include commercial and recreational vessel routing, ocean acoustics, input to geographic information systems developed for the fishing industry, identification of marine mammal habitats, fisheries management and monitoring ocean debris. Such information is accessible in near-real time (within 3 to 48 hours) and to improve weather forecasting models by assimilation. 25 years of data makes it possible to study the whole ocean or regional areas for offshore industries or navigation. In hurricane studies altimetry measures very high waves and strong winds, but also helps identify sea surface height anomalies which can be used as proxies of the warm currents - hurricanes energy source. The lecture will describe how altimeters work, how data is used for everyday marine forecasting at NOAA and assimilation, devoteting special attention to data accuracy and limitations.
Jean Bidlot gives an overview on the ECMWF wave model products.
Length: 50 min
Author: Jean Bidlot (ECMWF)
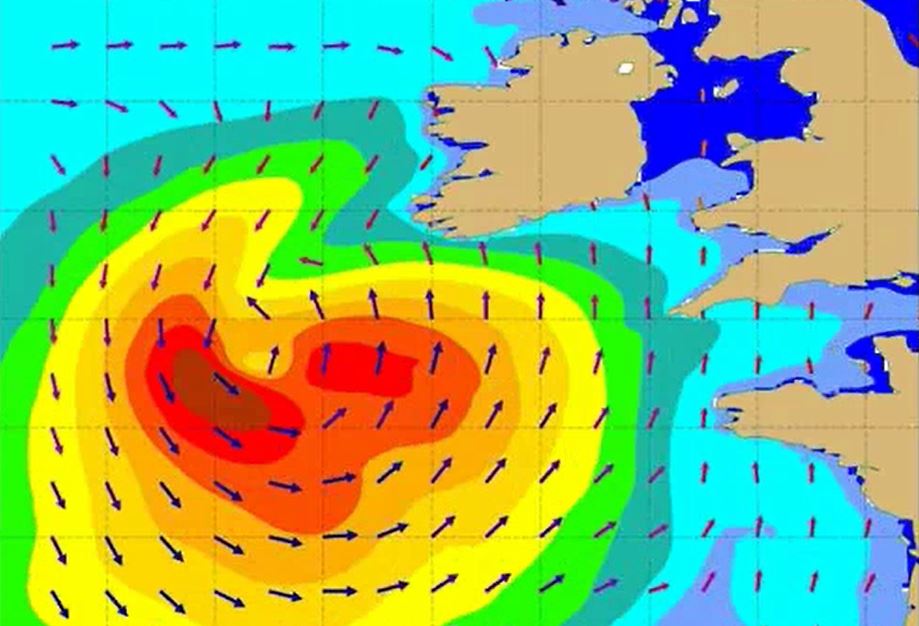
Wave models are able to give a very detailed description of the conditions at the surface of the oceans. The mean sea state is fully described by the 2d wave spectrum. This detailed description is however not always very practical and the bulk of the information contained in the 2d spectrum is usually reduced in the form of a set of integrated parameters, from a simple few such as significant wave height, mean wave direction and mean wave period, to more sophisticated parameters that described distinct part of the wave fields. Recent advances in the understanding of wave dynamics have lead to the development of new set of parameters that give information on the possible largest single wave that might exist over a certain area within a certain time frame. It is now possible to describe the sea state with different level of complexity depending on the user needs.
Michael Folmer presents examples of relevant applications of Sentinel-3A data.
Length: 55 min
Author: Michael Folmer (NOAA)
The EUMETSAT-operated Copernicus Sentinel-3A satellite has been providing near-real time data to the marine community since mid-2016, and will be soon be joined in operations by its sister, Sentinel-3B. This presentation will give an overview of the available Sentinel-3 marine products, with a primary focus on data streams associated by the altimeter (SRAL) and sea surface temperature radiometer (SLSTR). Examples of the relevant applications will be presented, along with a discussion of how users can best access data and monitor its quality.
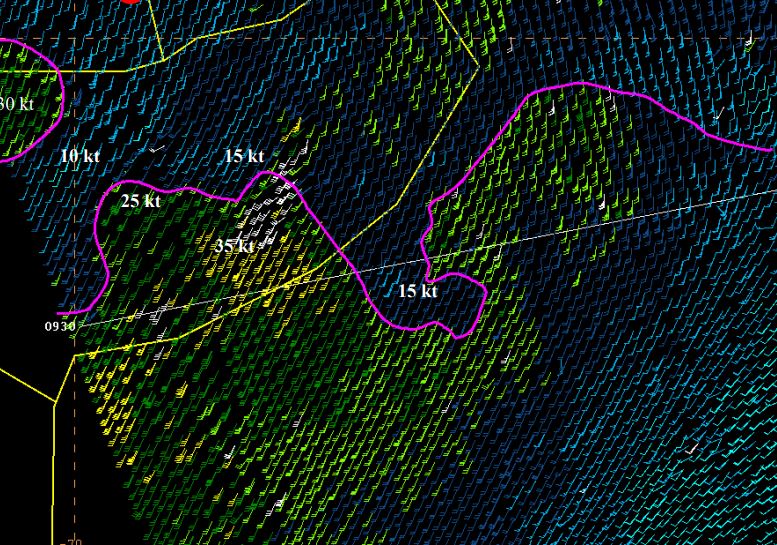
Ad Stoffelen focuses on scatterometer winds, how good they are and what aspects need attention.
Length: 60 min
Author: Ad Stoffelen (KNMI)
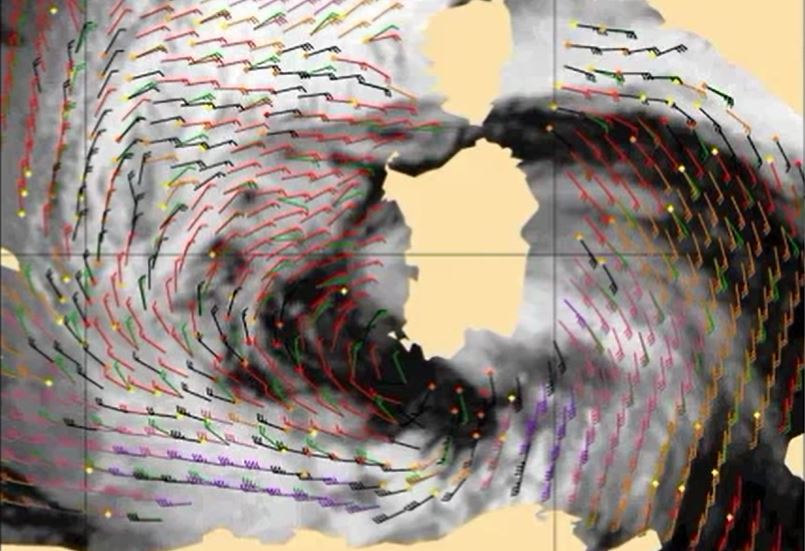
Winds over sea are essential for marine forecasting and used in nowcasting and numerical weather prediction (NWP) to aid in off-shore activities (energy sector, transport, fisheries and recreation), particularly to secure safety of life and property. Winds over sea are observed by satellites and available from NWP model forecasts. Most satellite winds over sea are provided by scatterometers; they provide swath fields of both wind speed and wind direction from polar satellites. Currently, winds from EUMETSAT’s MetOp-A, MetOpB and the Indian ScatSat-1 are operationally available and provide good coverage around 9:00 and 21:00 local solar time (LST). Very soon they will be complemented by a few more. The lecture focuses on what scatterometer winds really represent, how good they are and what aspects need attention when applying these winds in your routine operations alongside with NWP model winds.