Weather situation on 11 Nov 2014
The Polarstern is sailing in the center of the ITCZ. In the Severe Storms RGB there are small cells with strong convection.
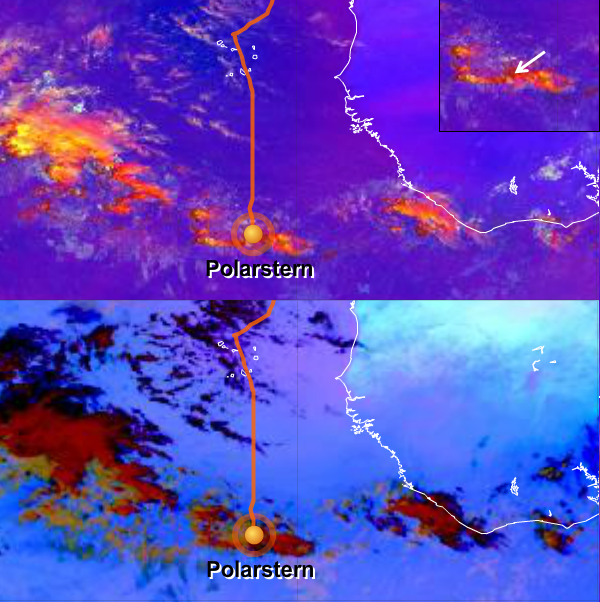
Figure L2-16: 11 Nov 2014, 12:00 UTC. Above: Severe Storms RGB.
Below: Dust RGB. Source: EUMeTrain.
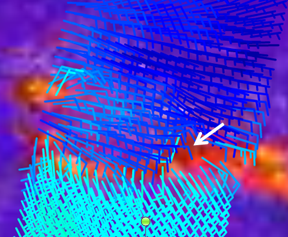
Figure L2-17: 11 Nov 2014, 12:00 UTC. Severe Storms RGB, ASCAT wind vector from Metop. Source: EUMeTrain.
The ASCAT image (Fig. L2-17) helps to define this zone as the center of the ITCZ. The convergence of easterly winds north of the ITCZ and southeasterly winds to the south of it is clearly visible.
Fig. L2-18 shows two important ingredients of strong thunderstorms: total precipitable water (TPW) from the ECMWF model with a maximum around the ITCZ, and the aforementioned wind convergence. The TPW is the depth of water in a column of the atmosphere, from the surface to the top of the atmosphere, if all the water in that column were precipitated as rain.
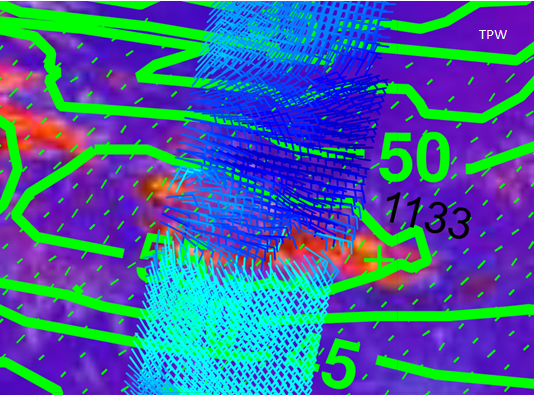
Figure L2-18: 11 Nov 2014, 12:00 UTC. Severe Storms RGB and TPW from ASCAT. Source: EUMeTrain.
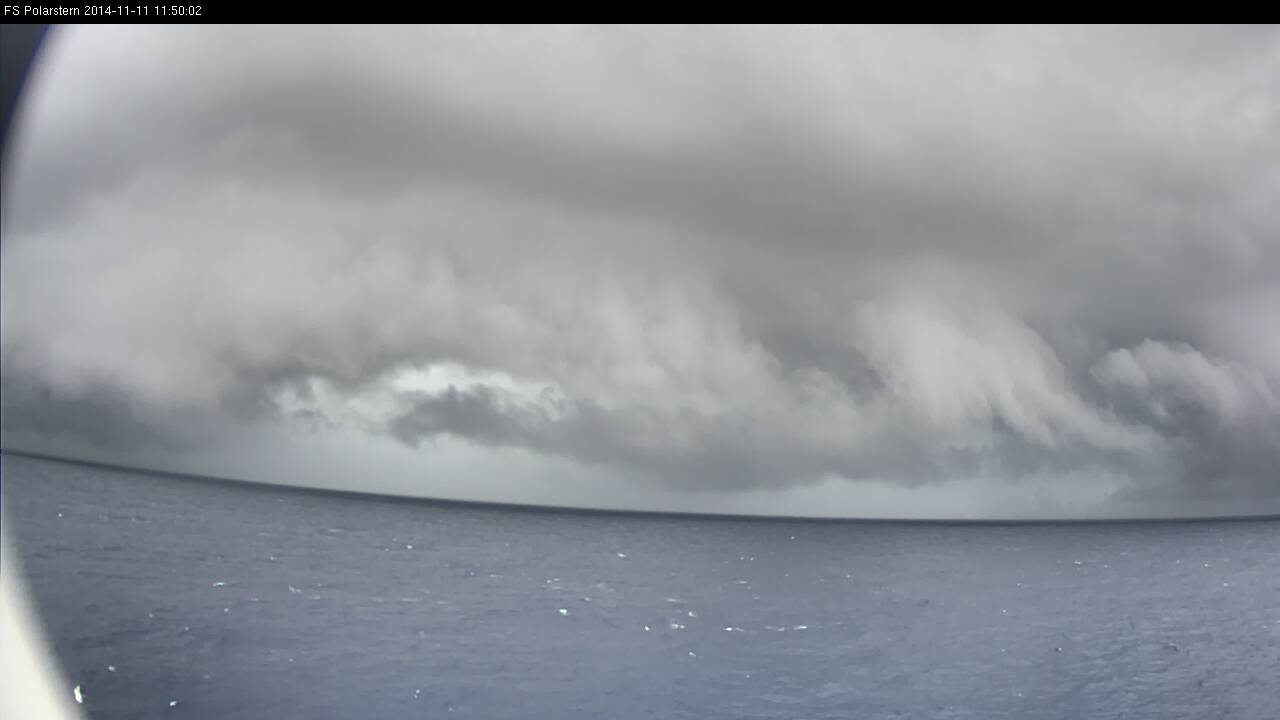
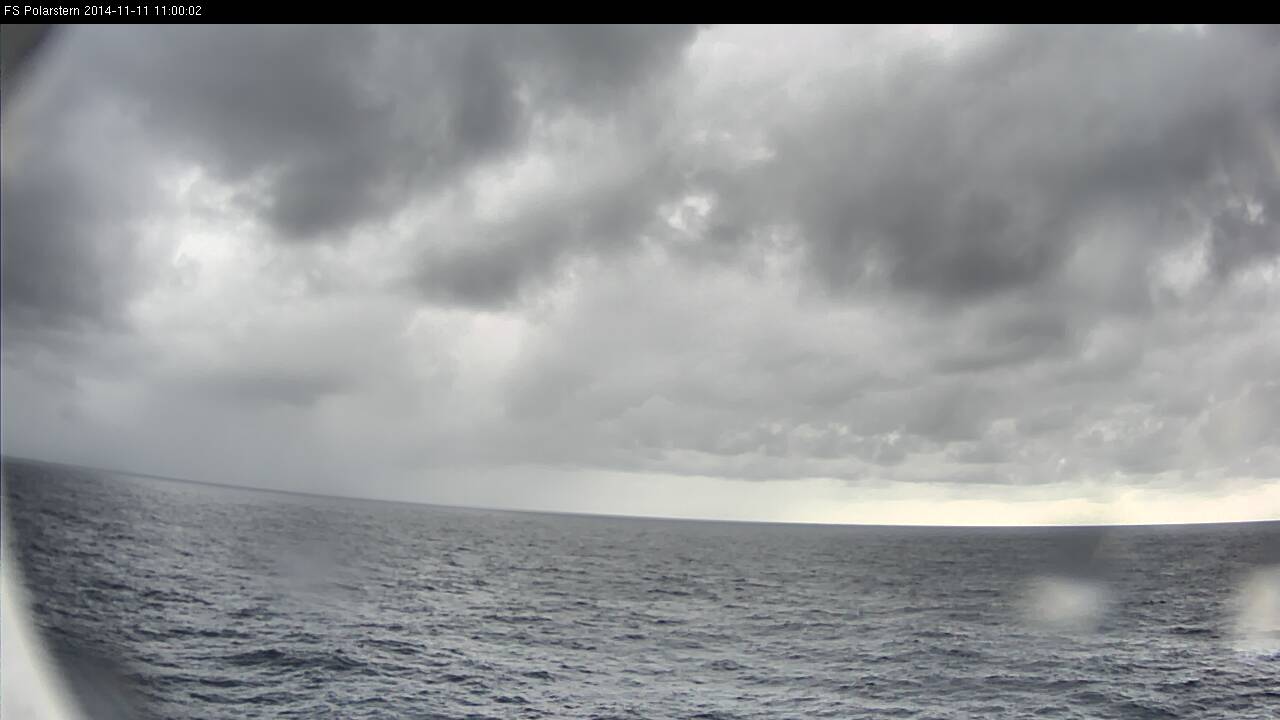
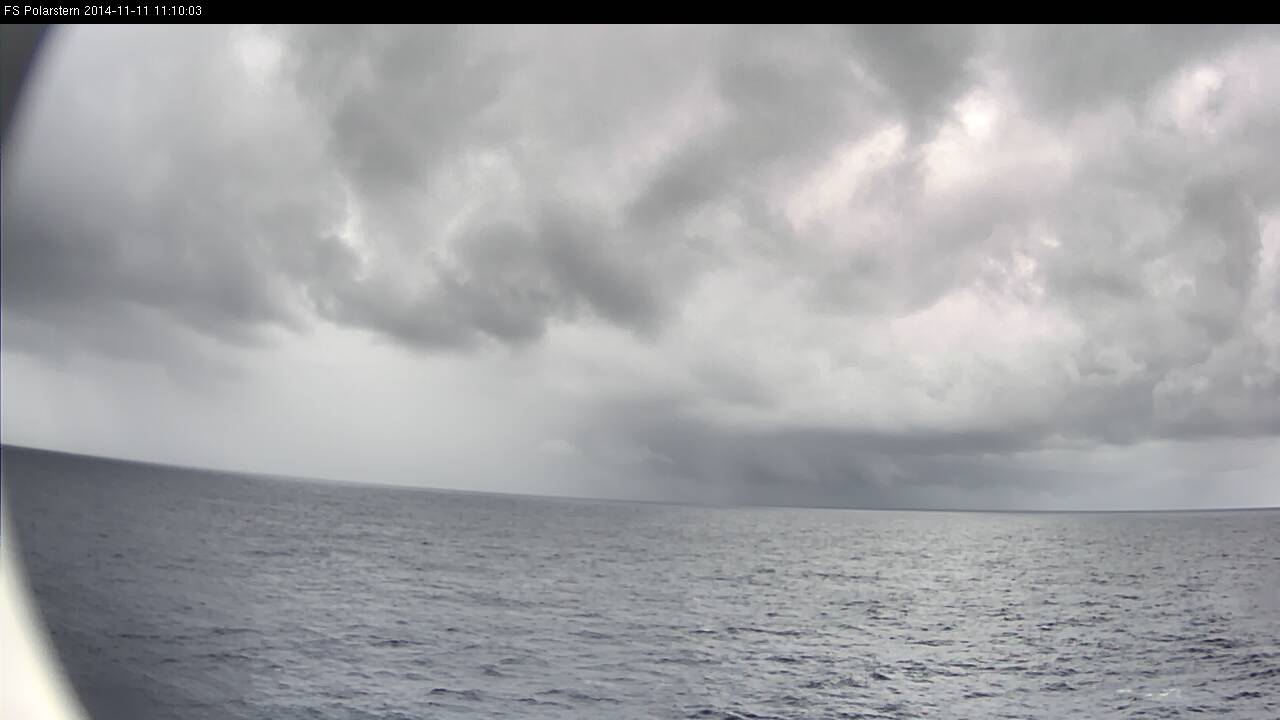
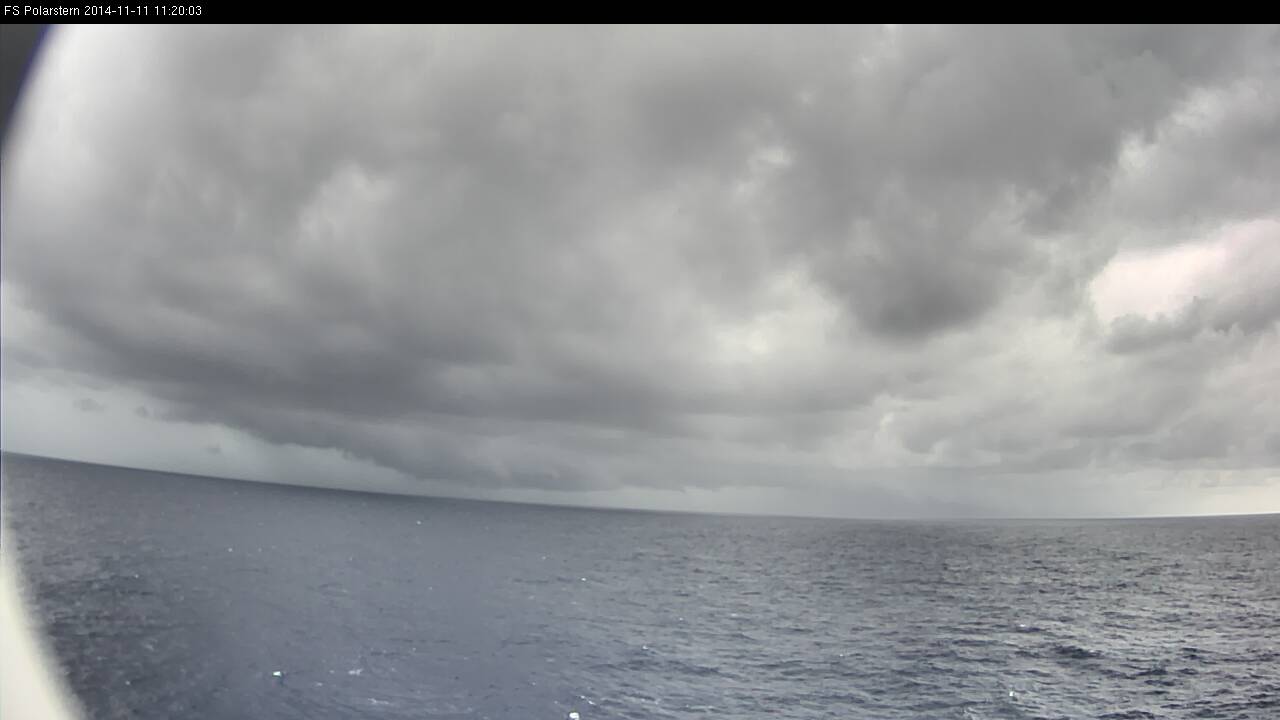
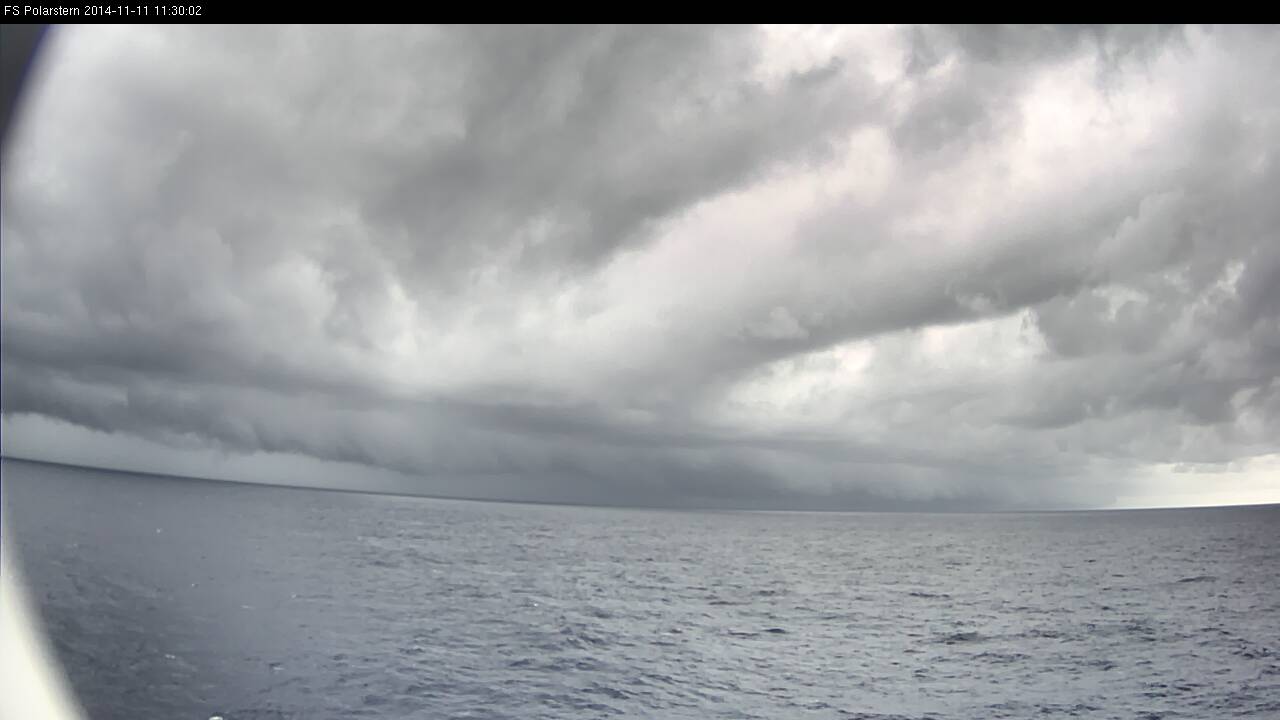
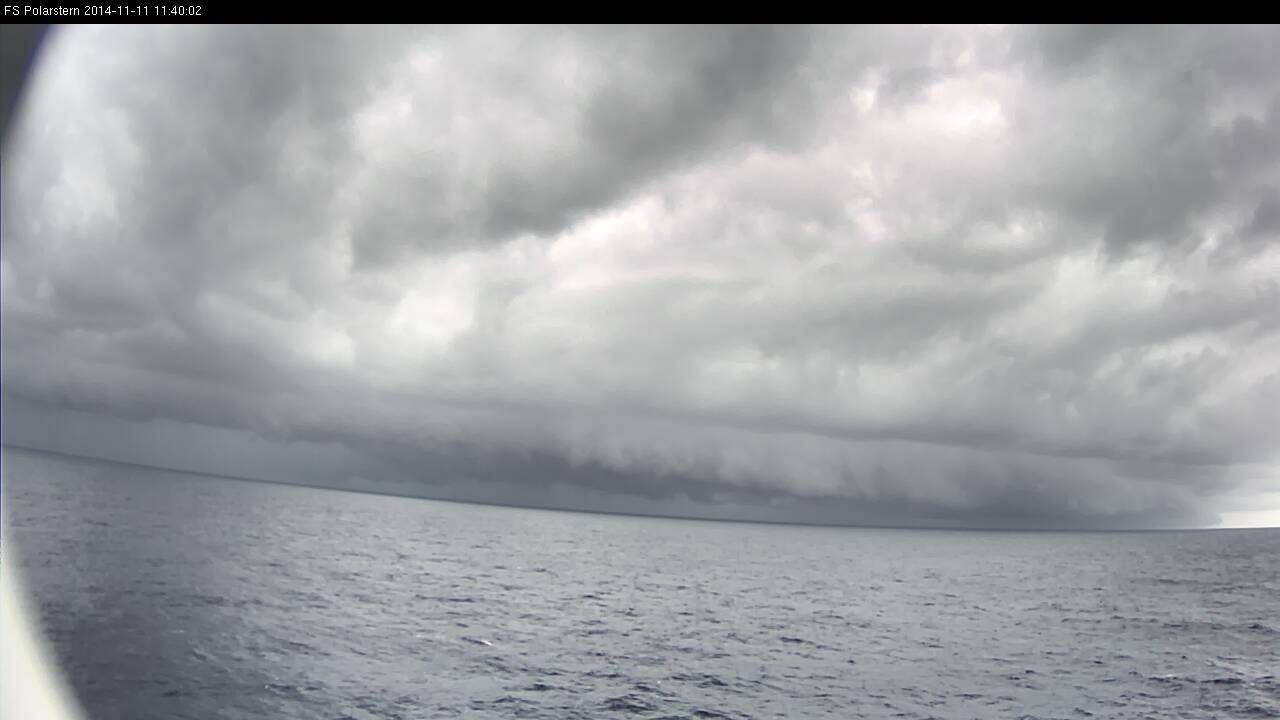
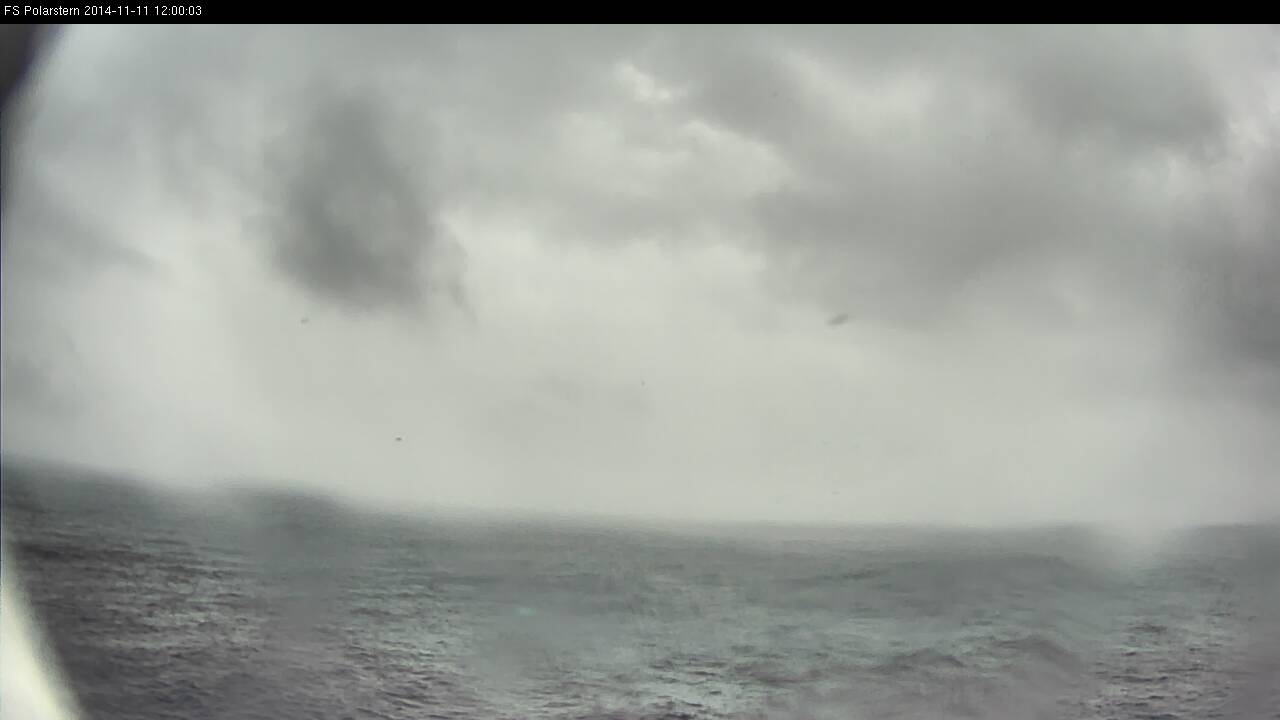
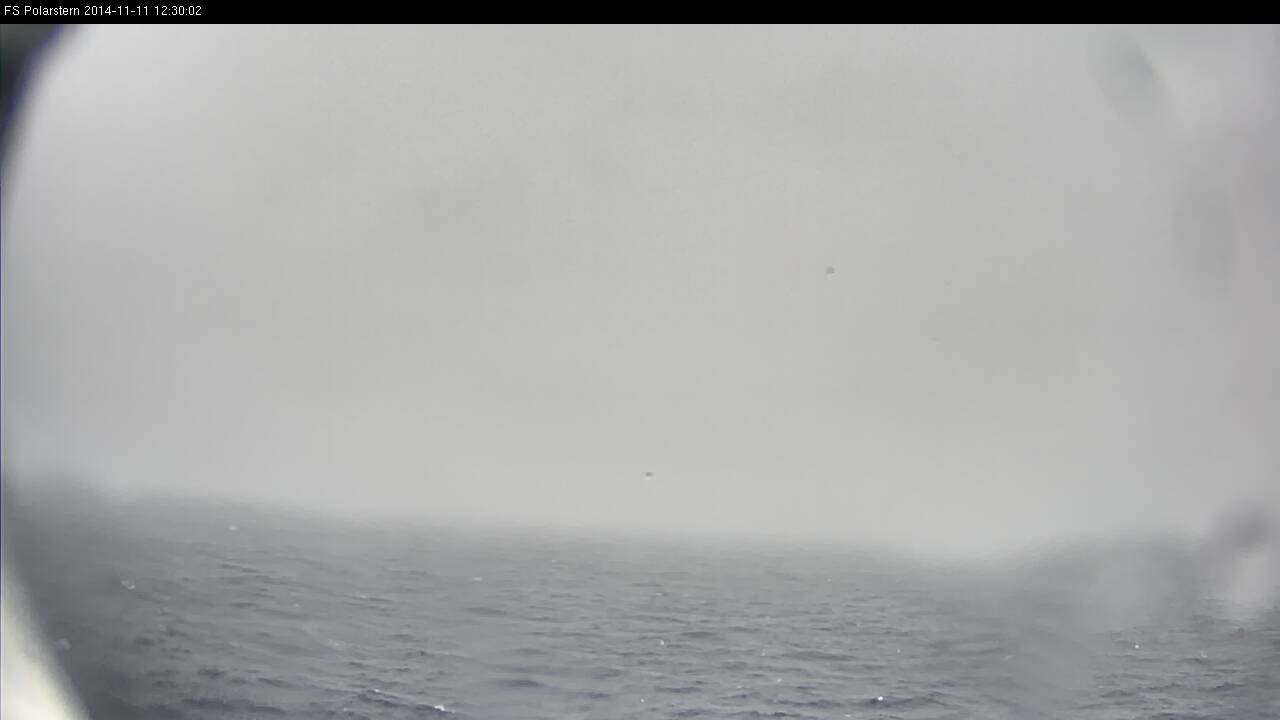
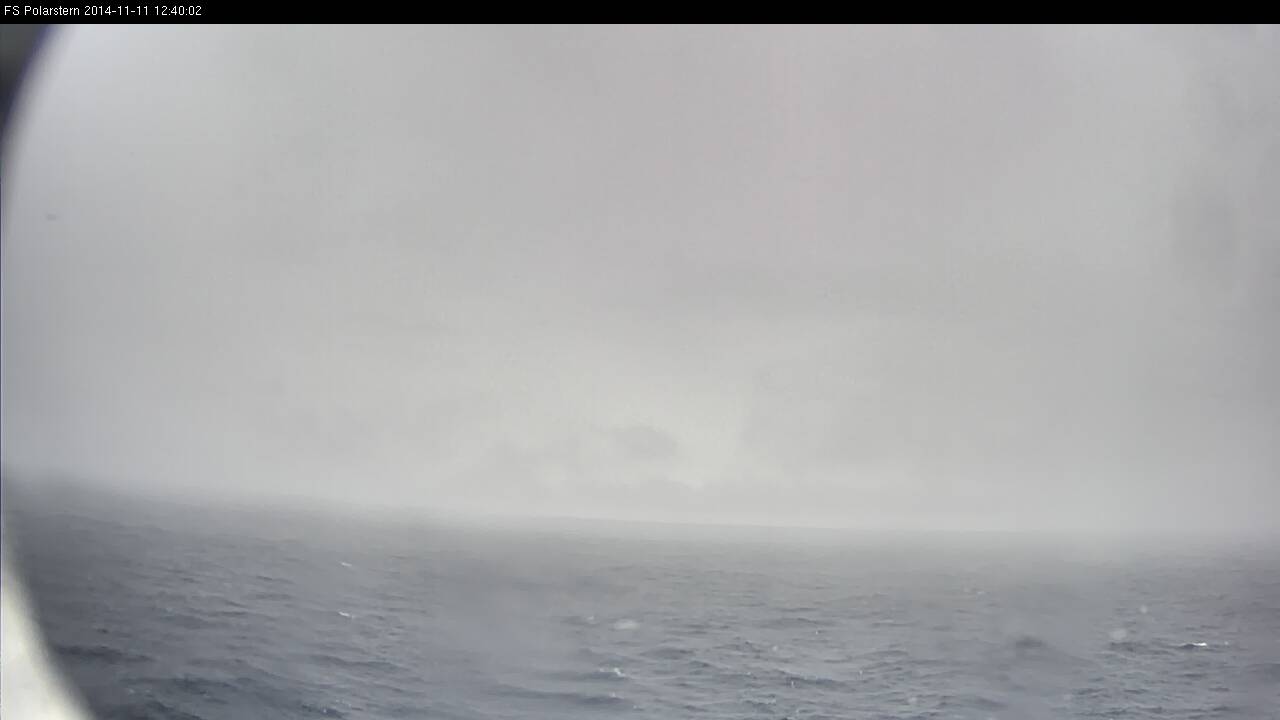
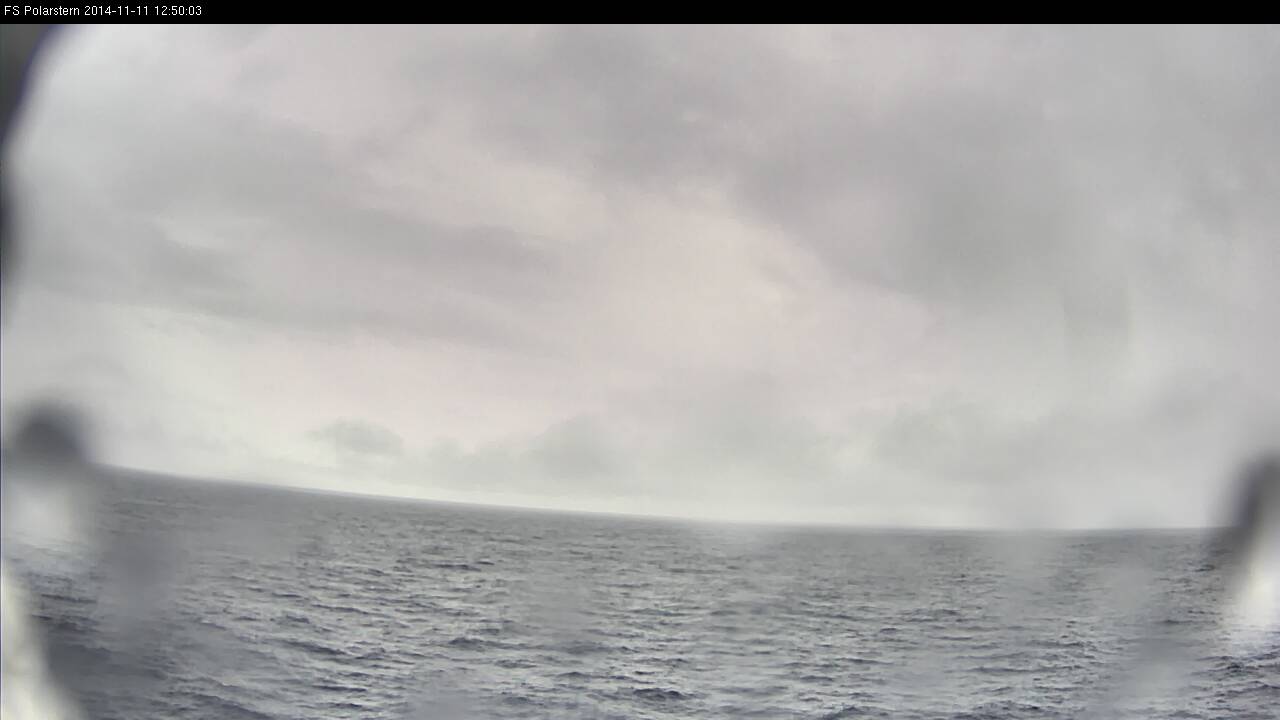
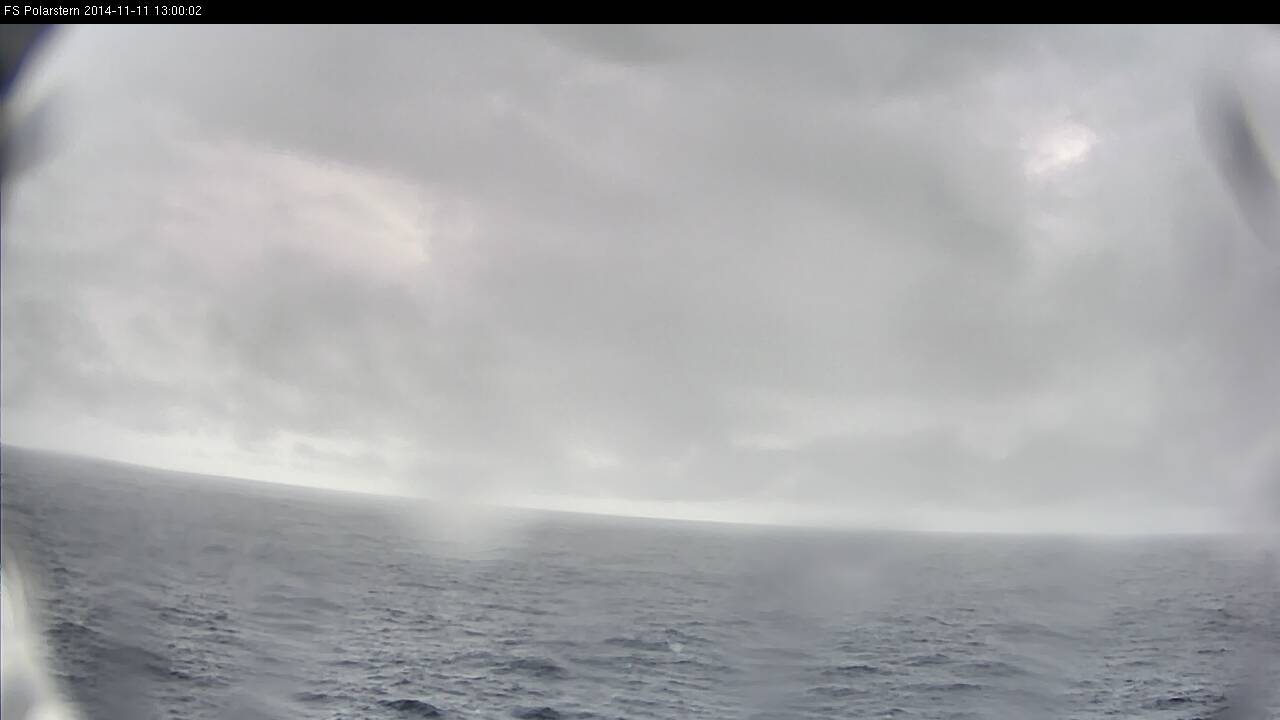
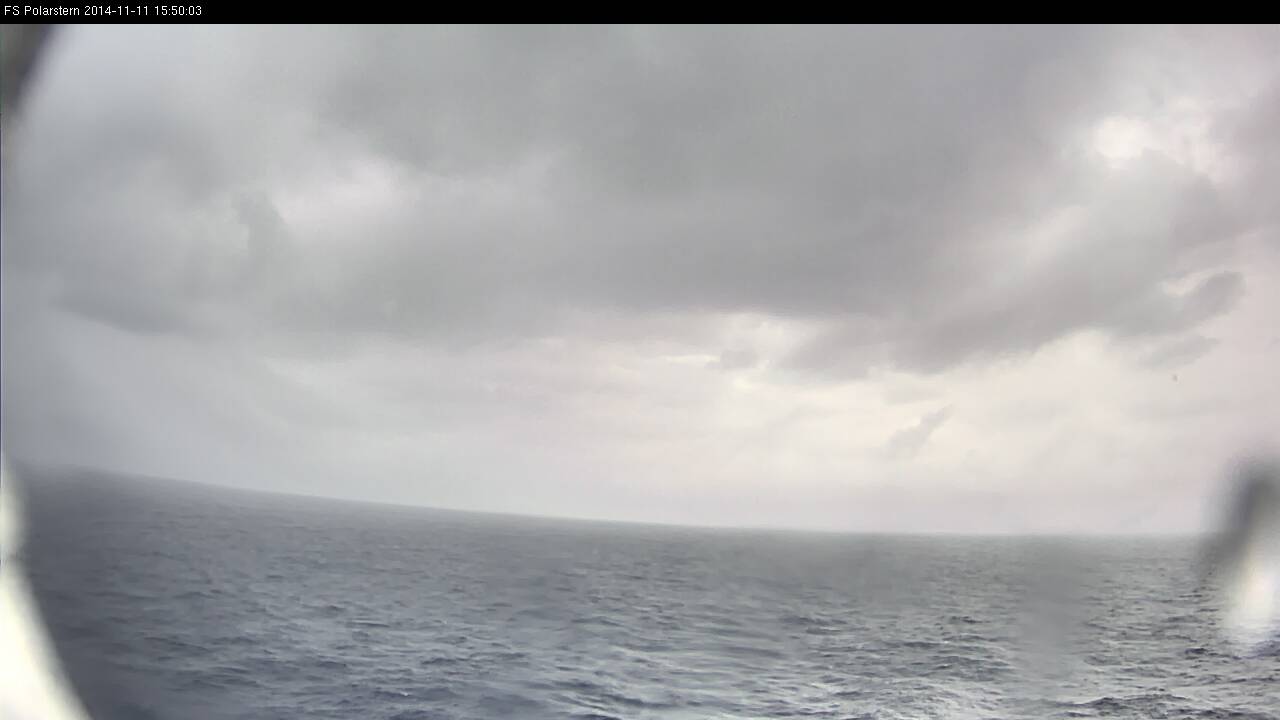
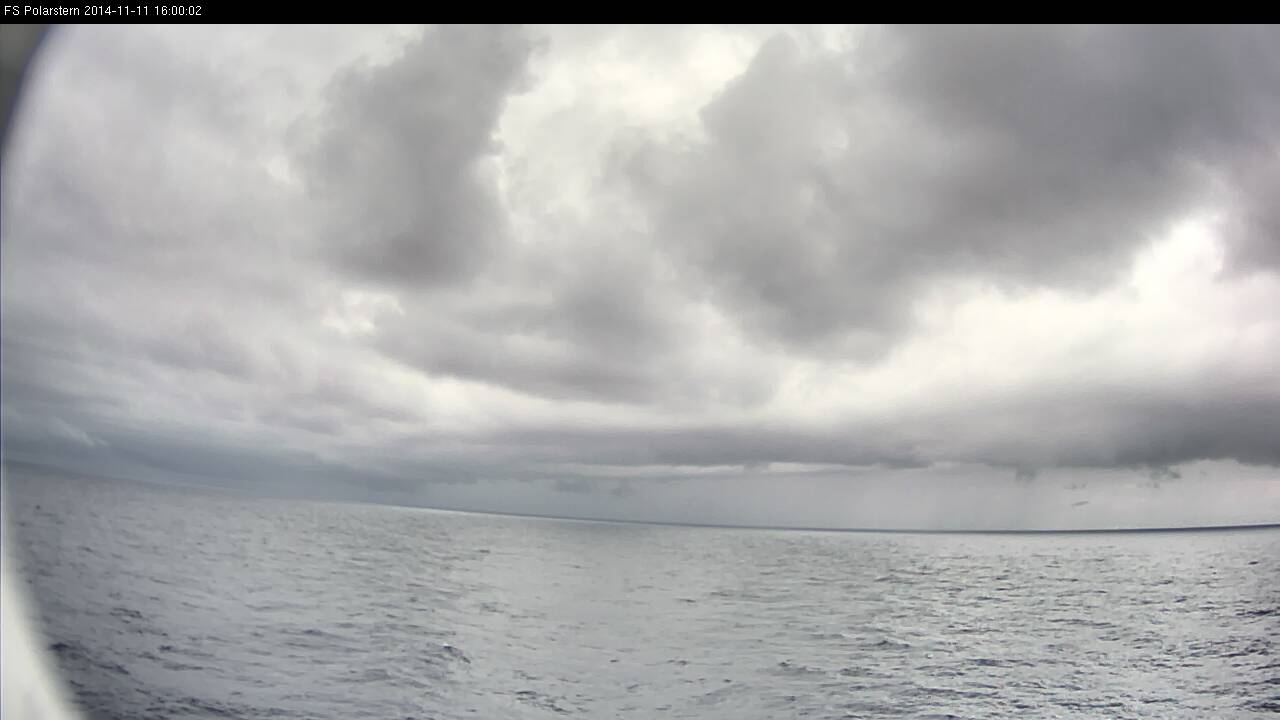
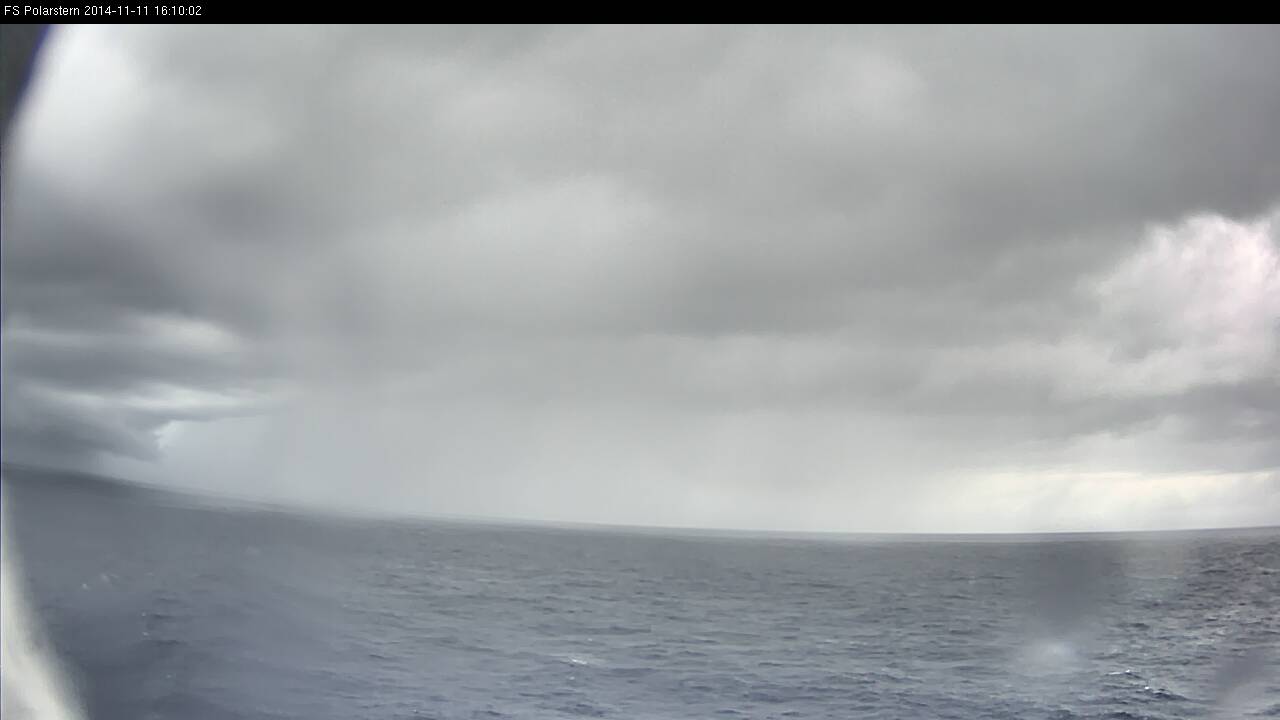
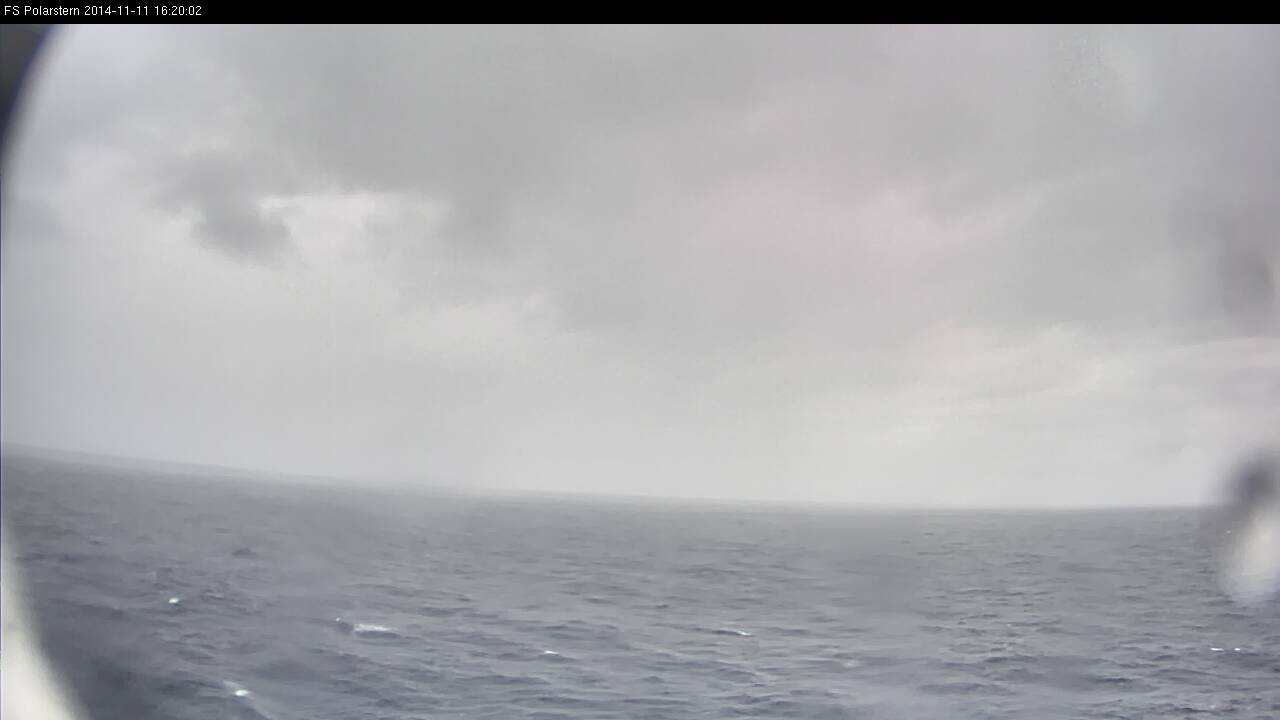
Figure L2-19: 11 Nov 2014, 11:50 UTC. Clouds in the center of the ITCZ. Source: DWD.
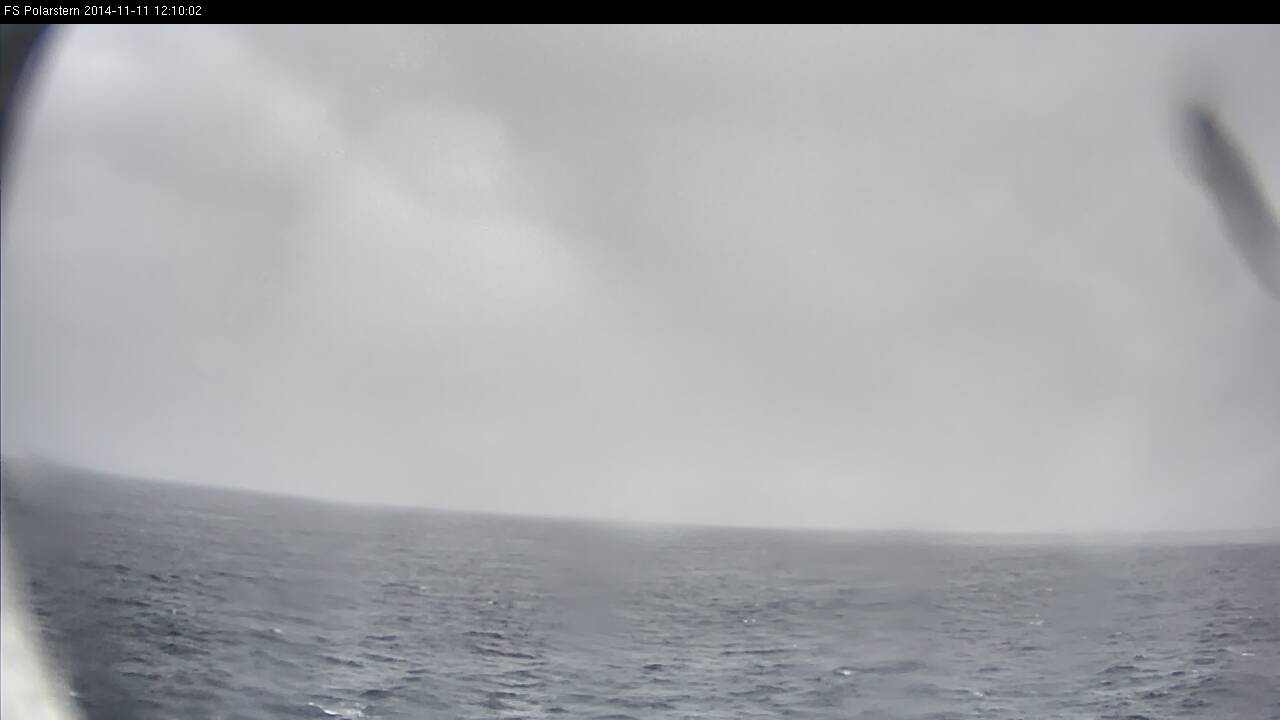
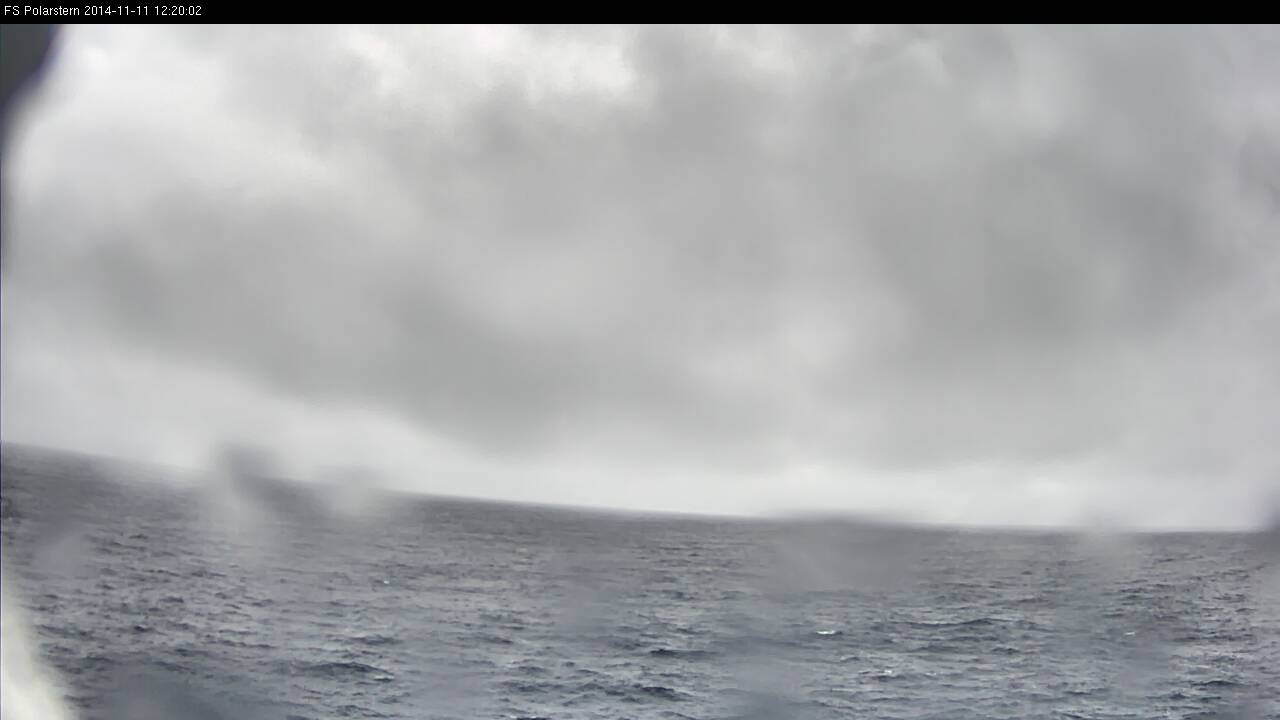
In this image the strong wind convergence and the resulting turbulence are very impressive.
DBLK 11121 99040 70230 11496 81206 10247 20229 40122 51003 6///1 78082 889//
22242 04281 20301 315// 40803 6//// =
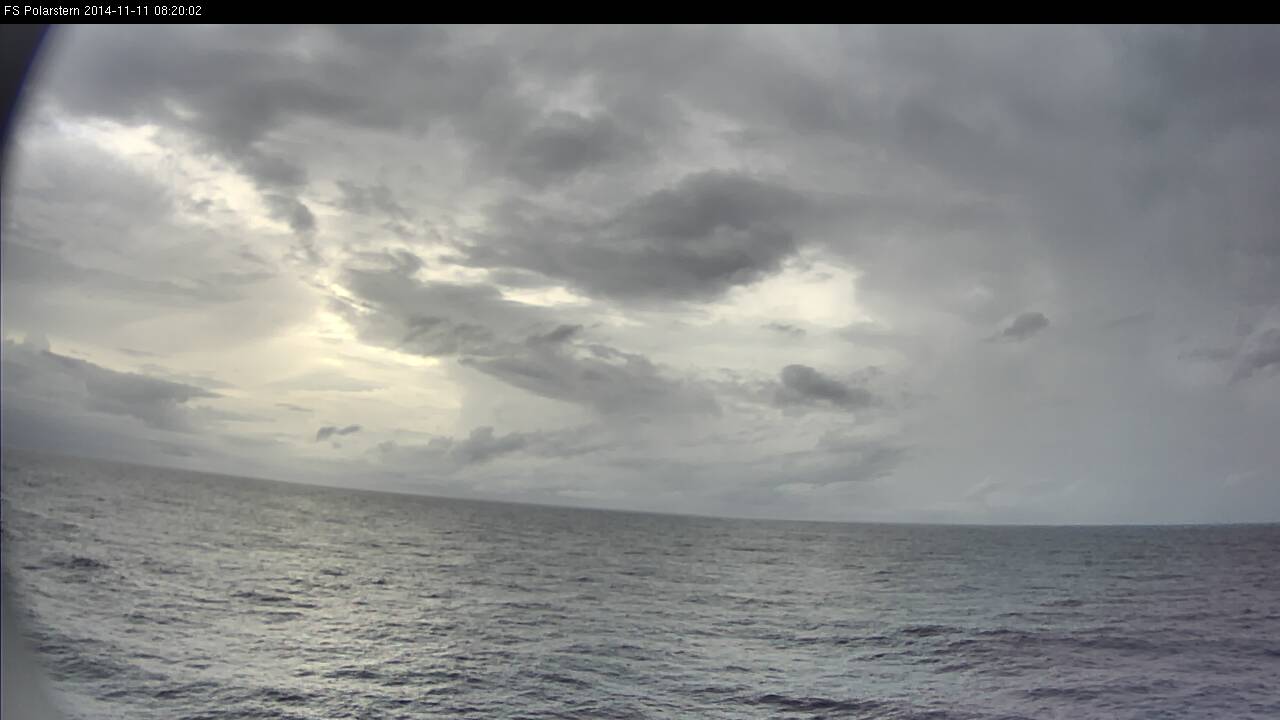
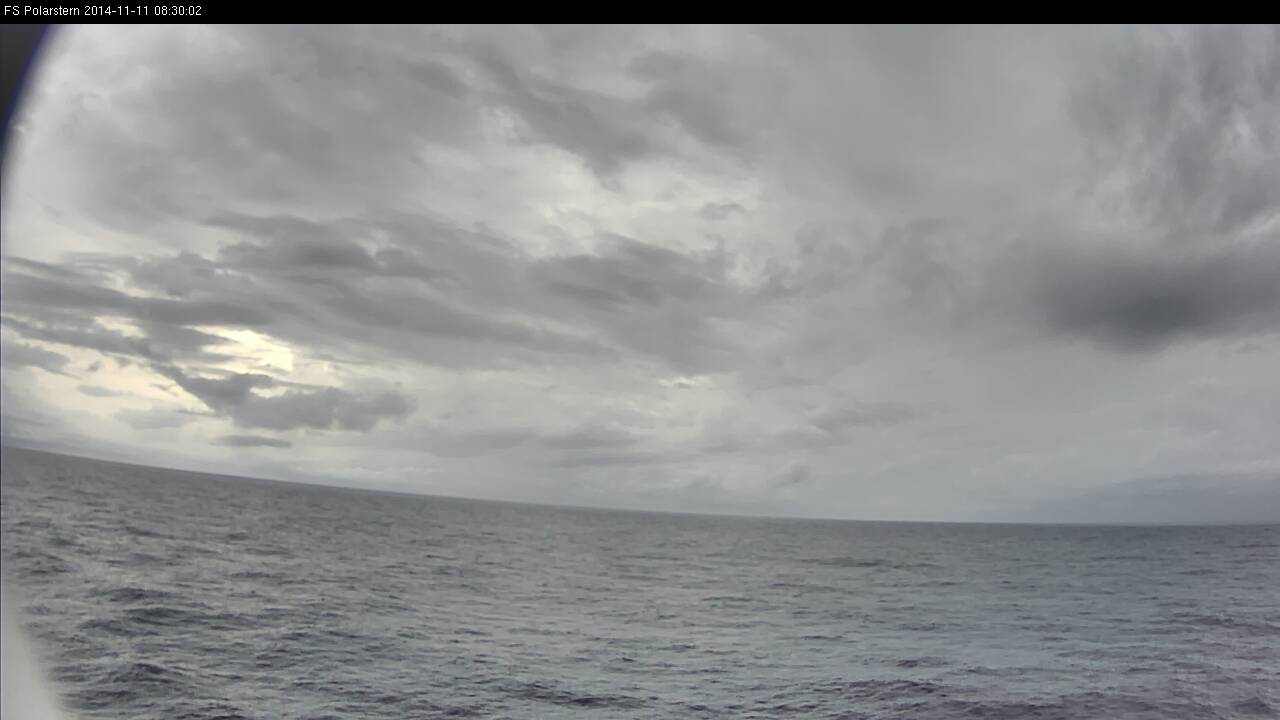
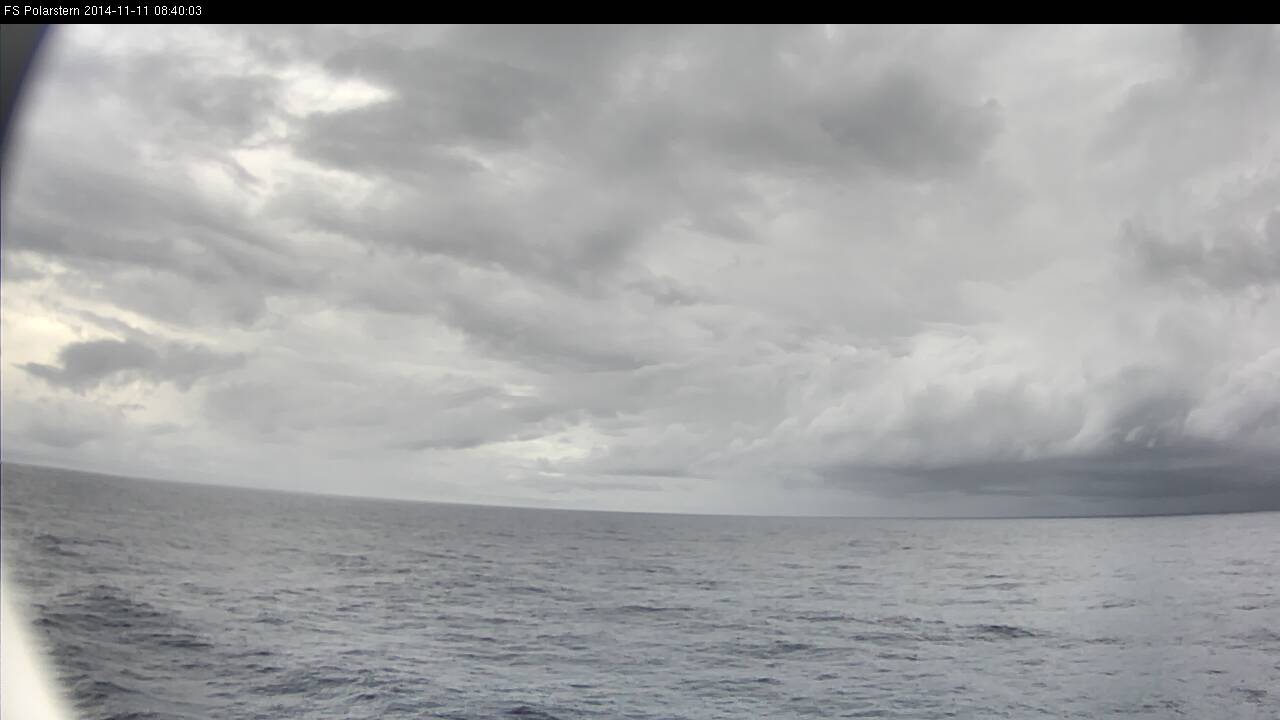
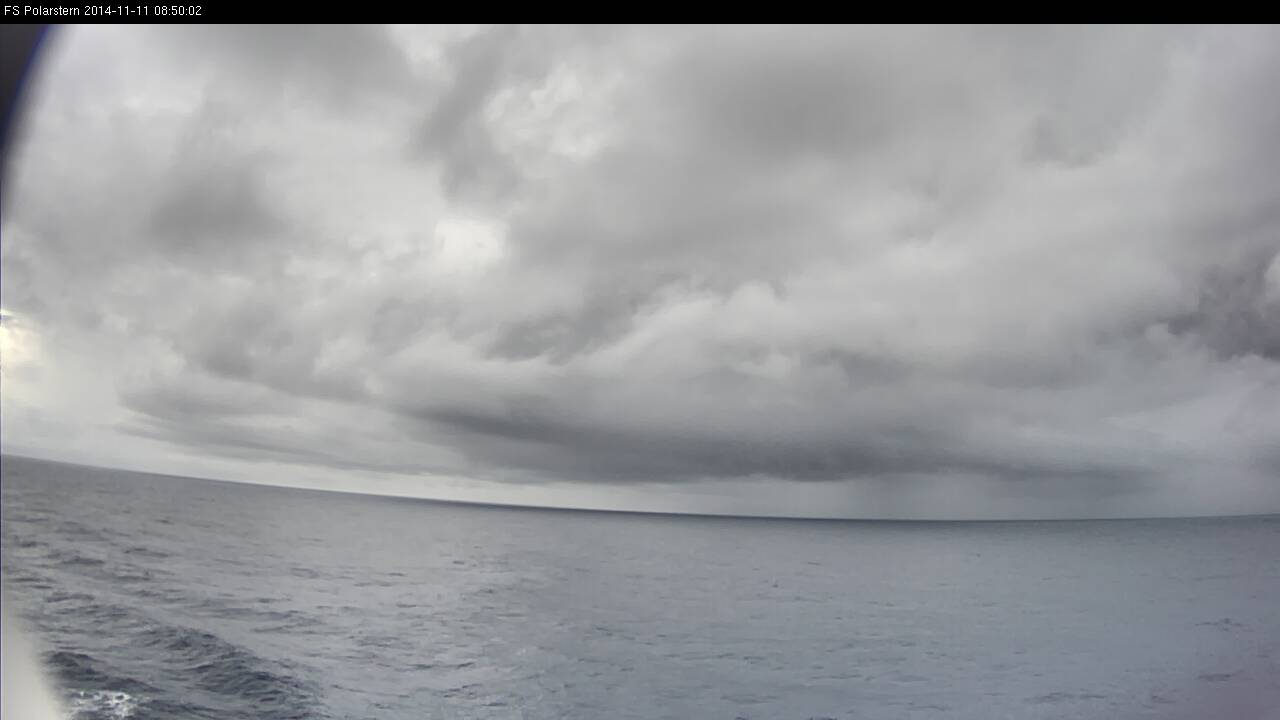
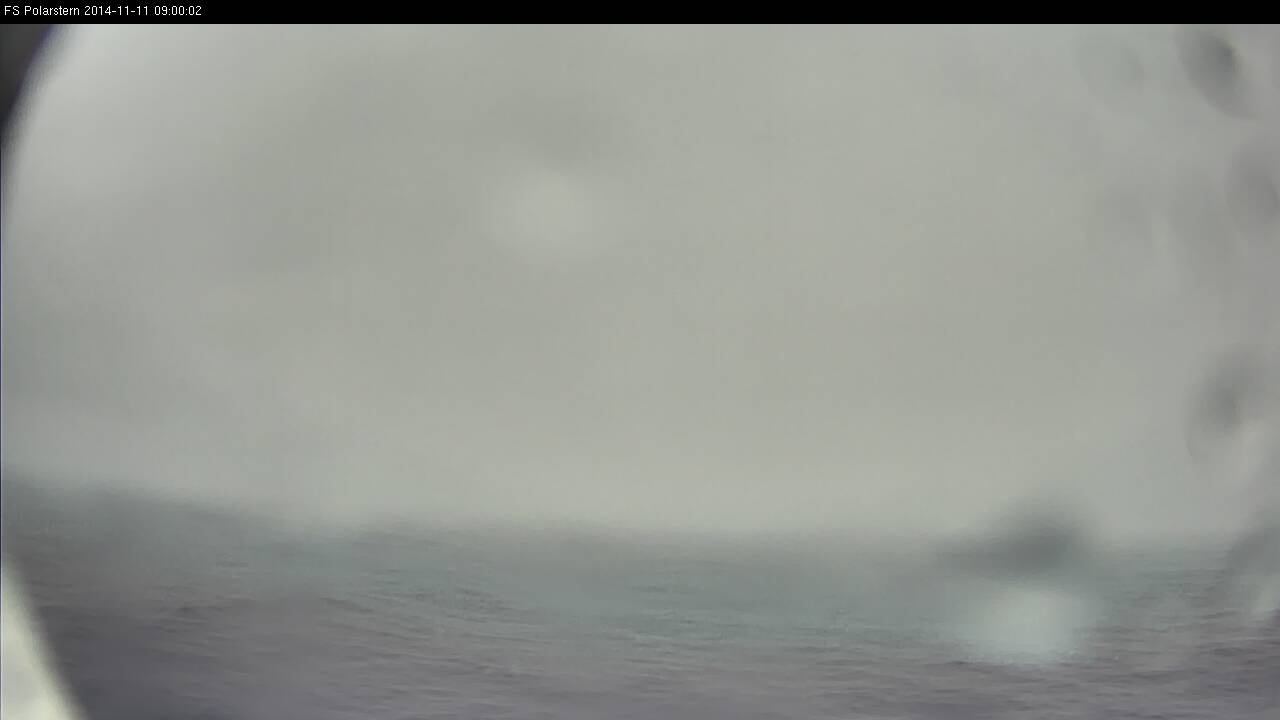
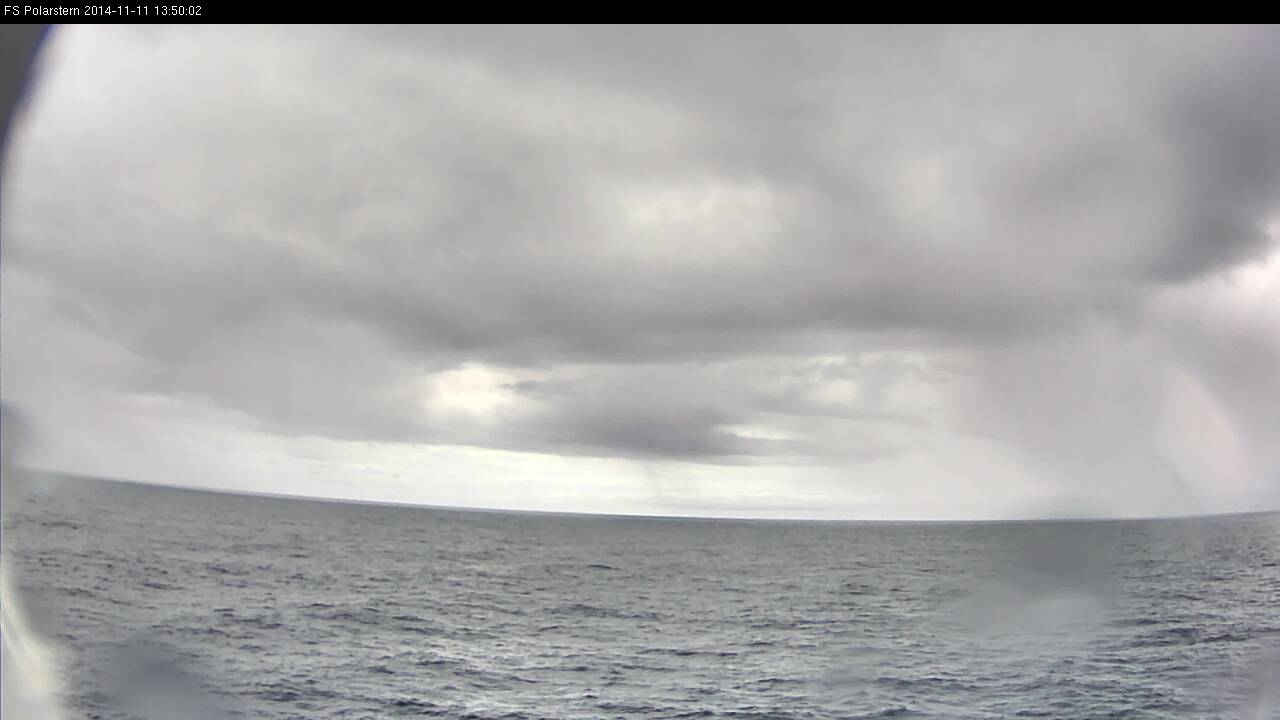
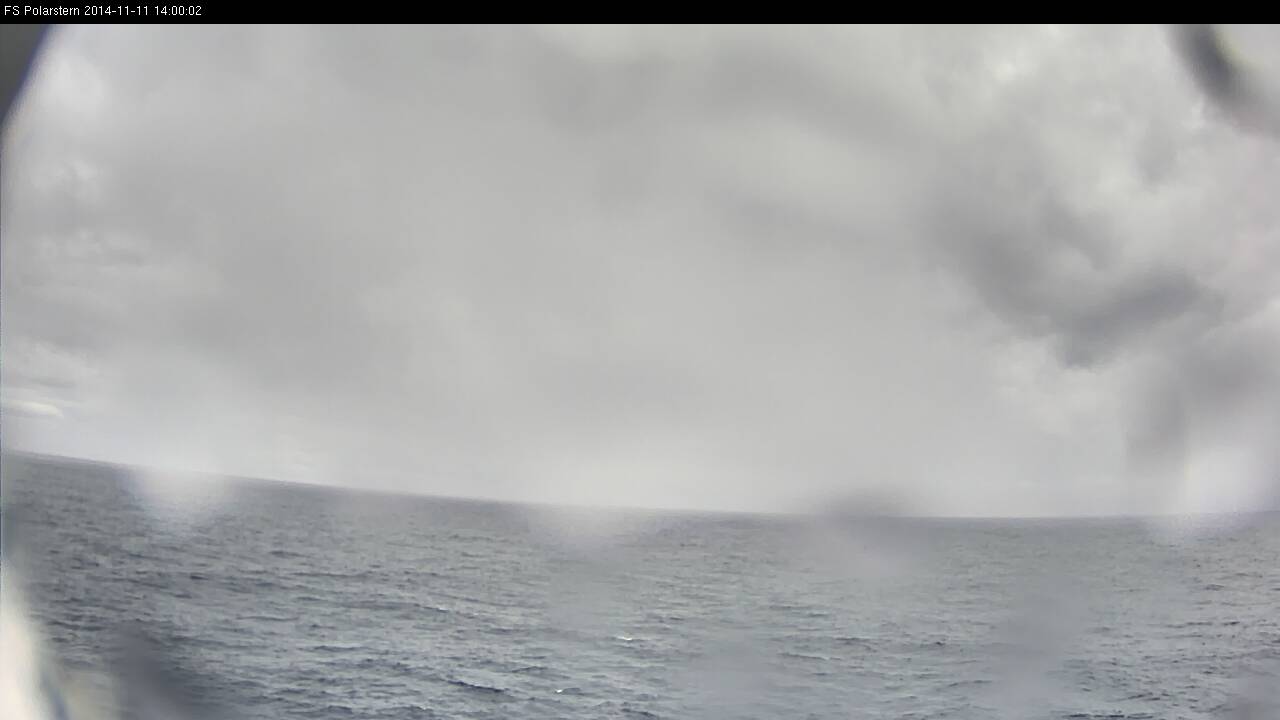
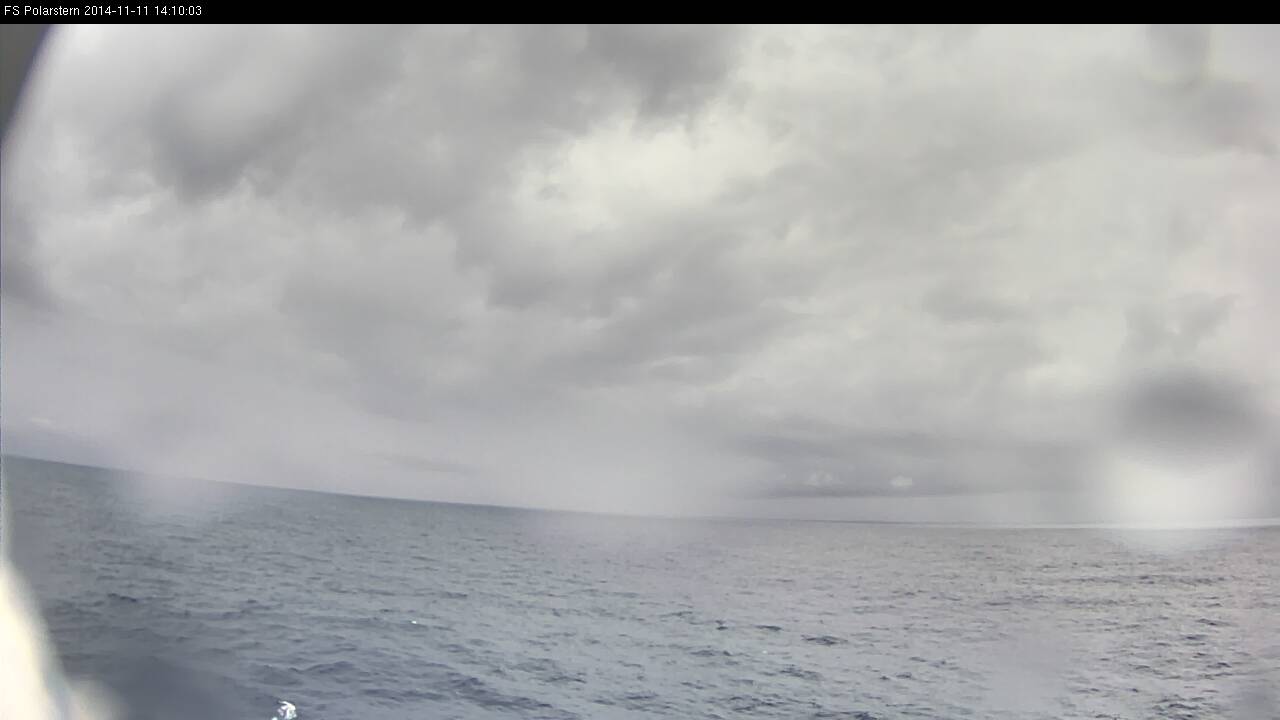
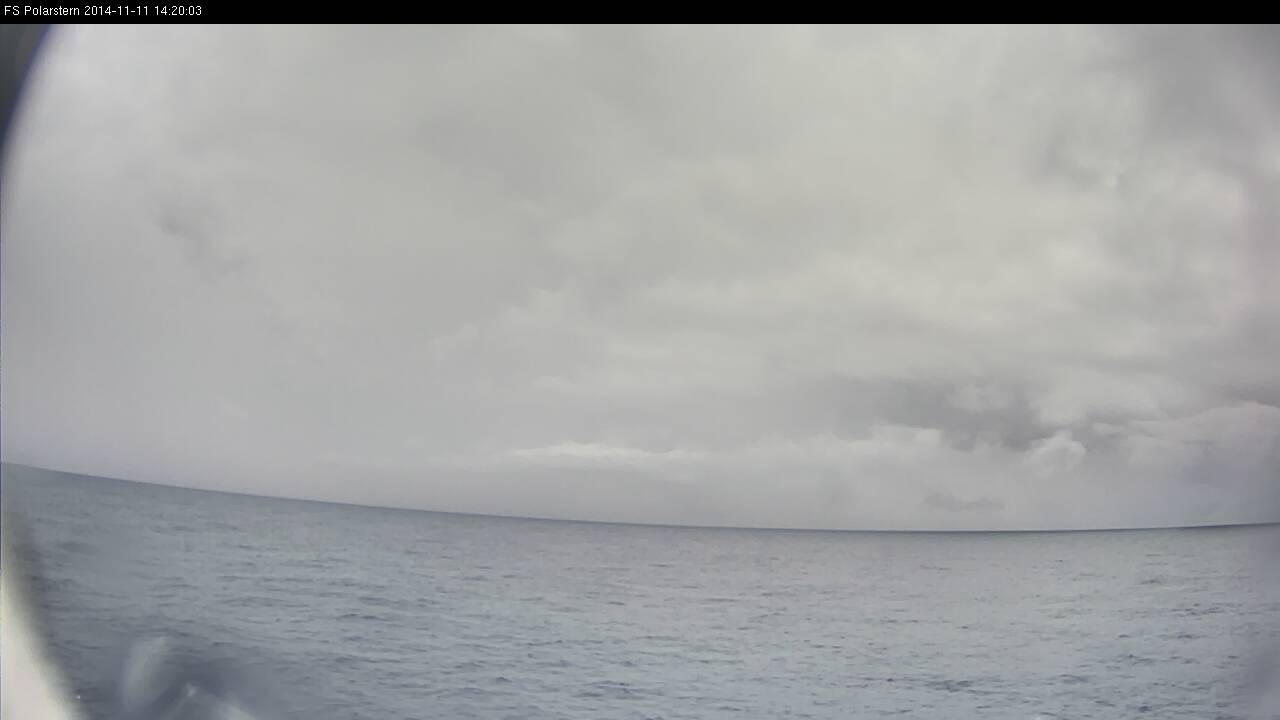
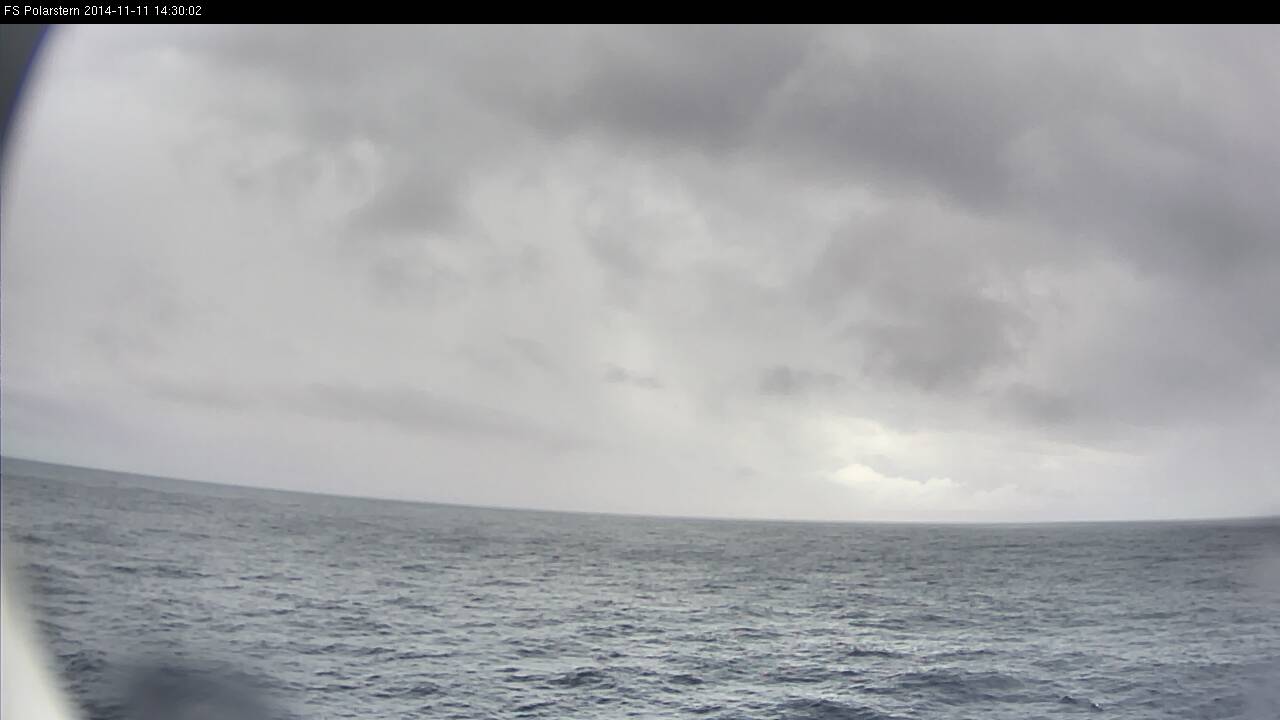
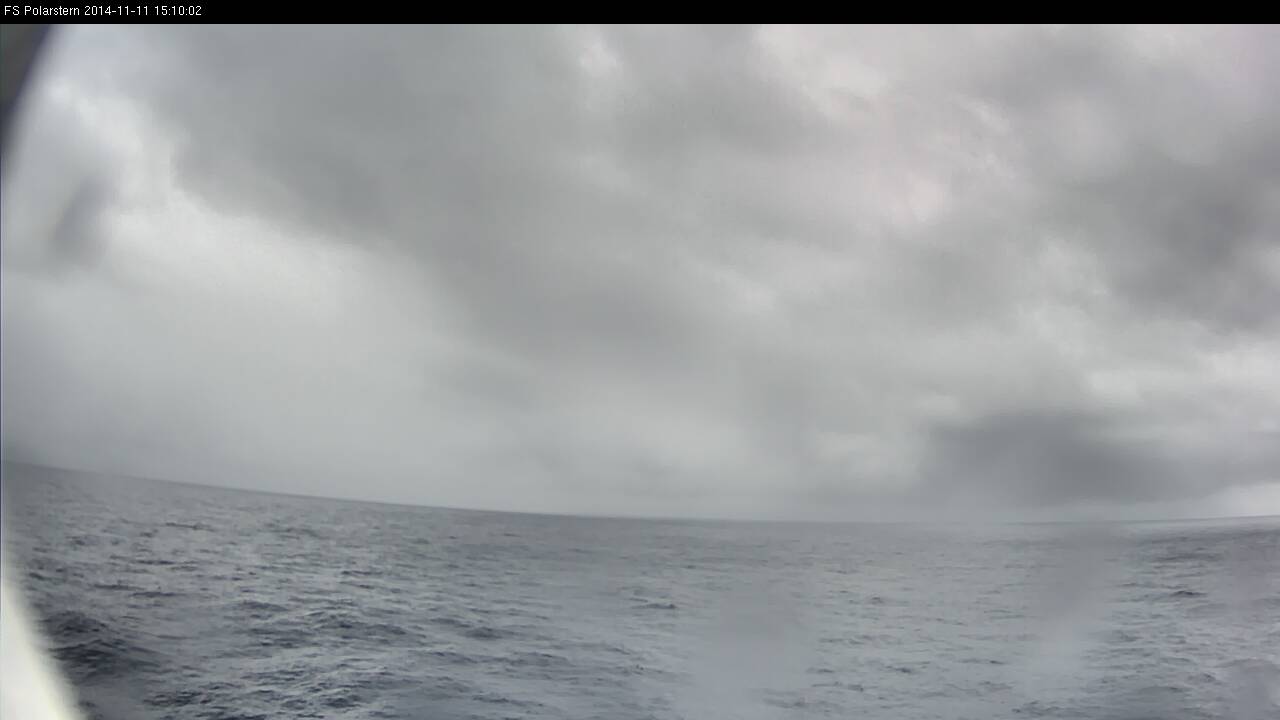
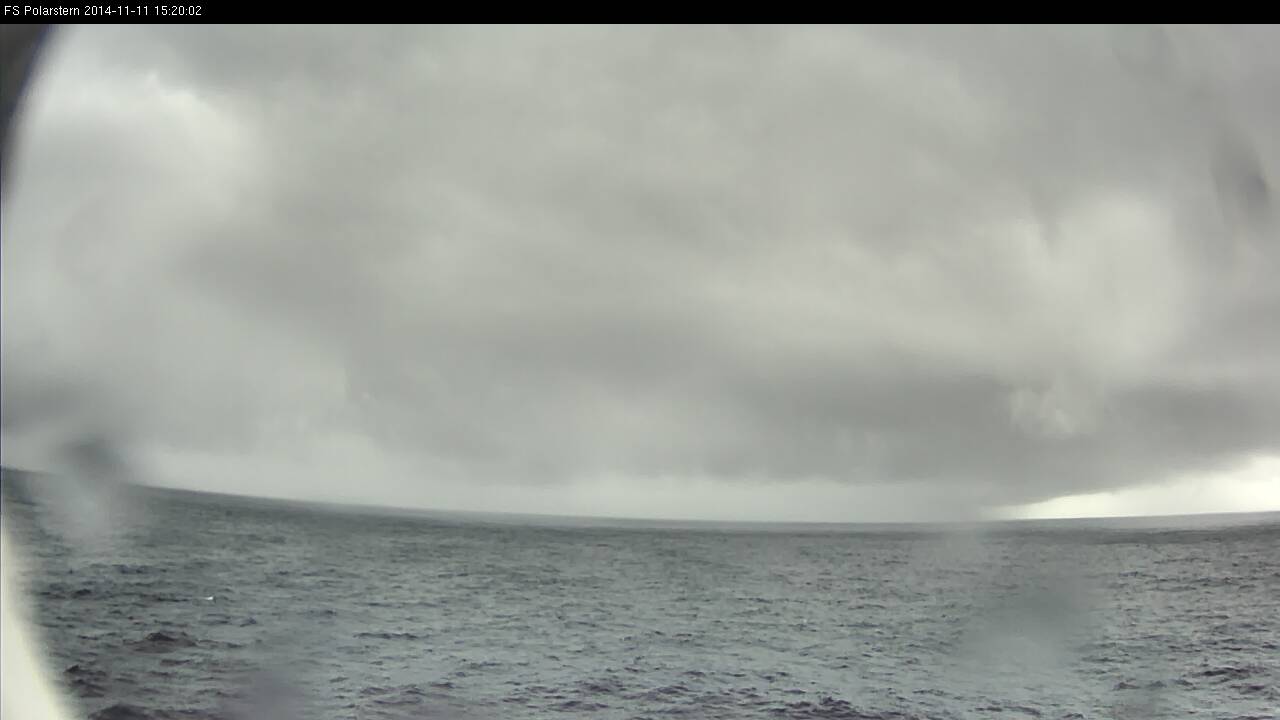
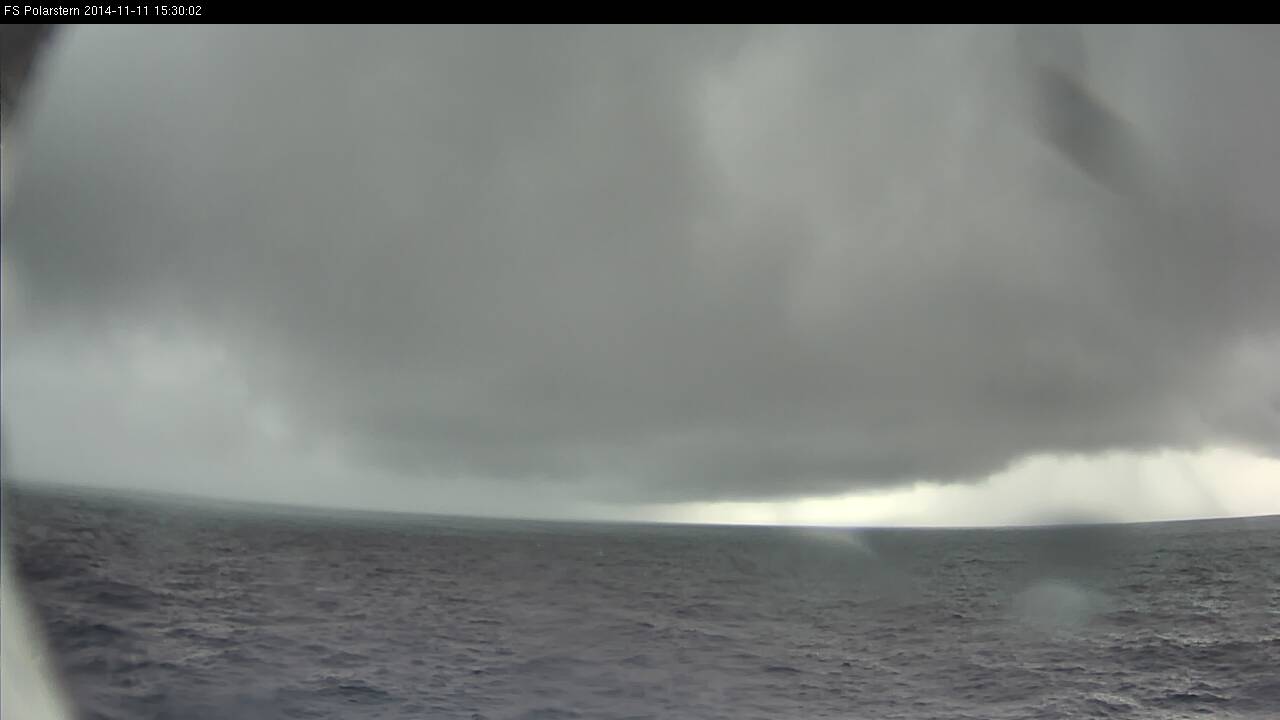
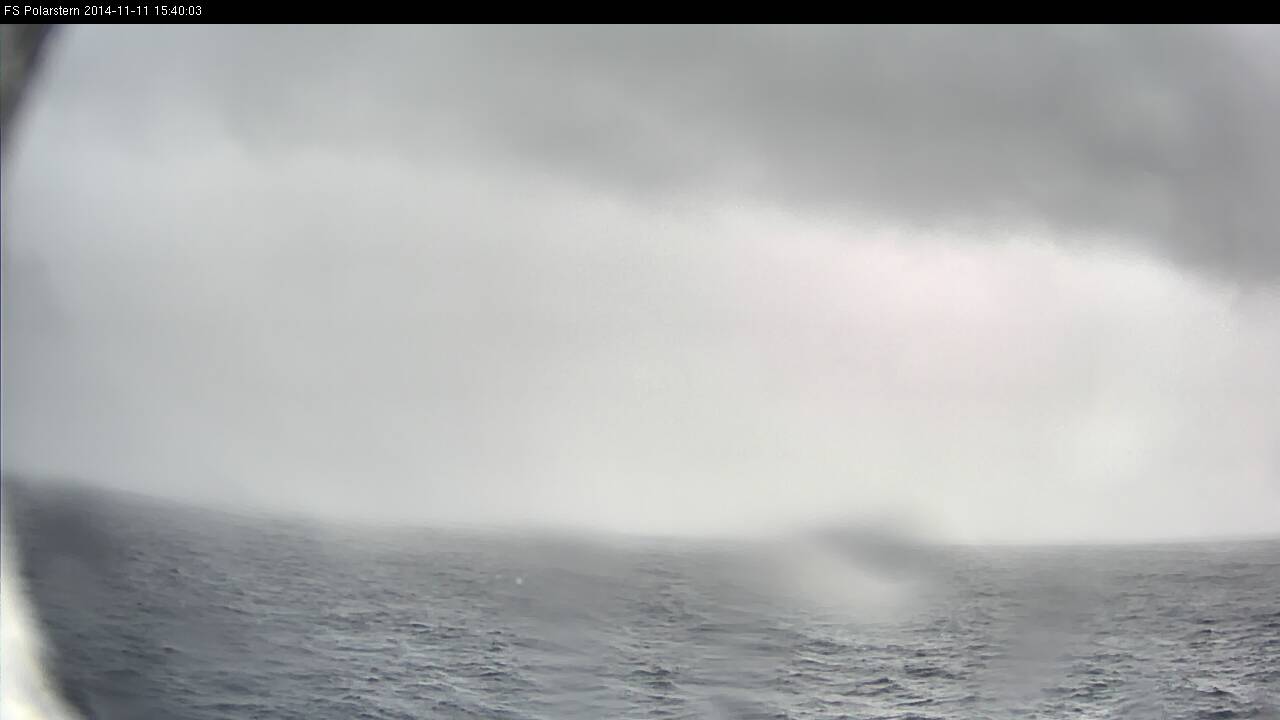
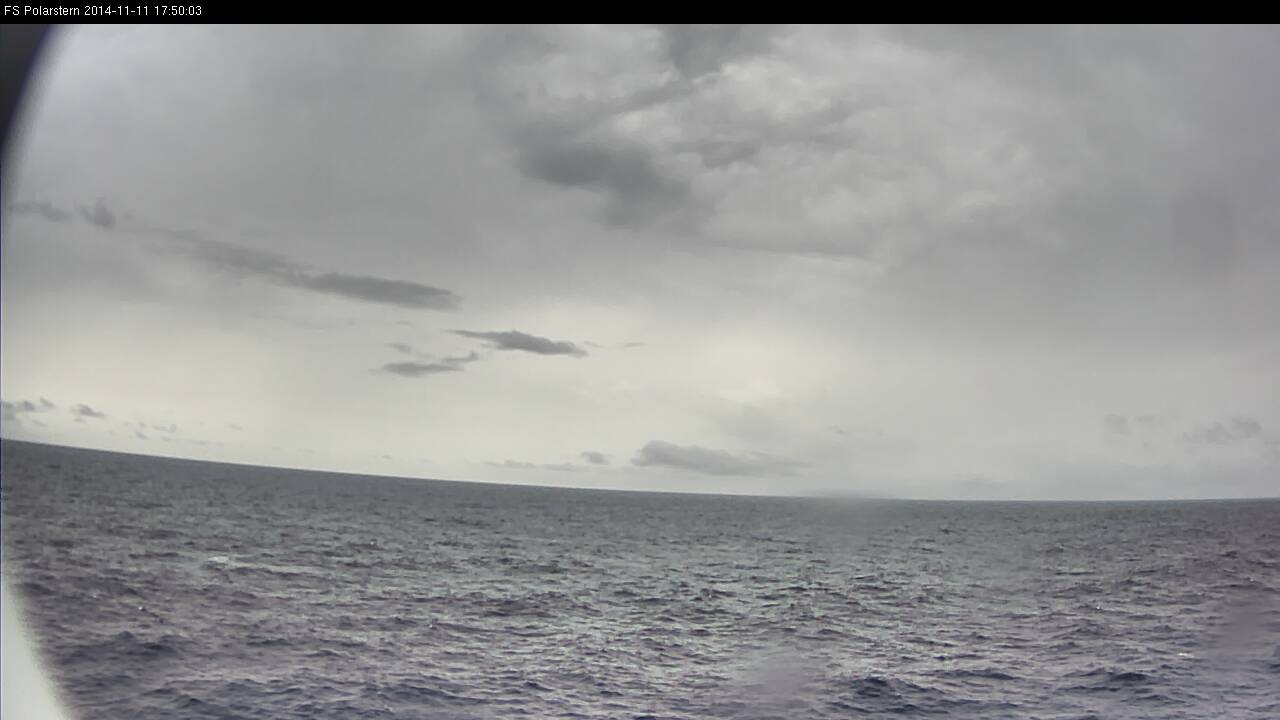
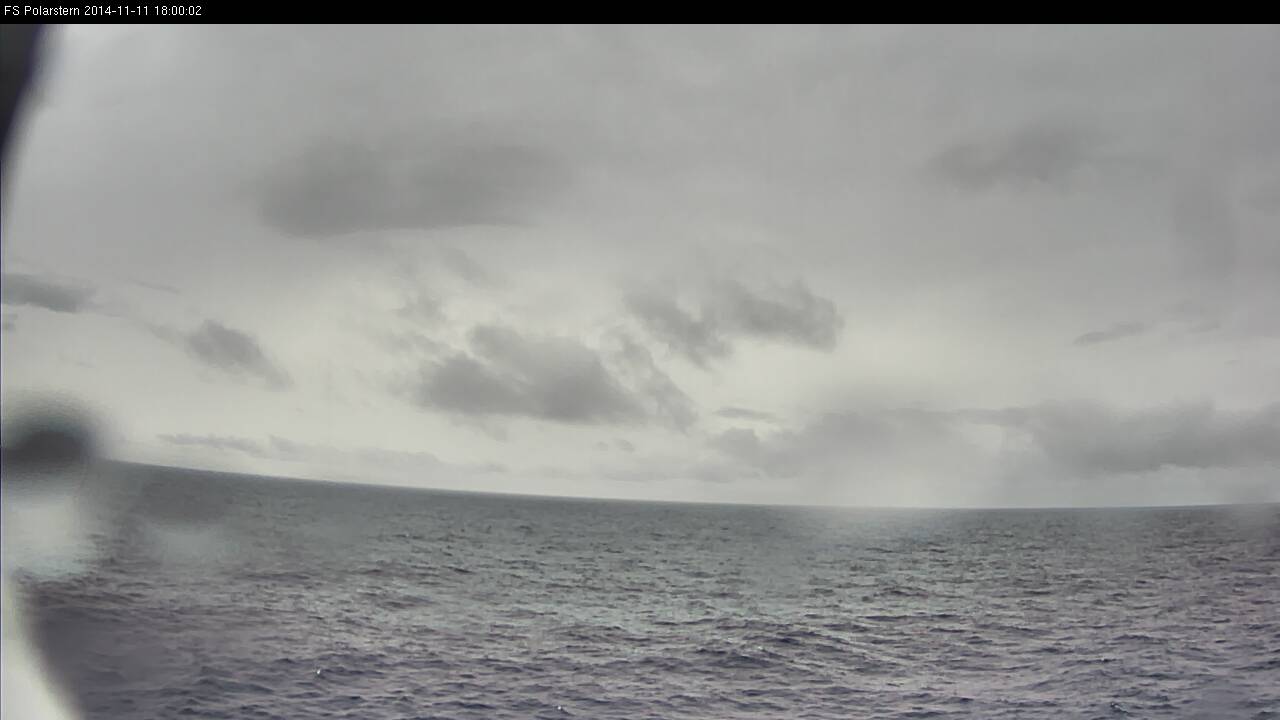
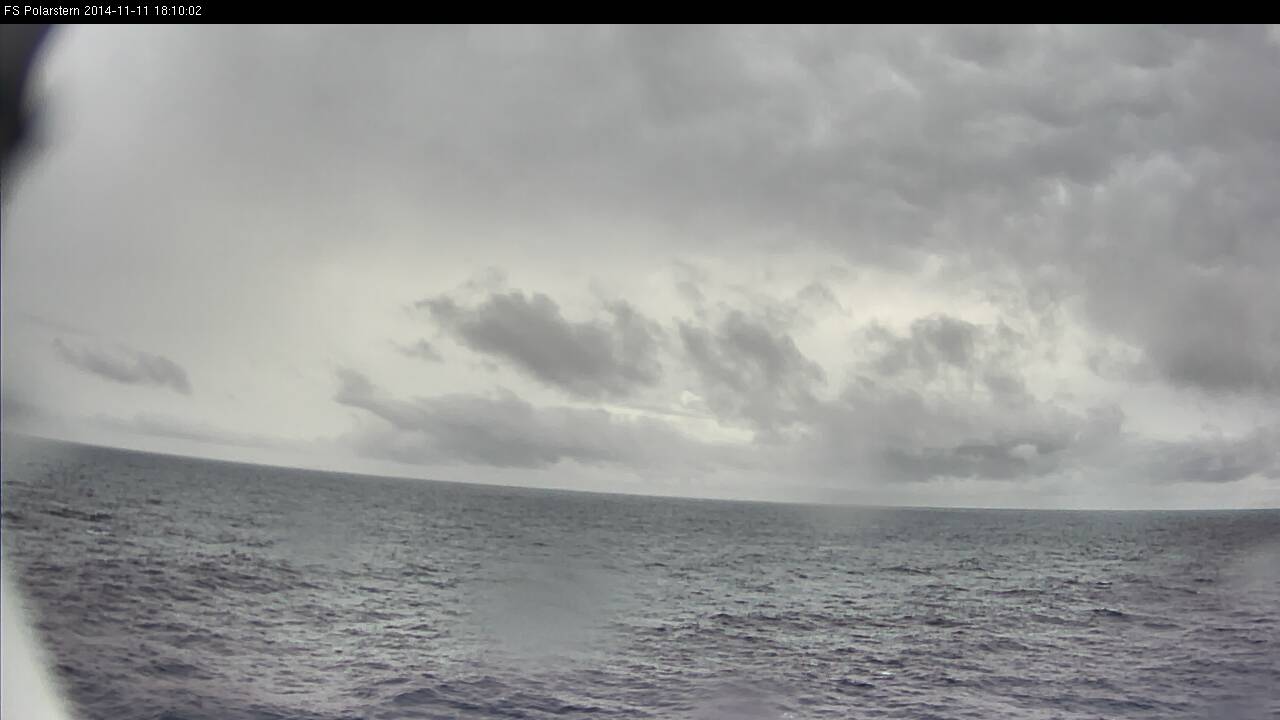
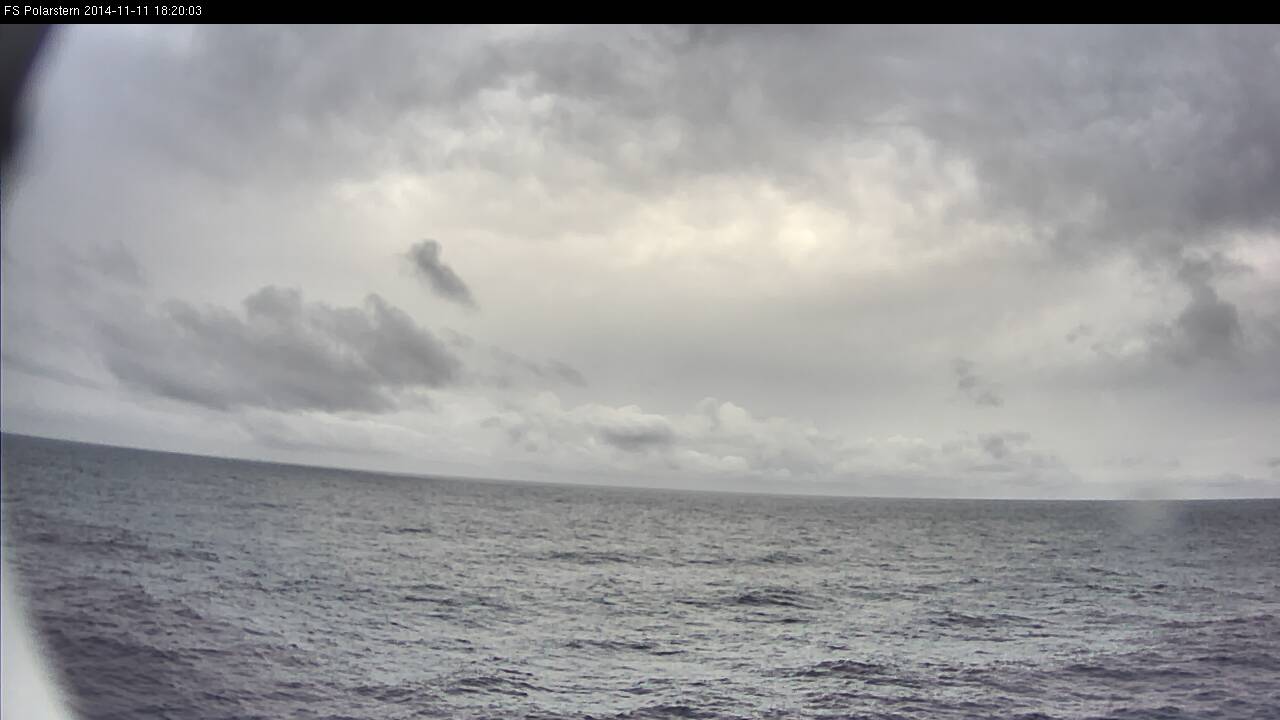
The SYNOP from 12:00 UTC reports a light rainshower. Due to the moist airmass with a dewpoint of 22,9°C and the turbulence, the condensation level is very low. Evaporation from the sea surface is very high because of how warm the water is; the water temperature measures at 28,1°C. The Polarstern had reached the southern side of the ITCZ's convergence and the wind had veered to a southeasterly direction of 120° and 06 knots. The reported cloud layer is 8/8 (overcast) with cumulonimbus capillatus.
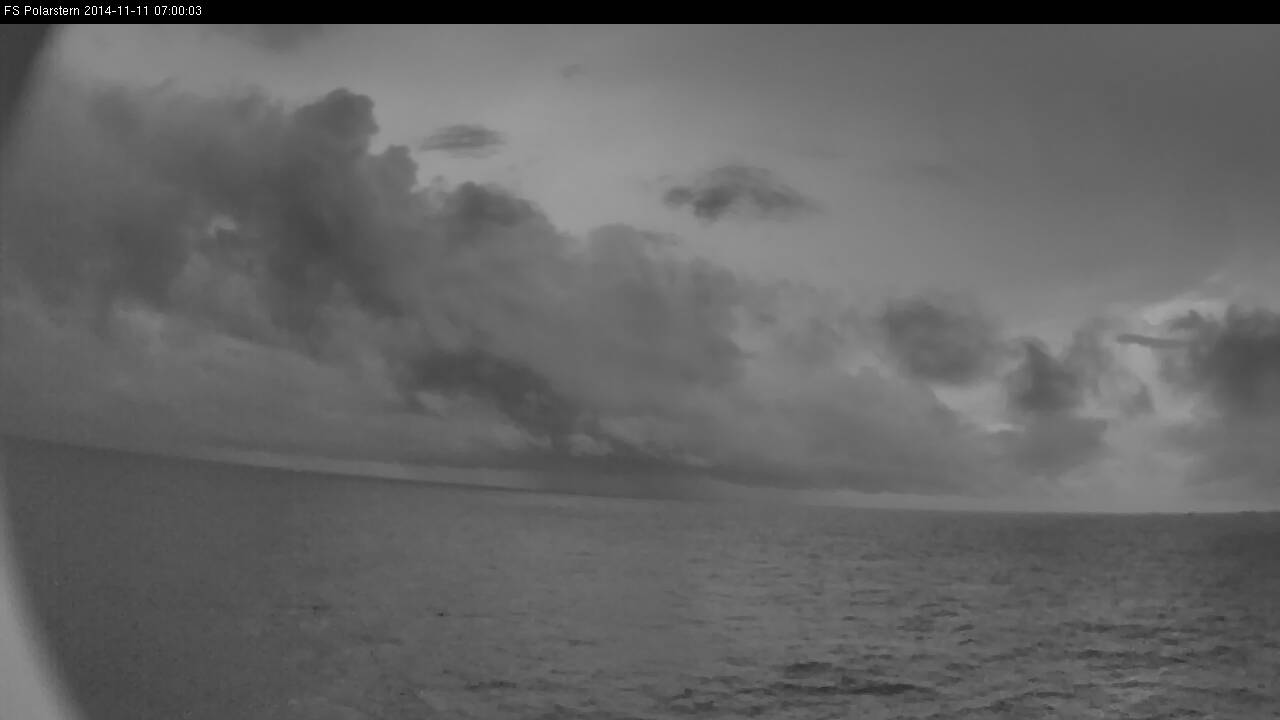
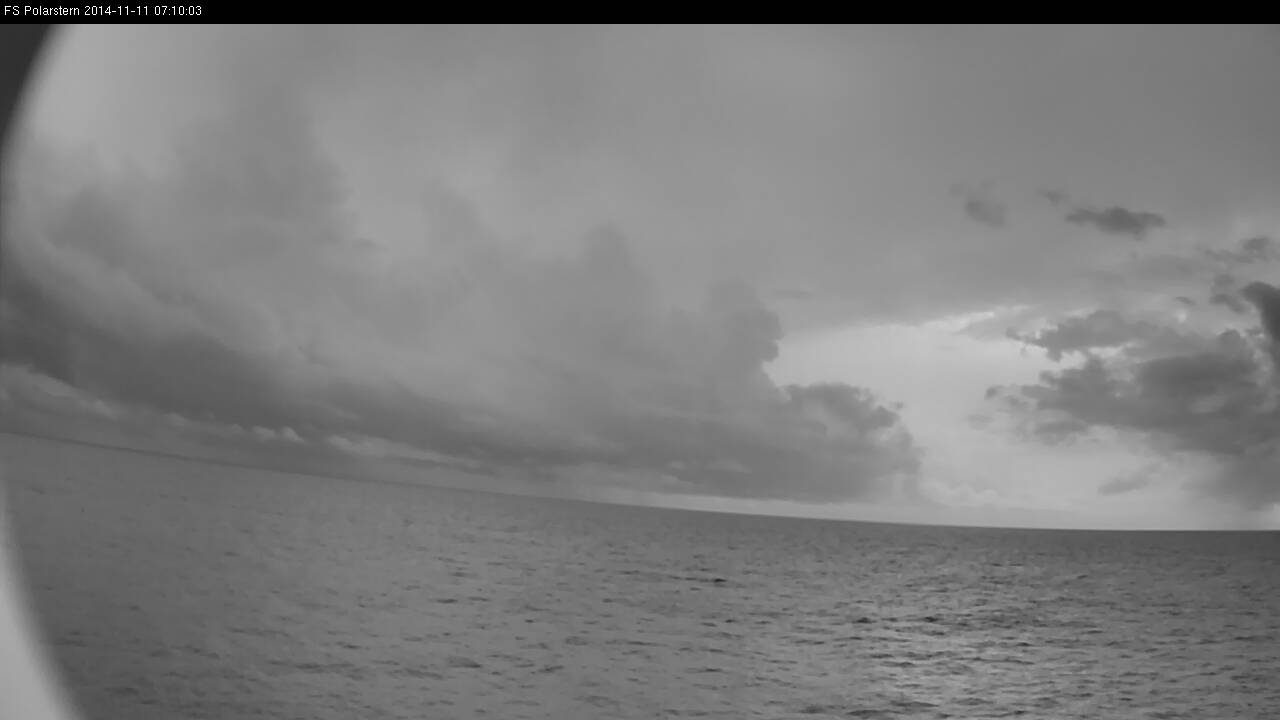
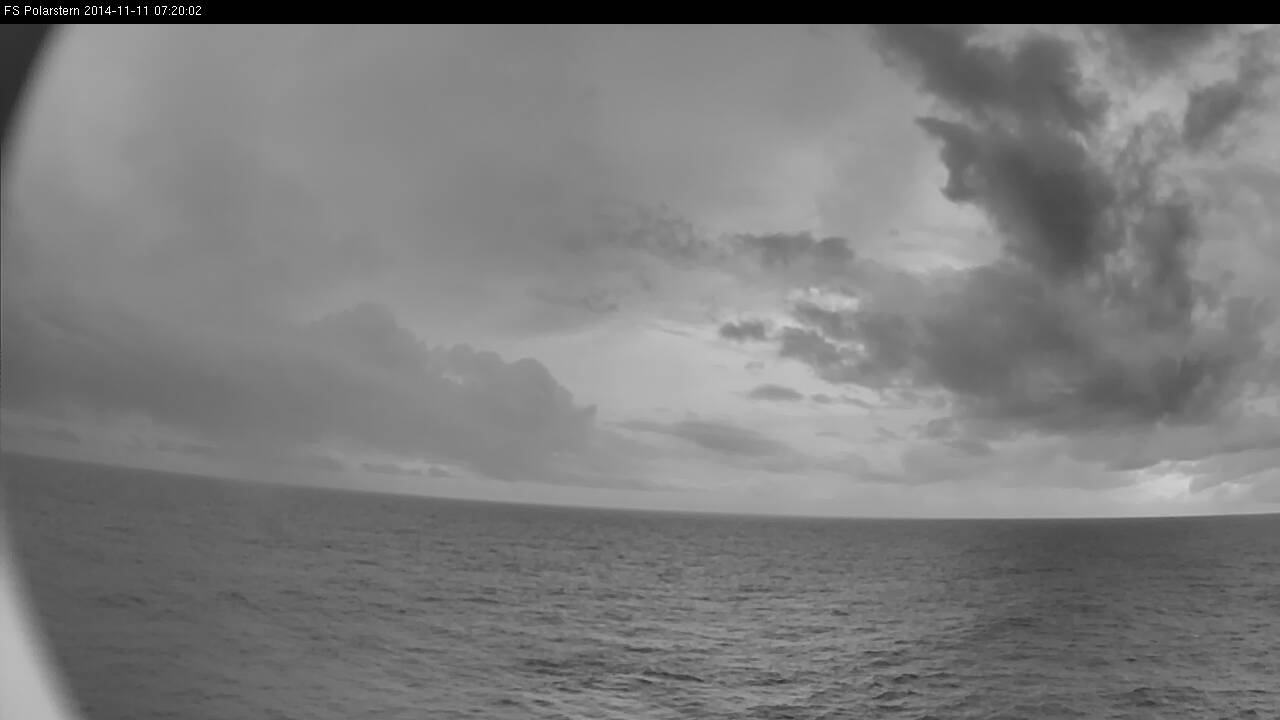
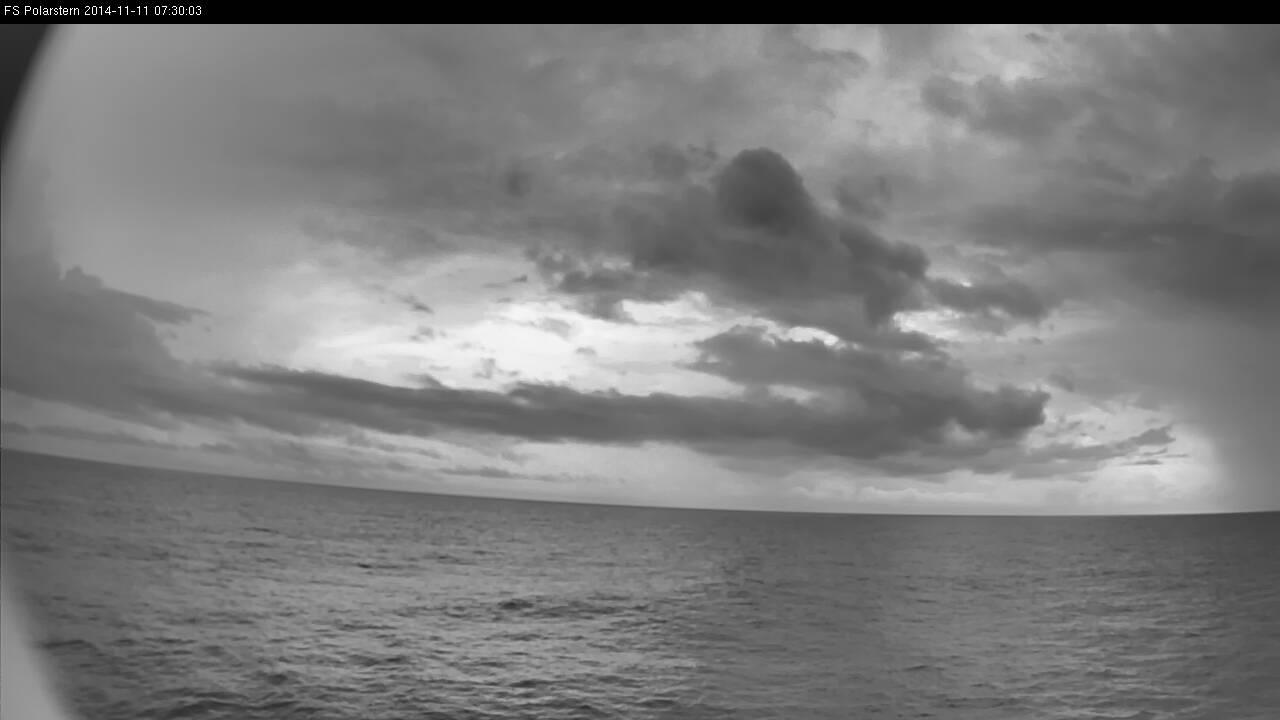
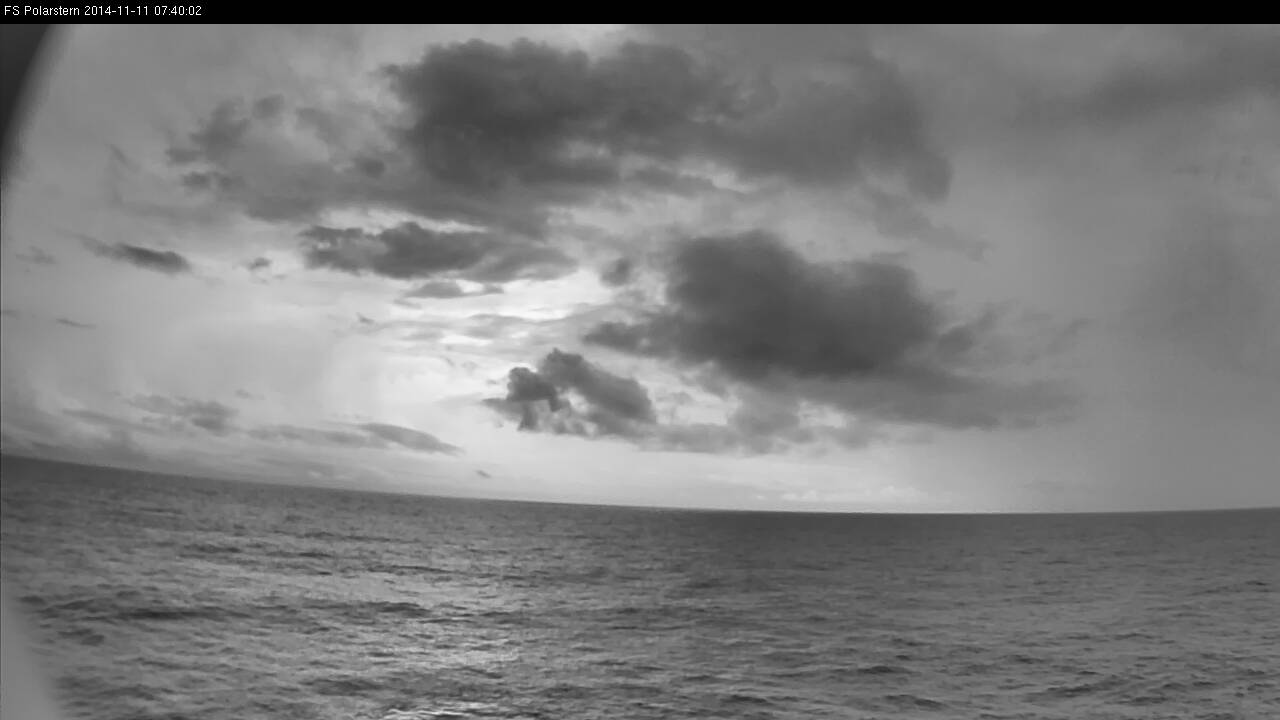
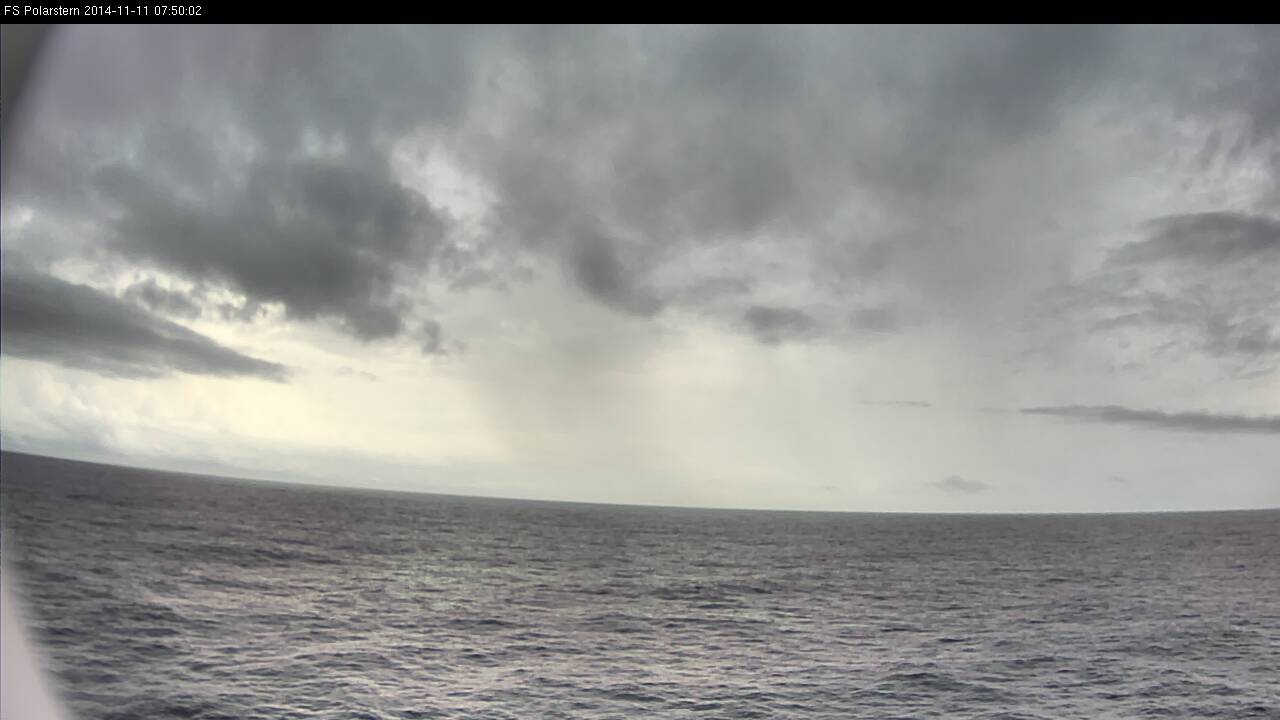
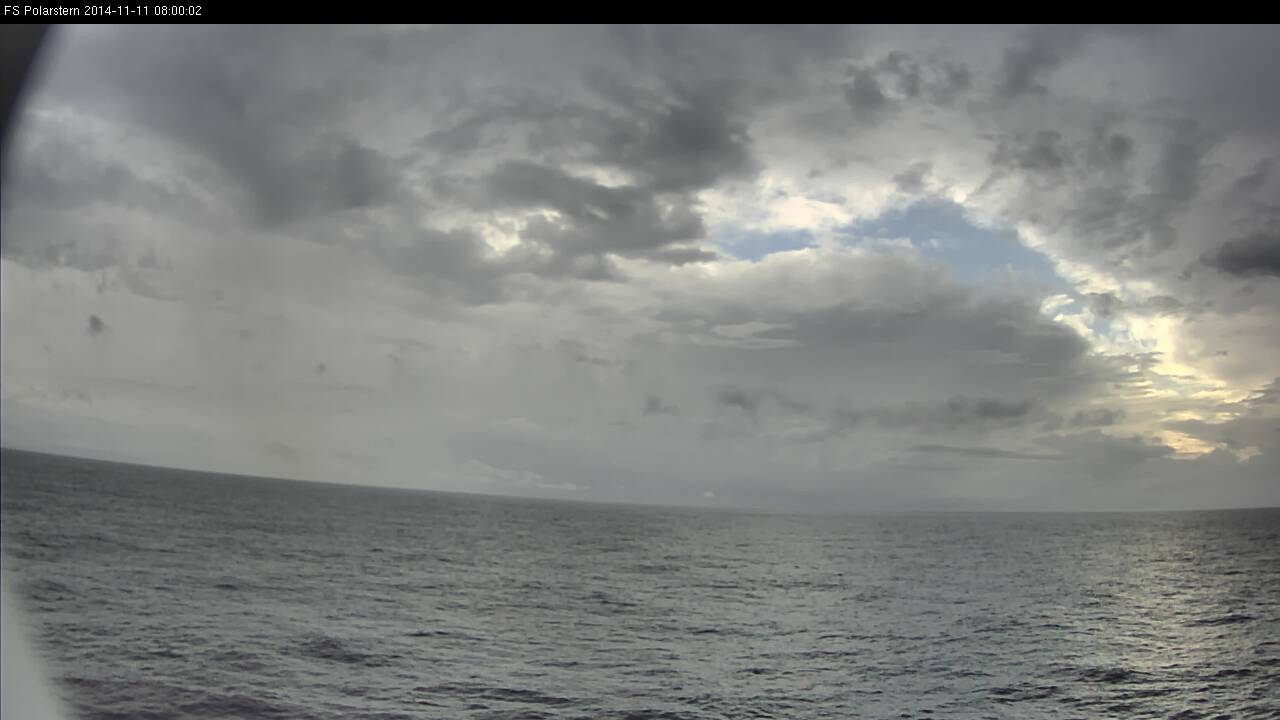
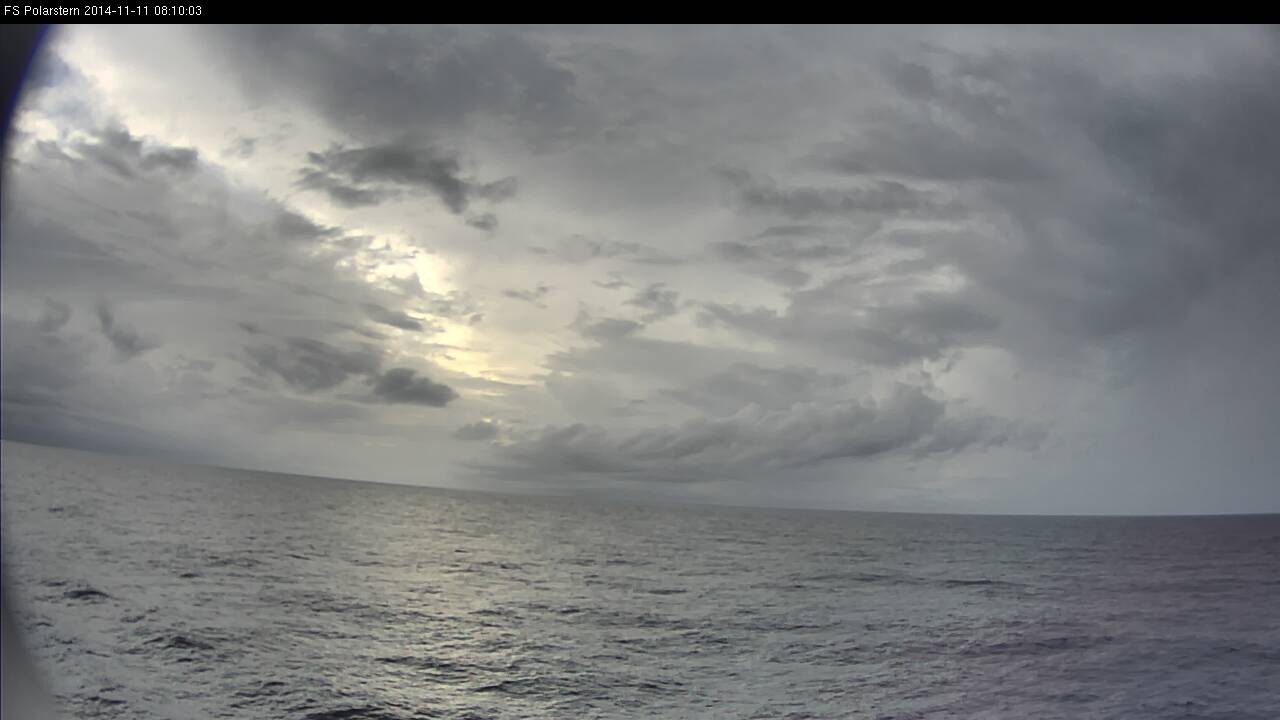
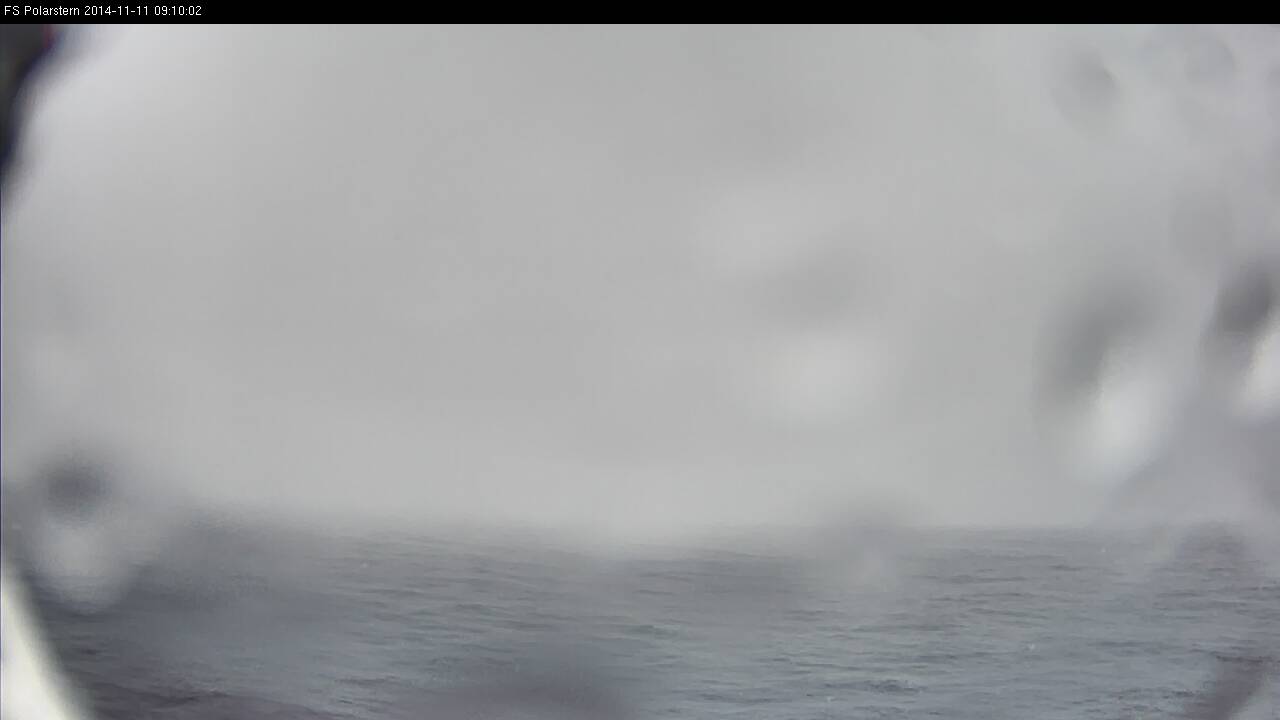
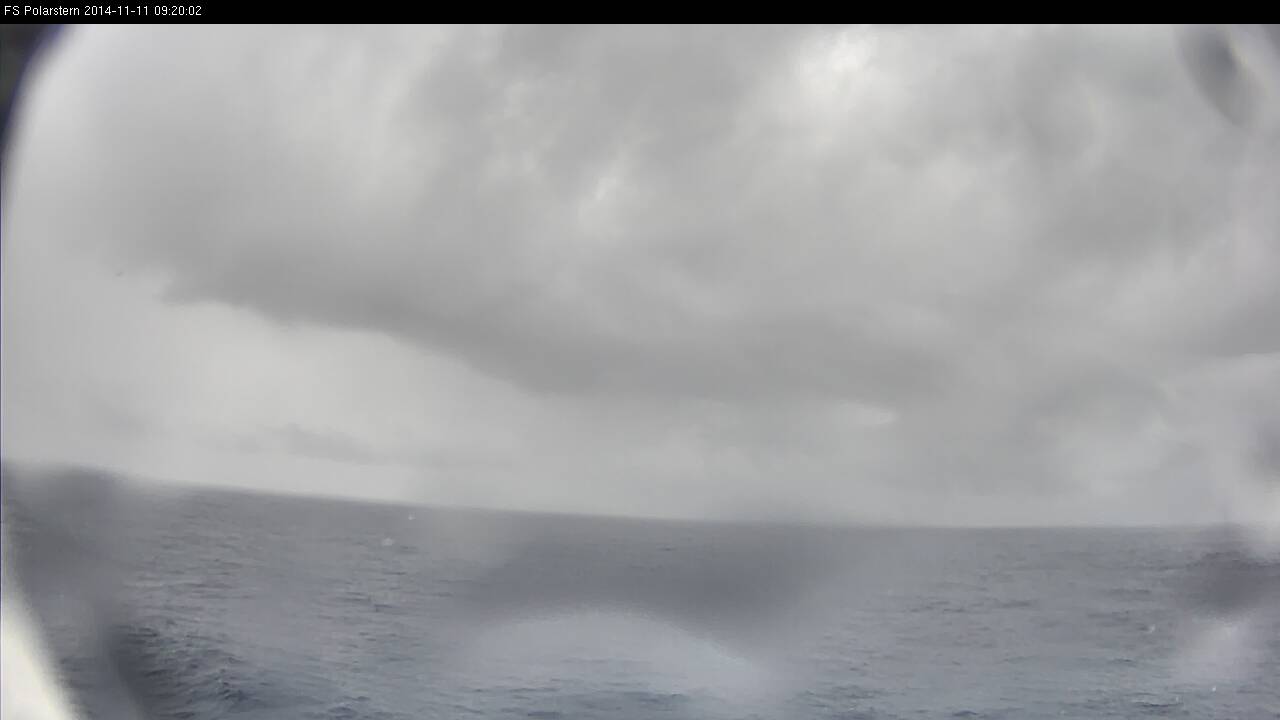
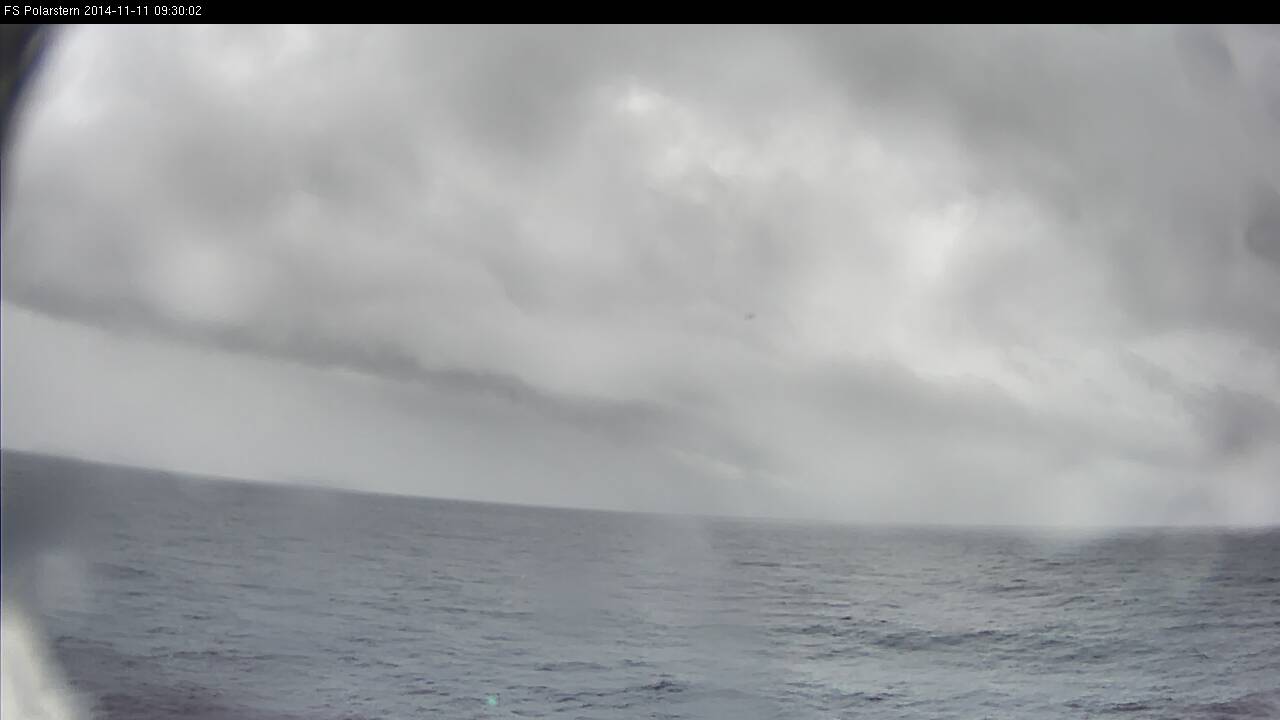
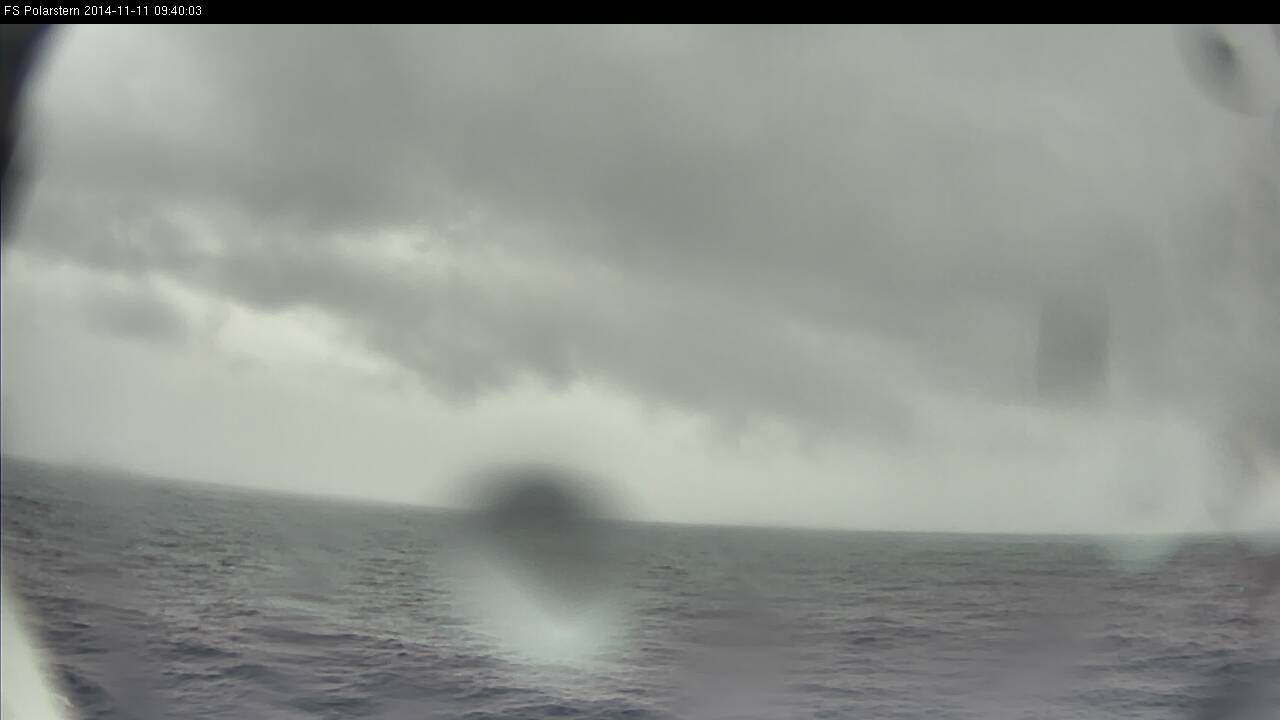
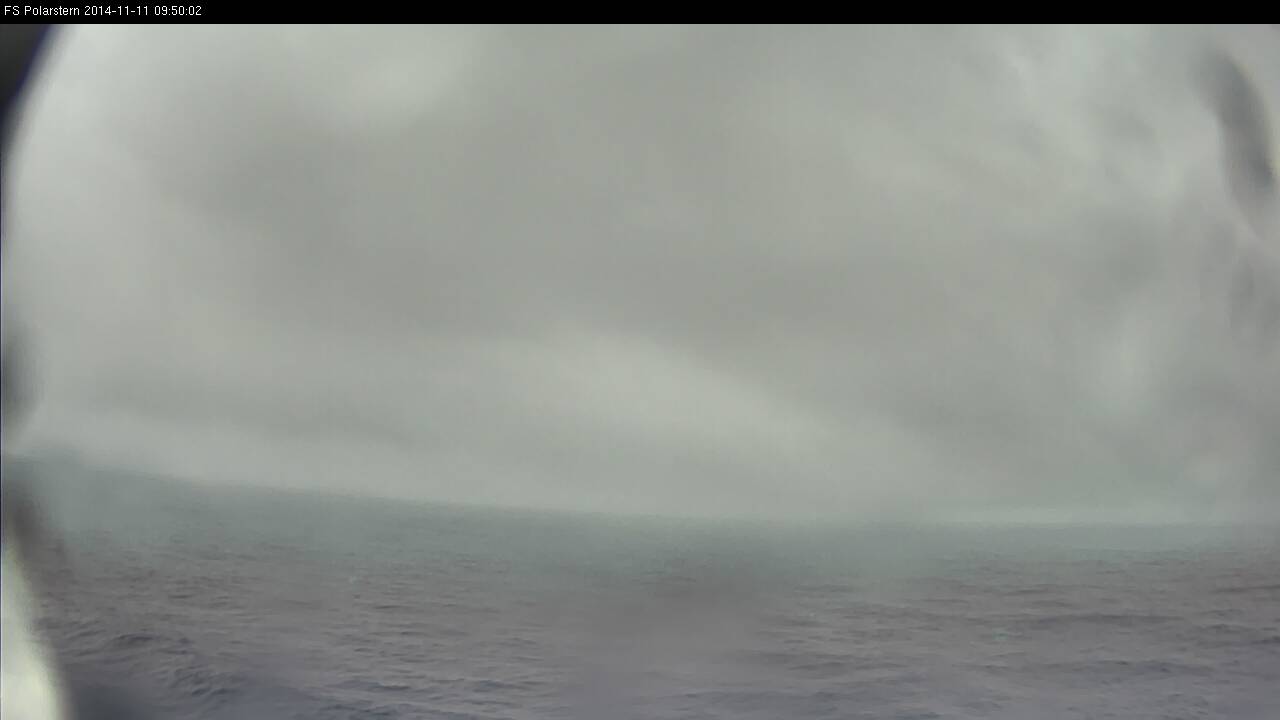
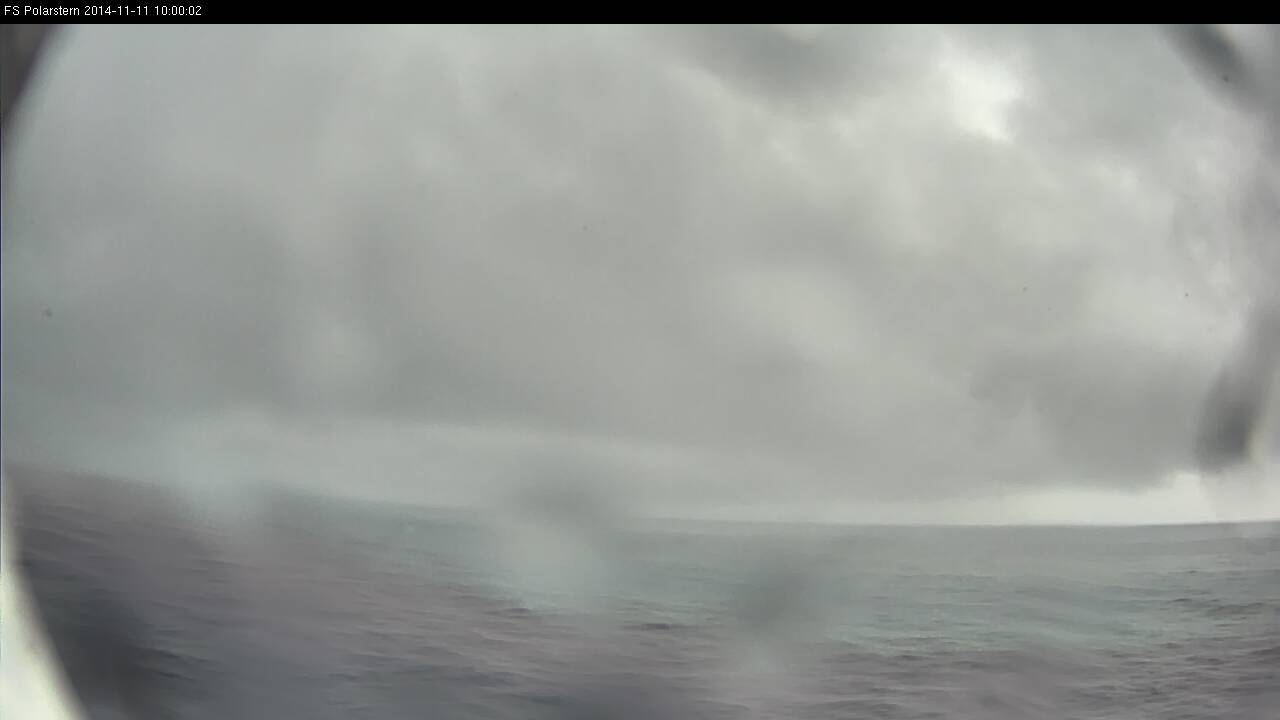
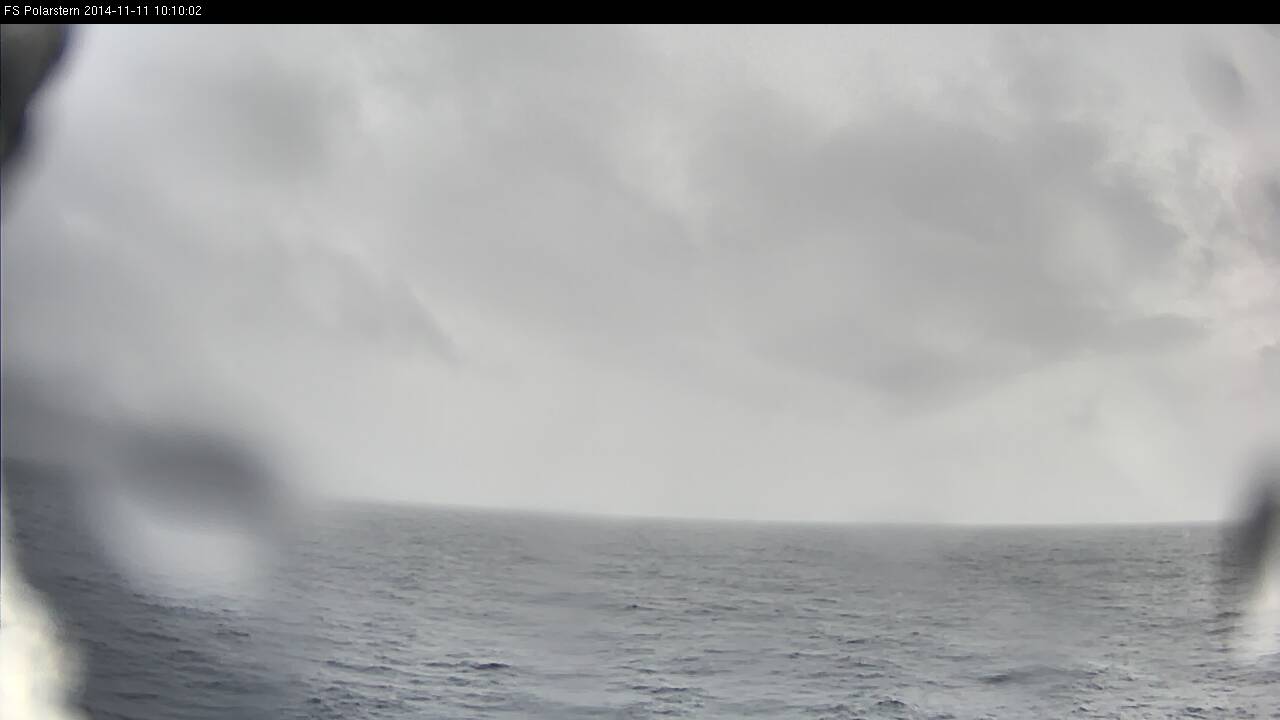
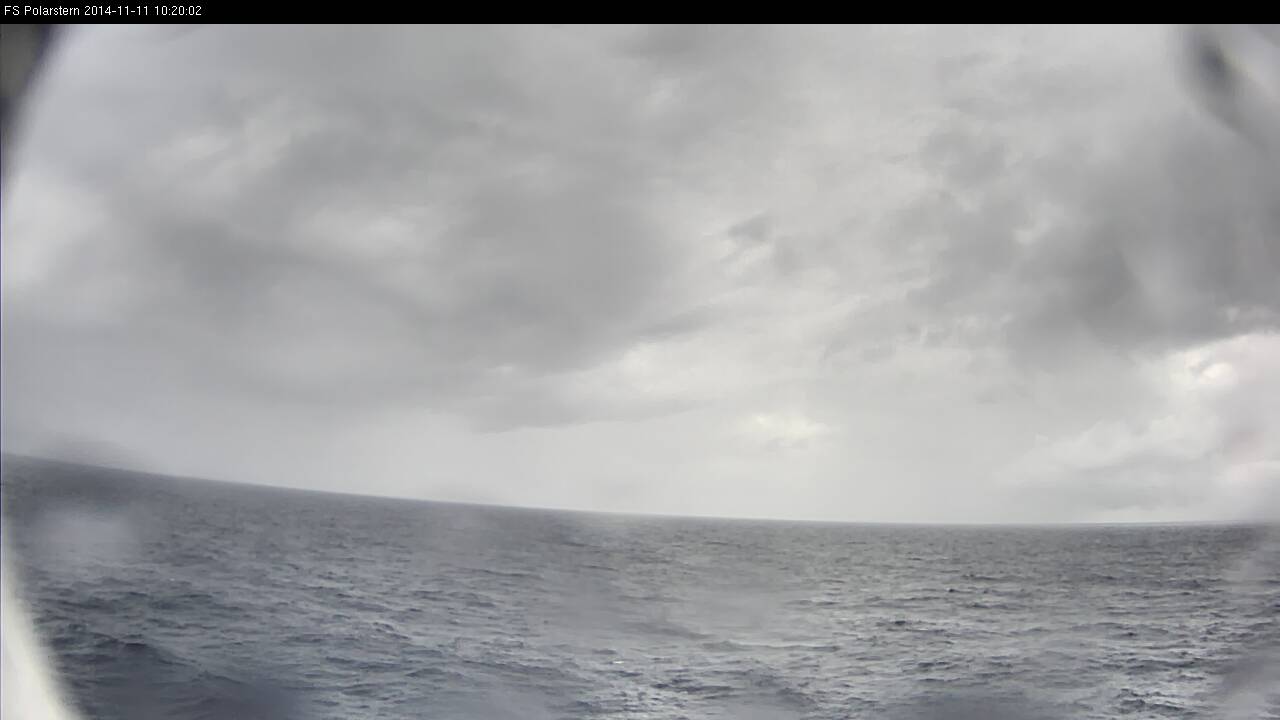
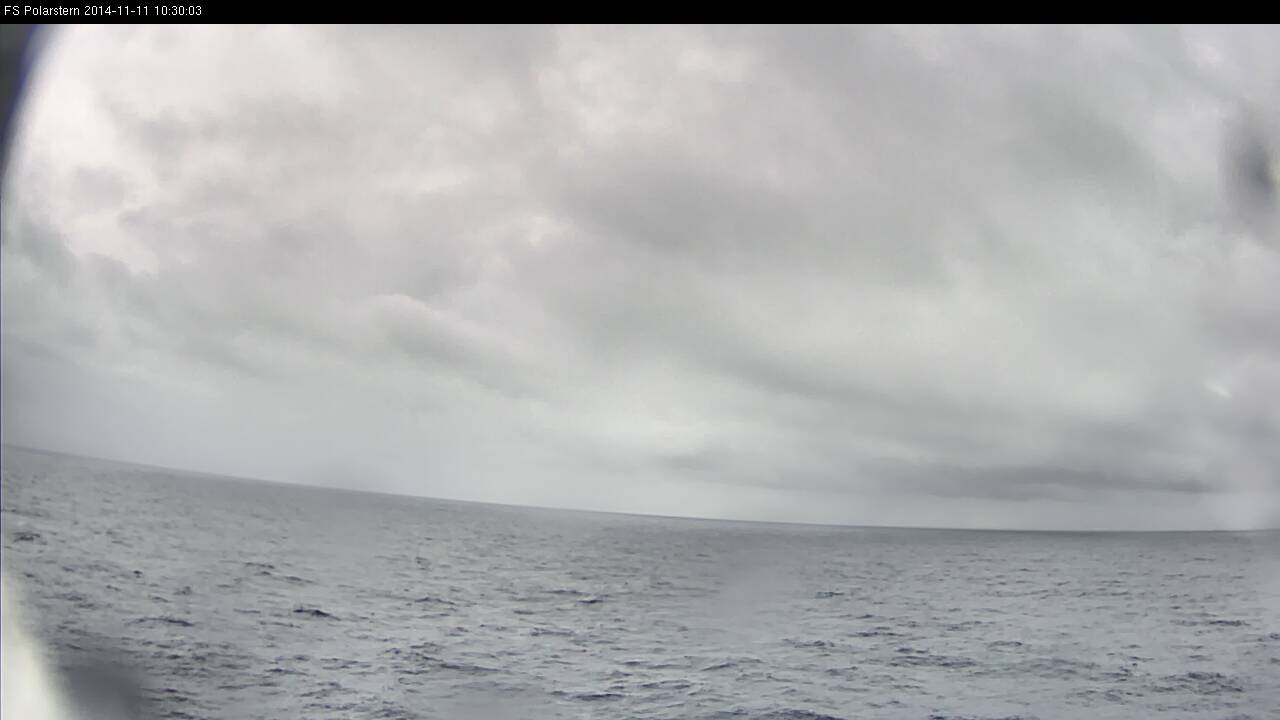
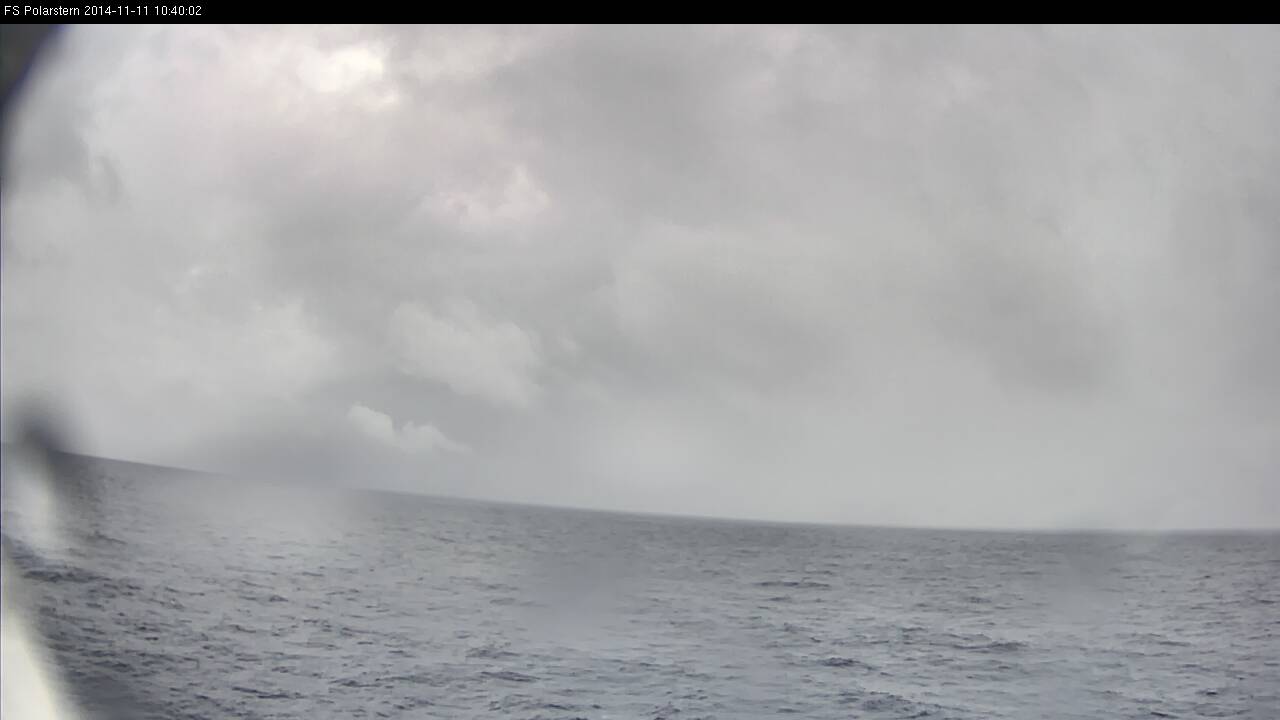
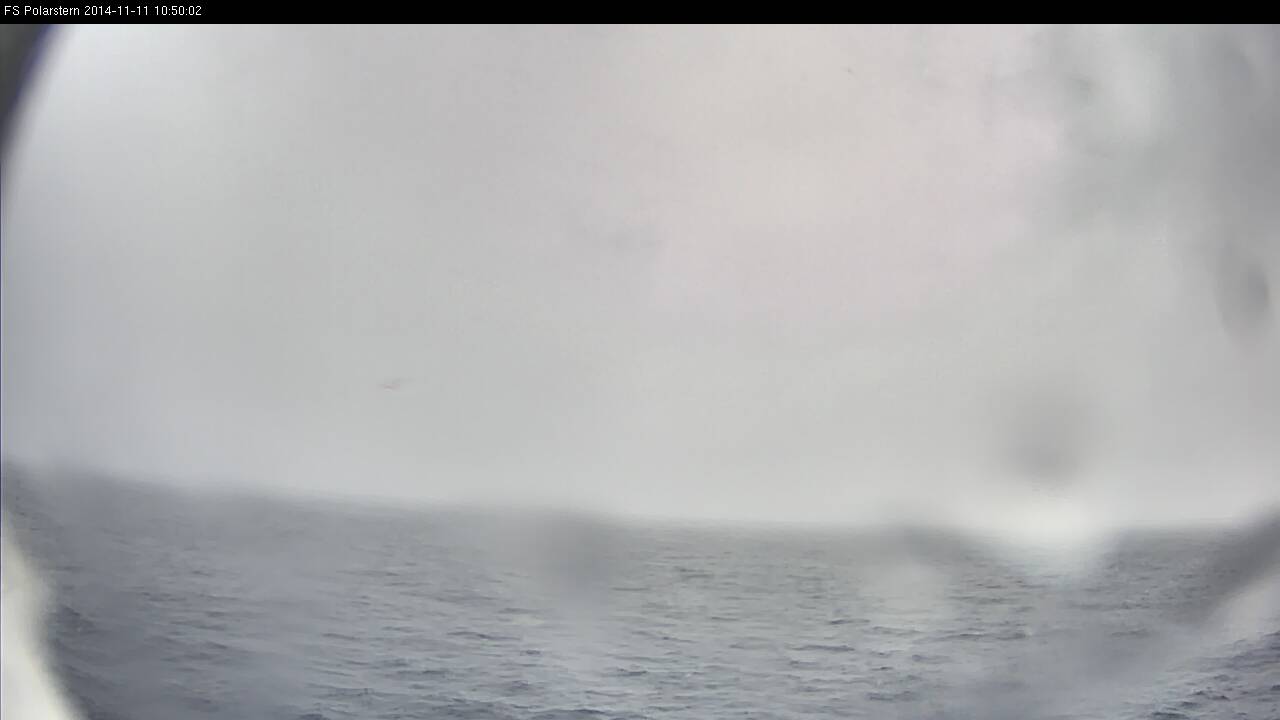
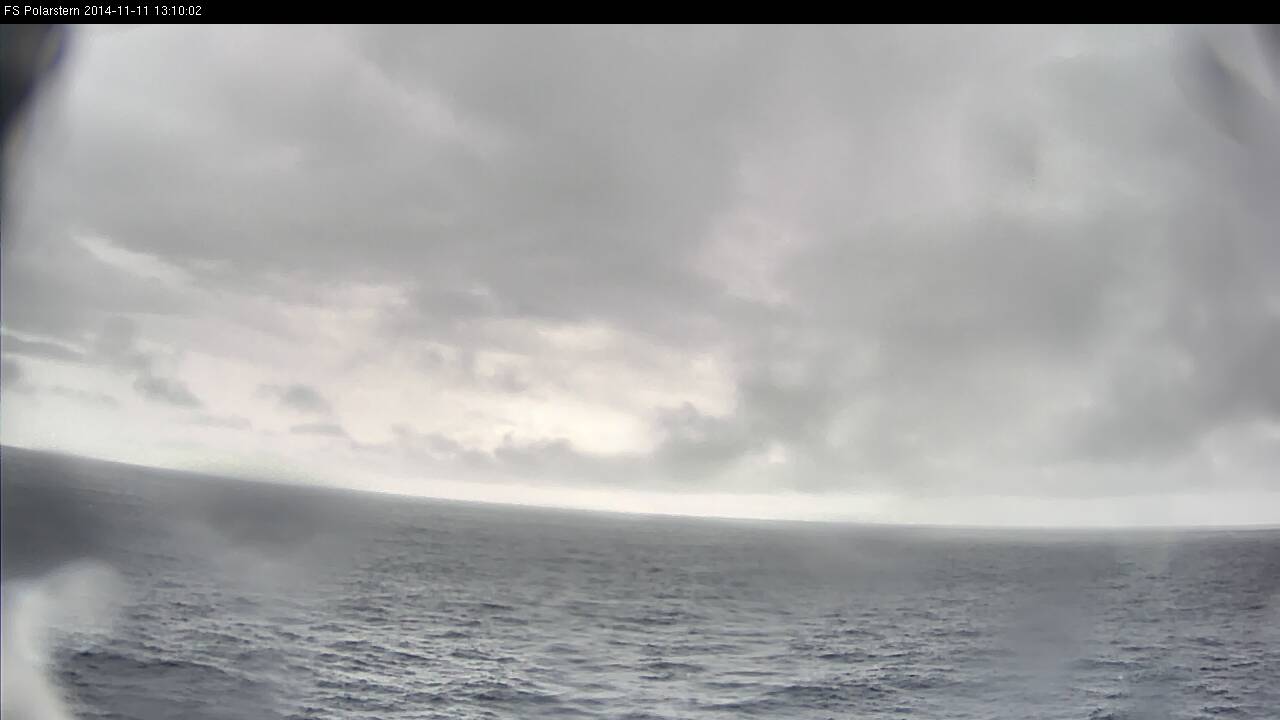
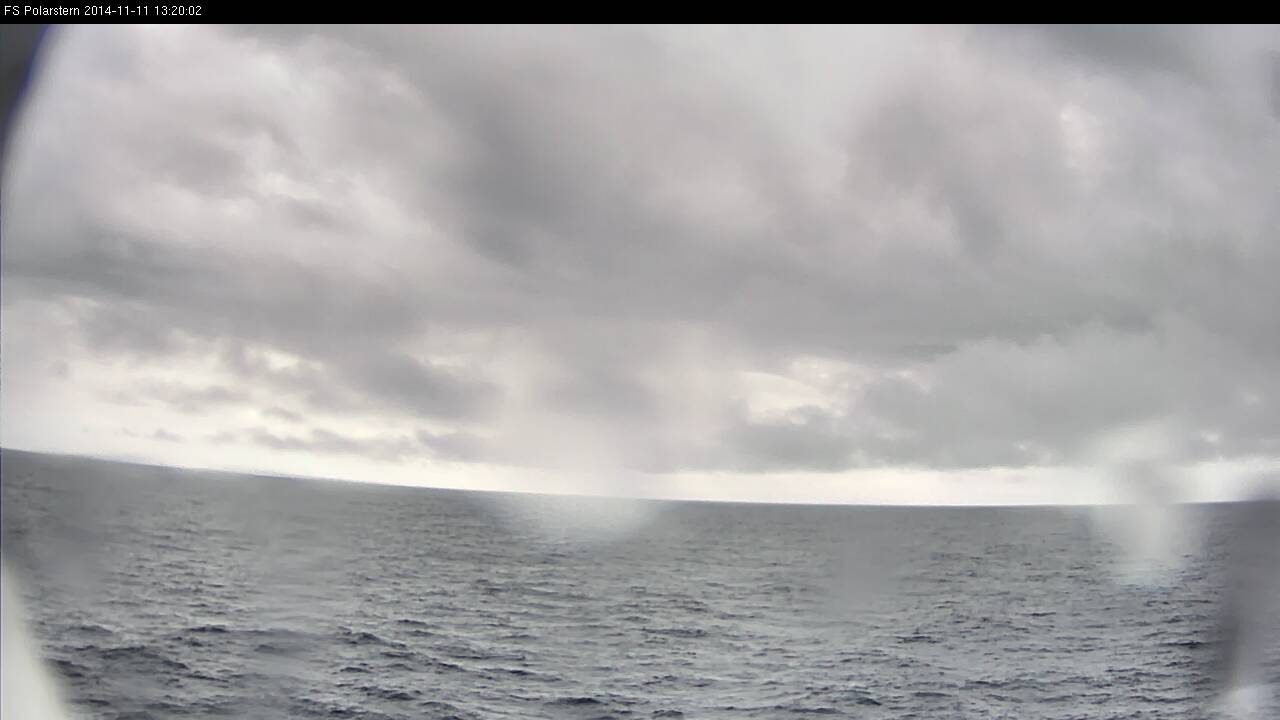
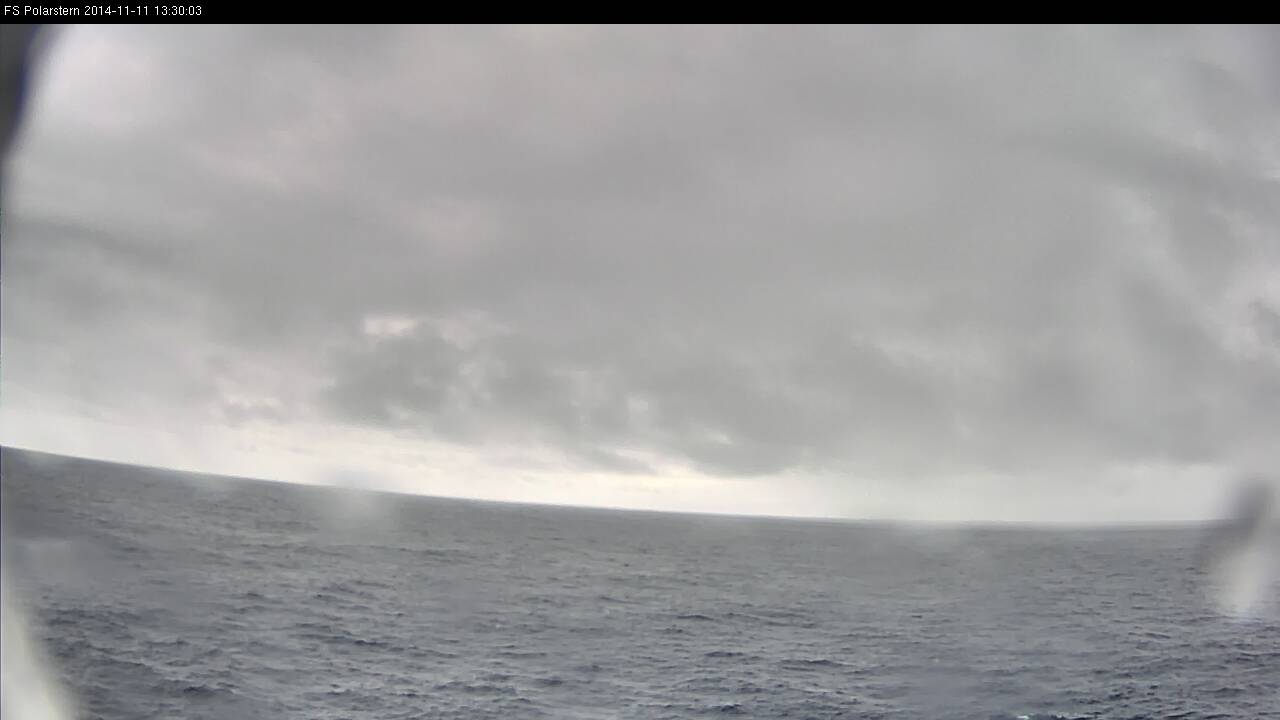
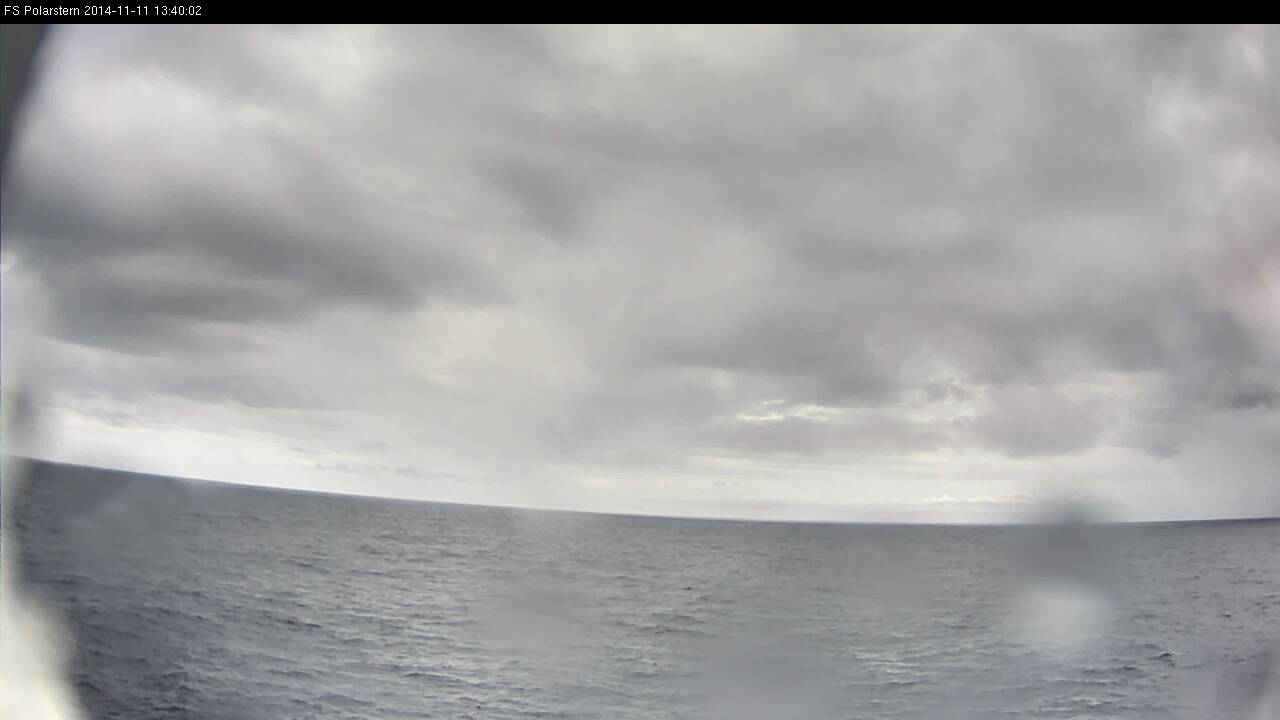
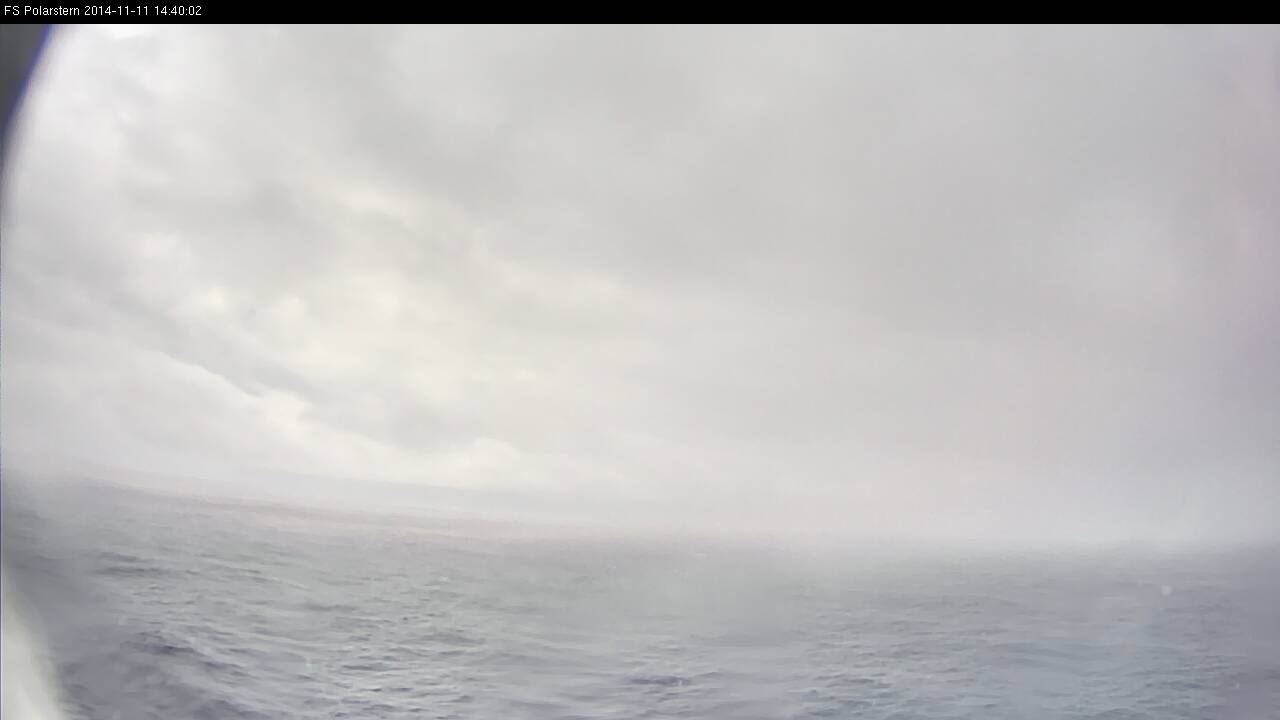
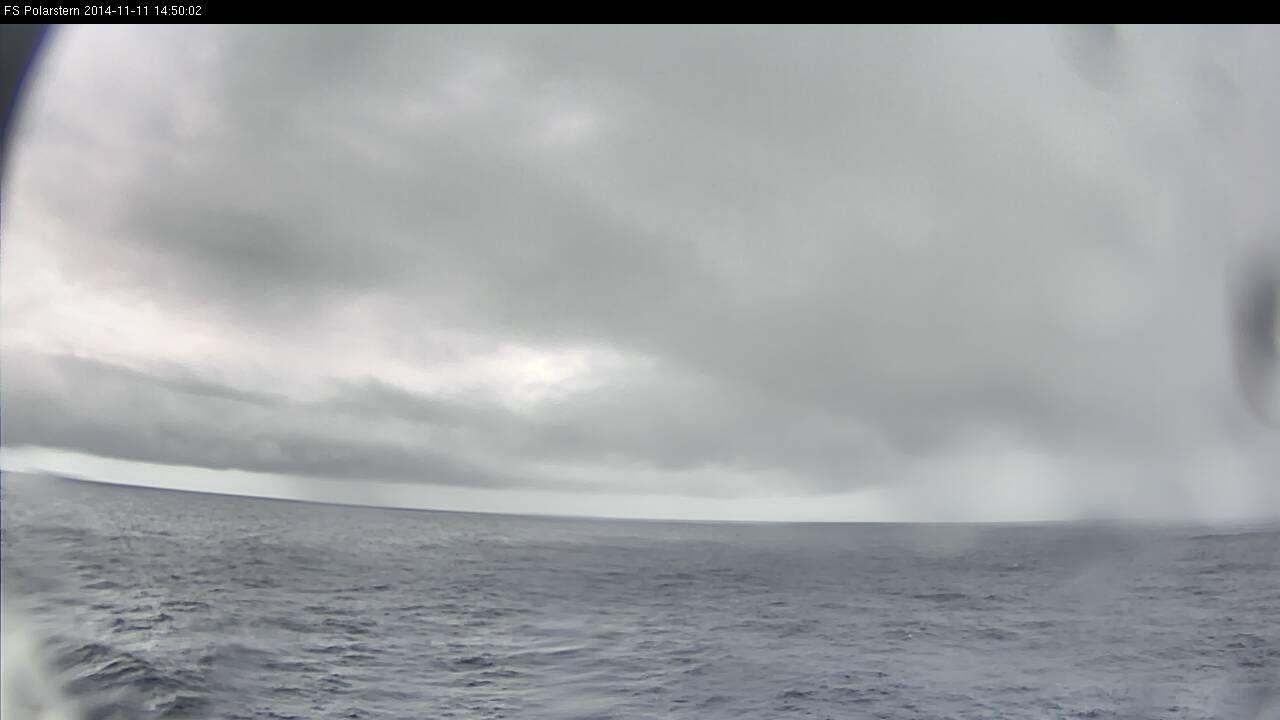
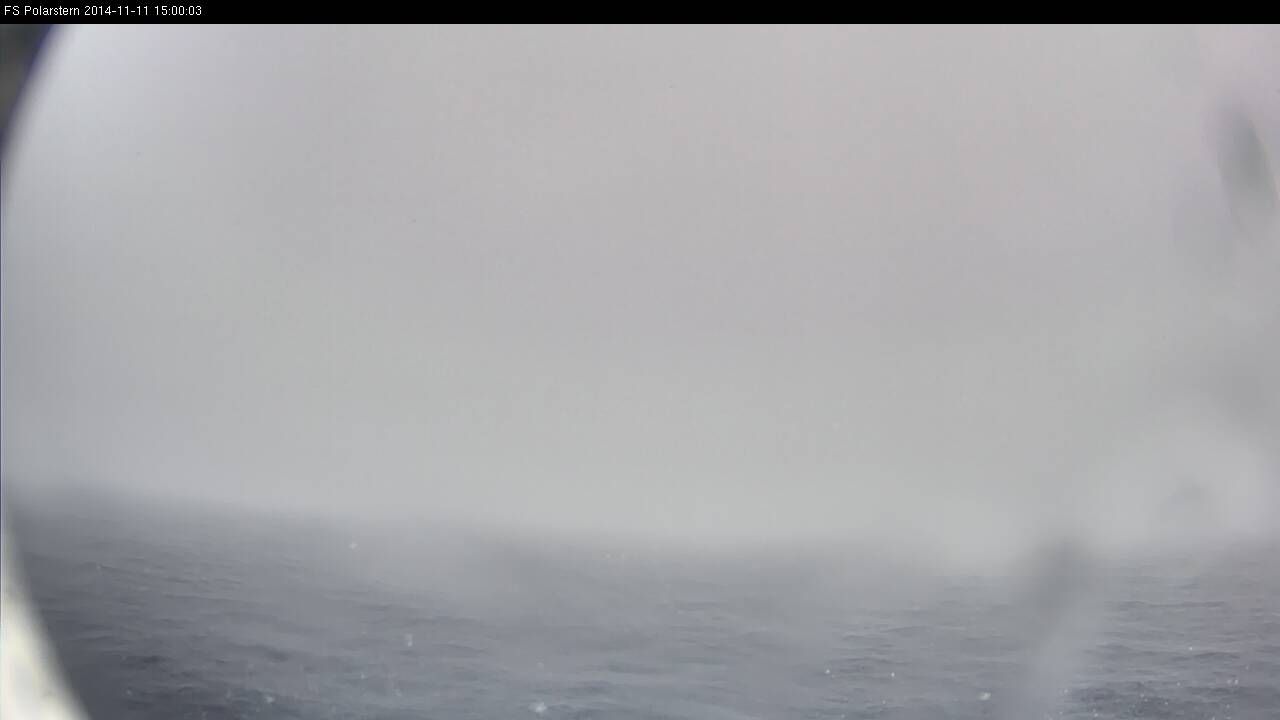
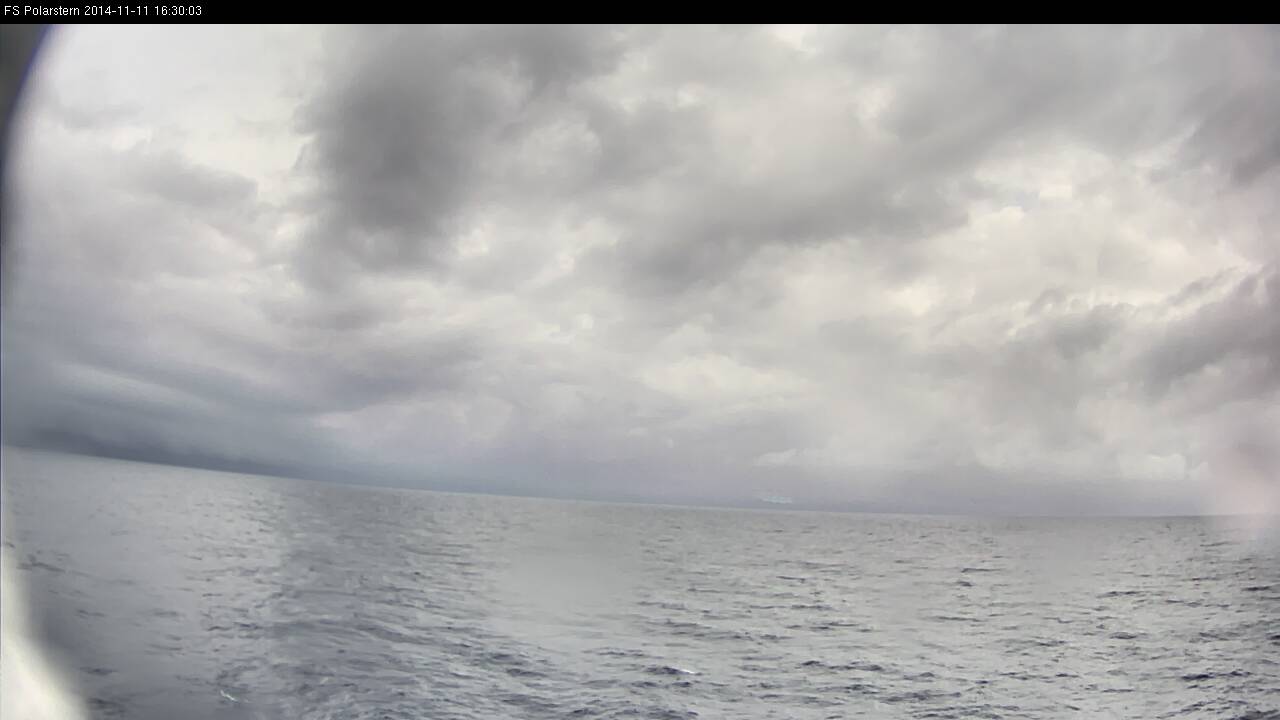
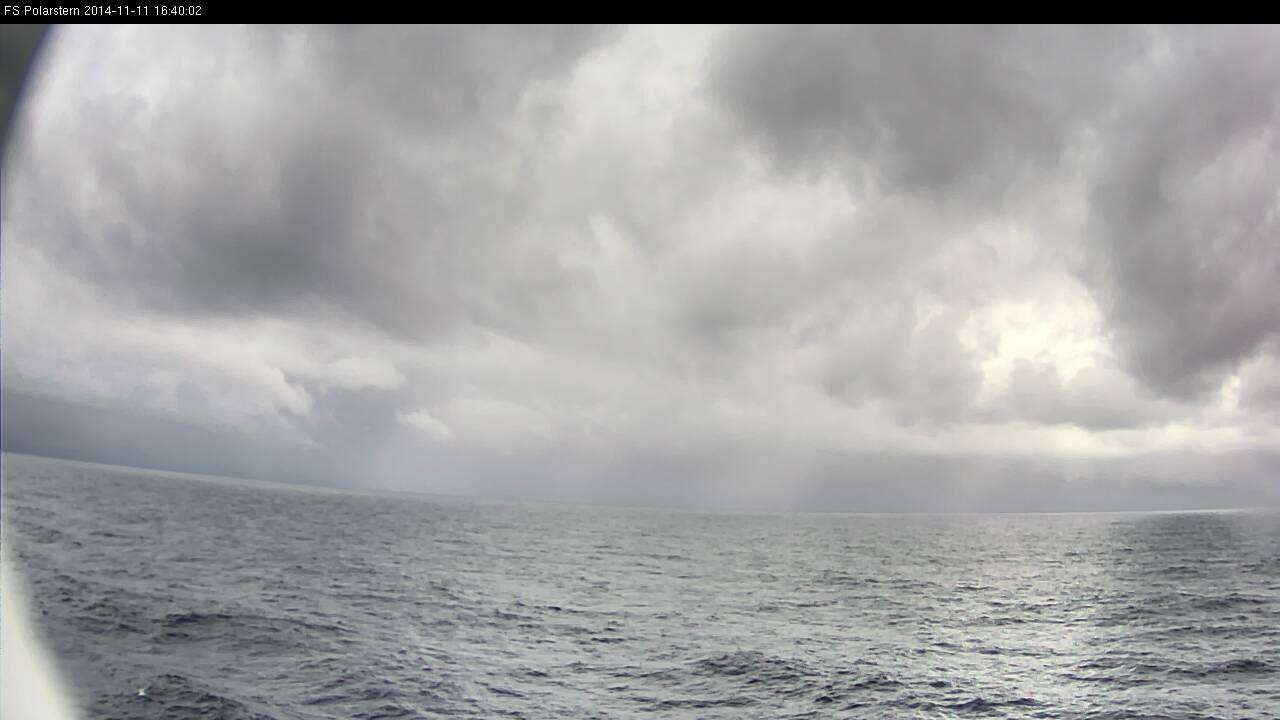
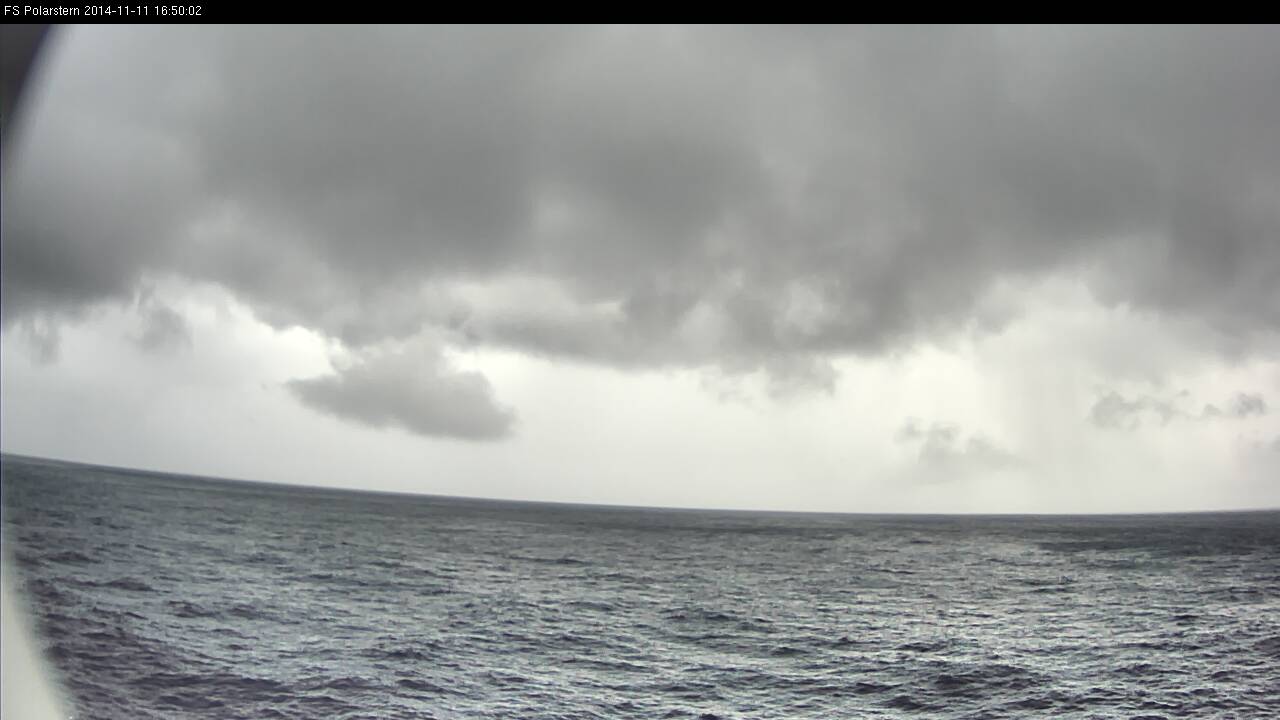
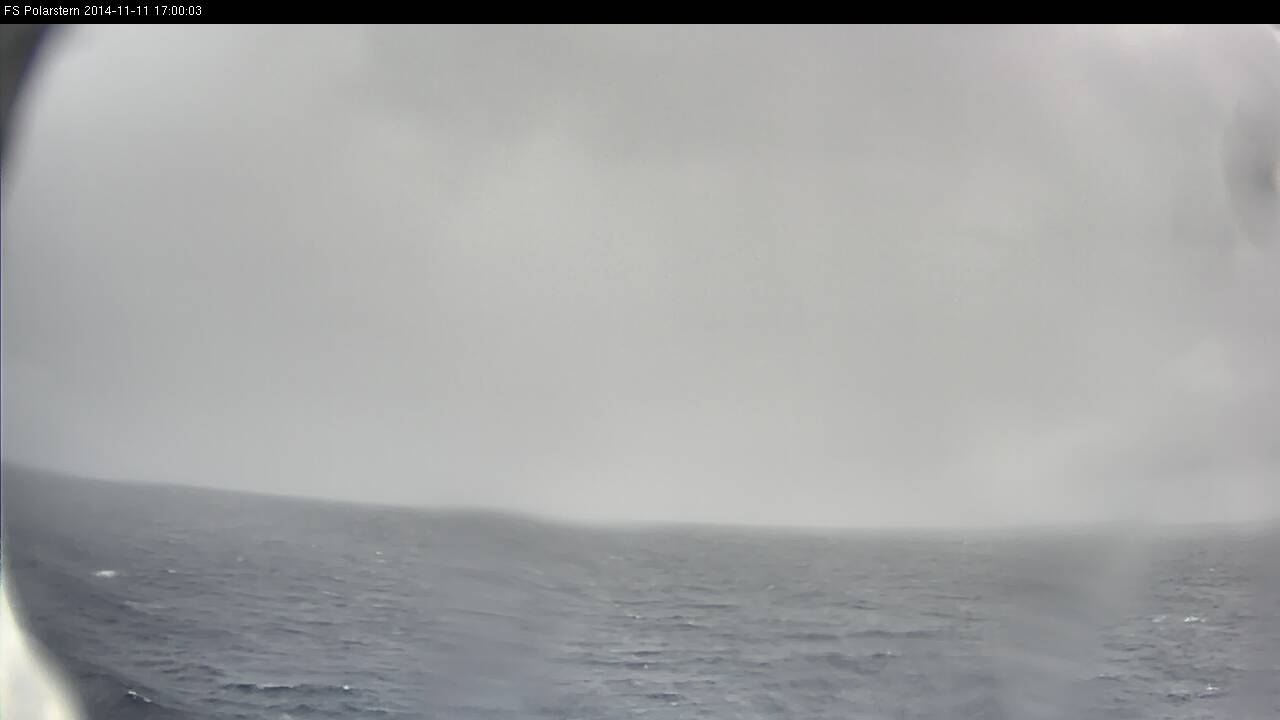
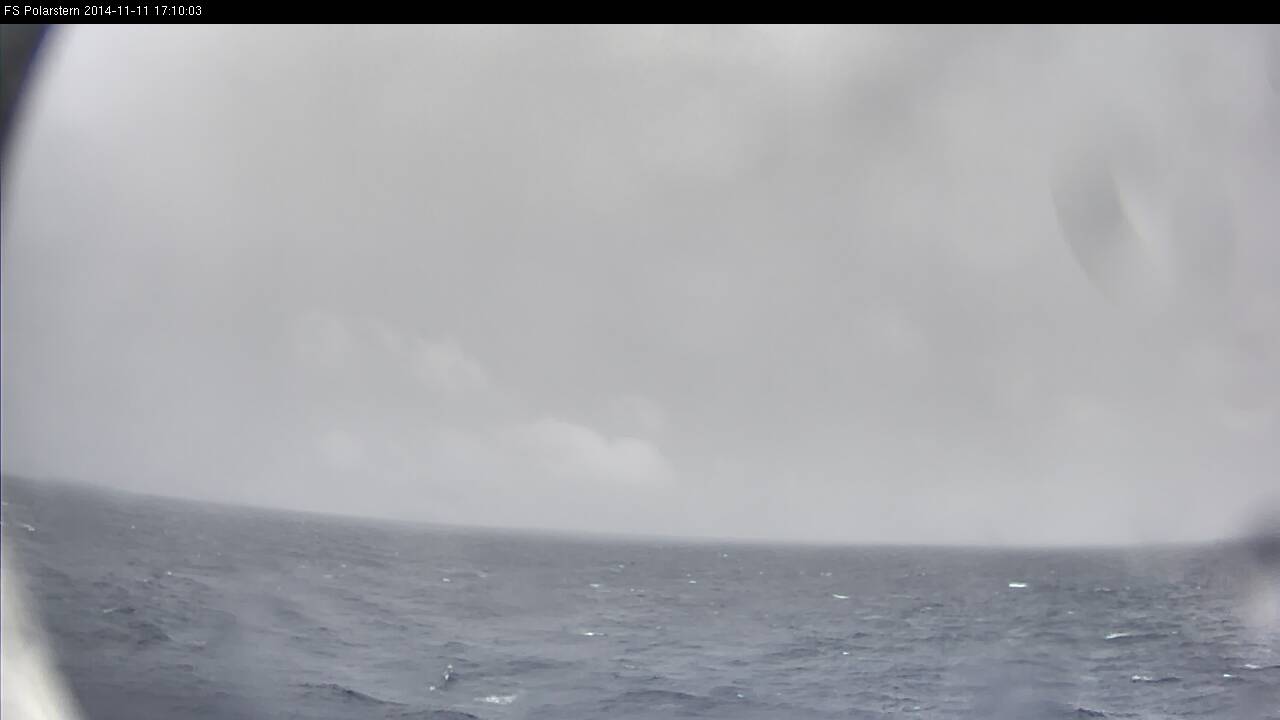
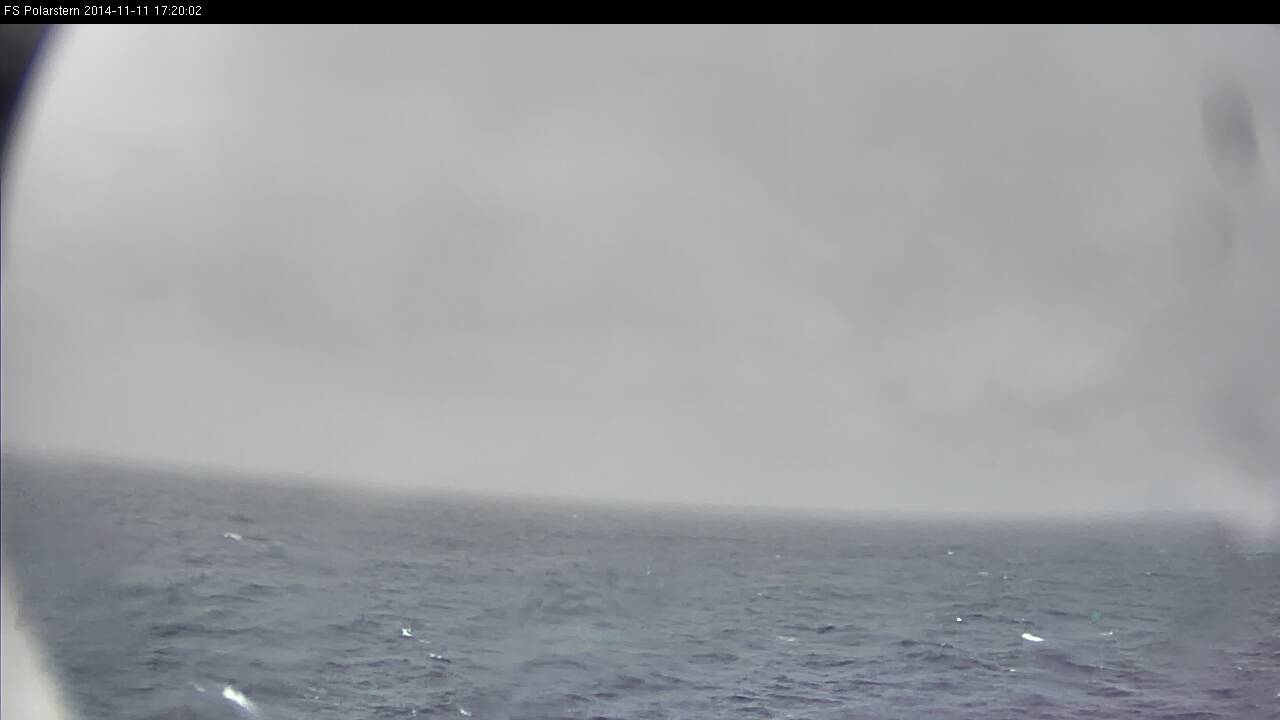
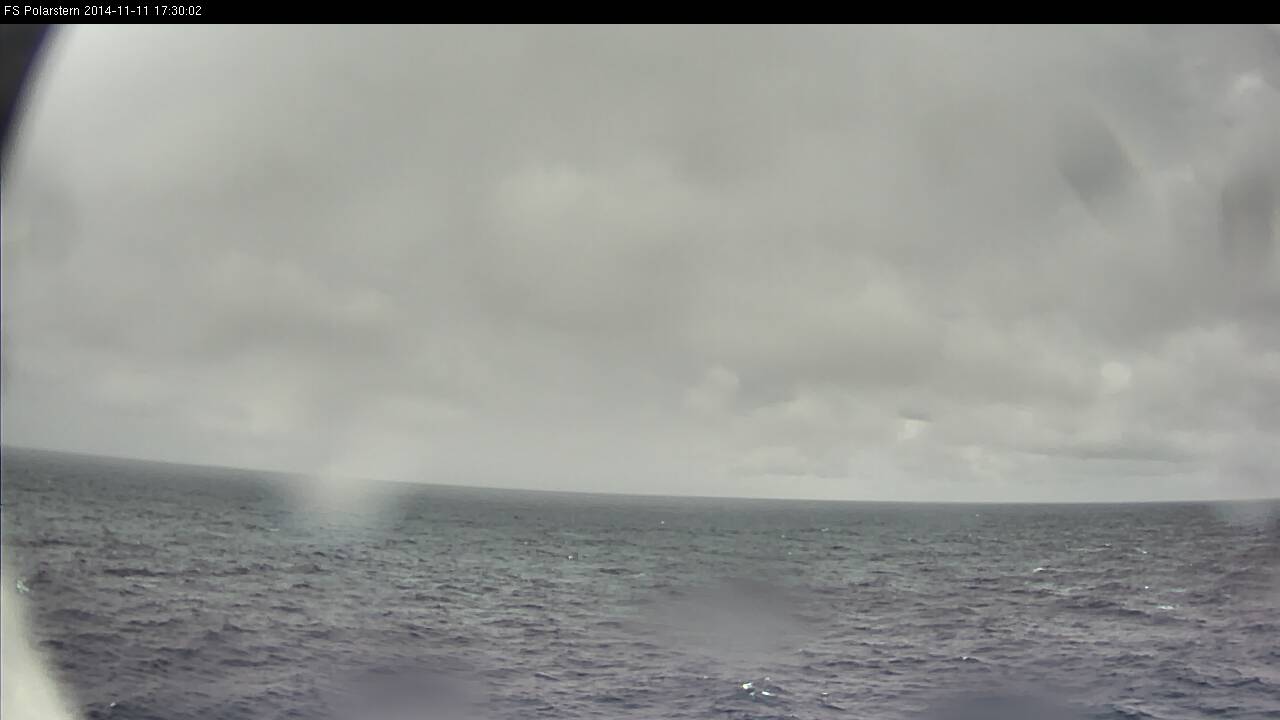
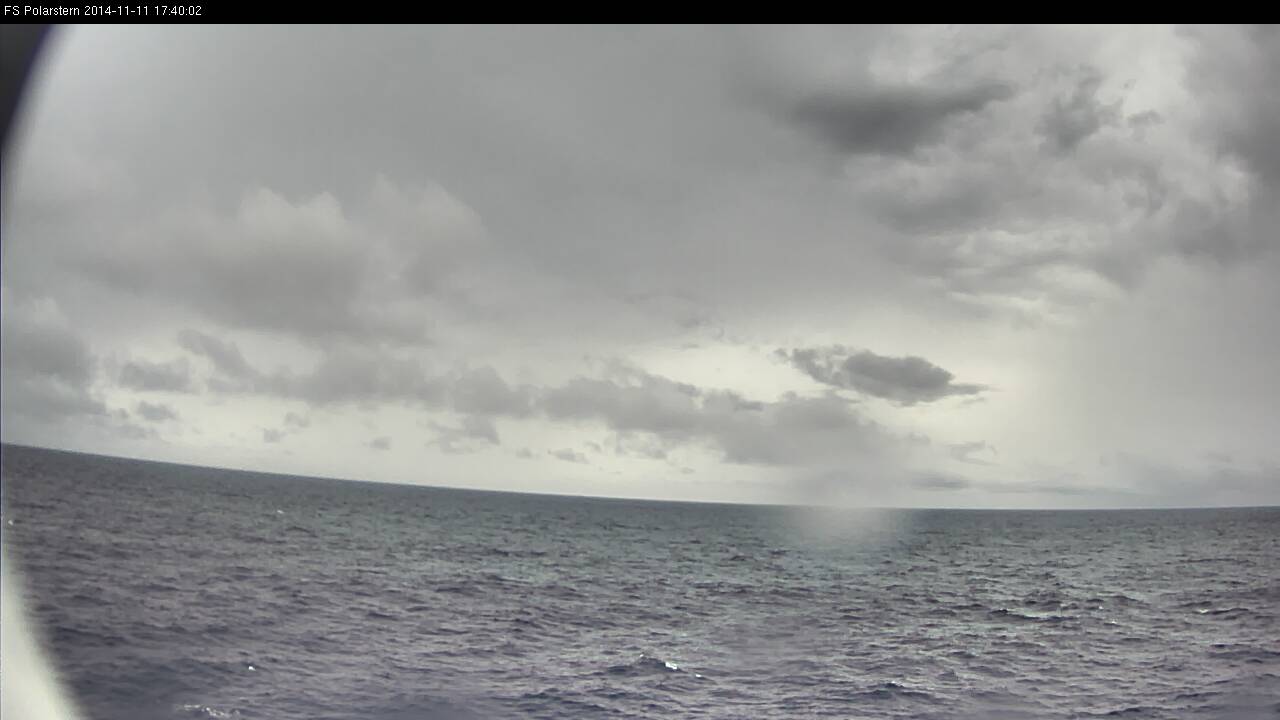
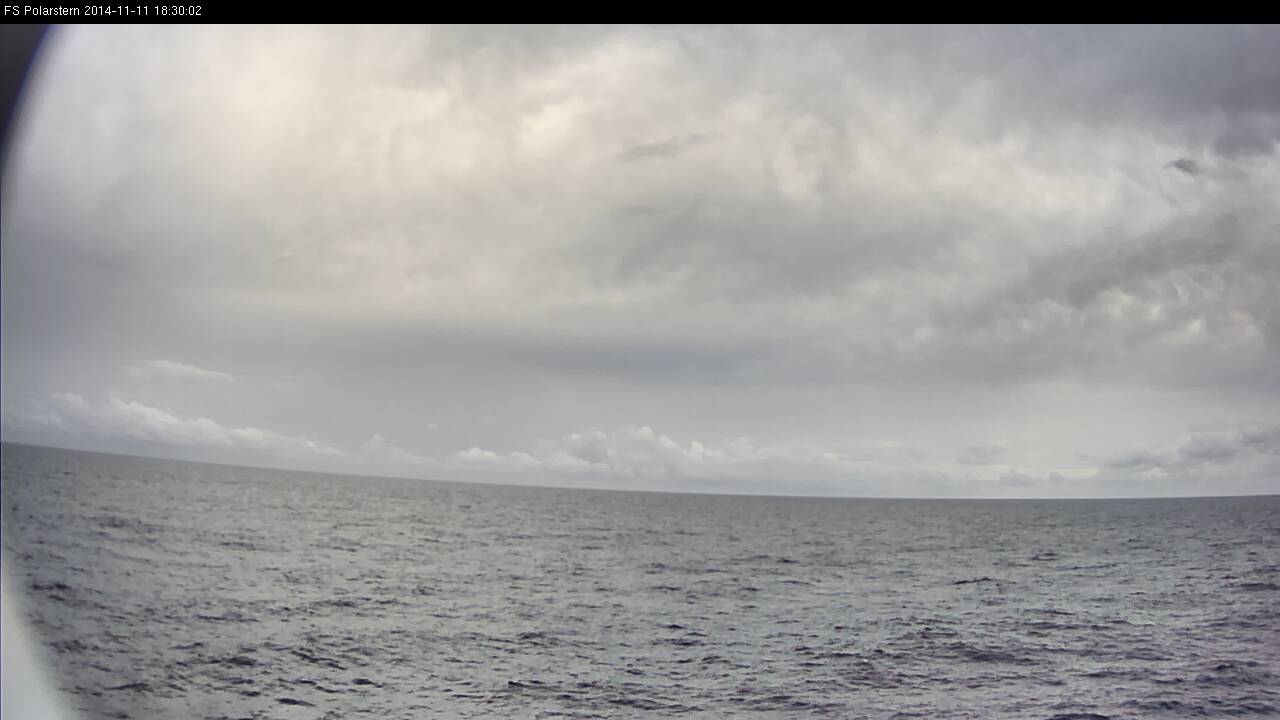
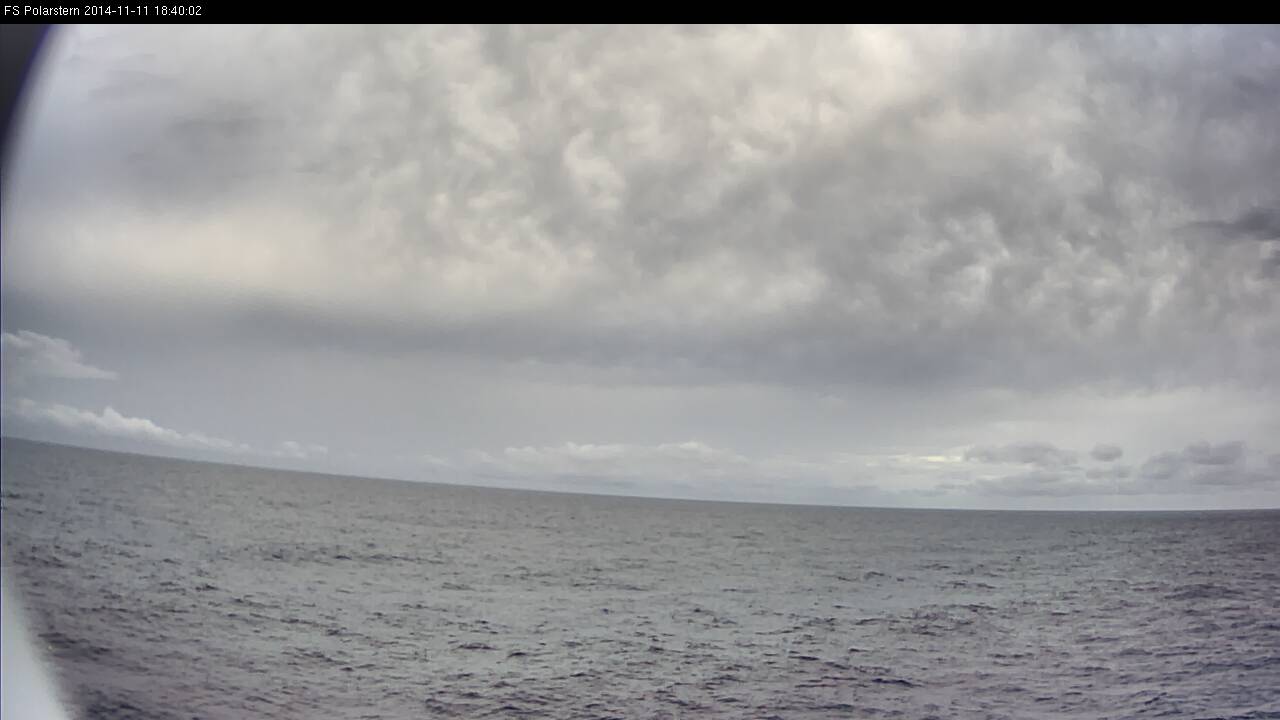
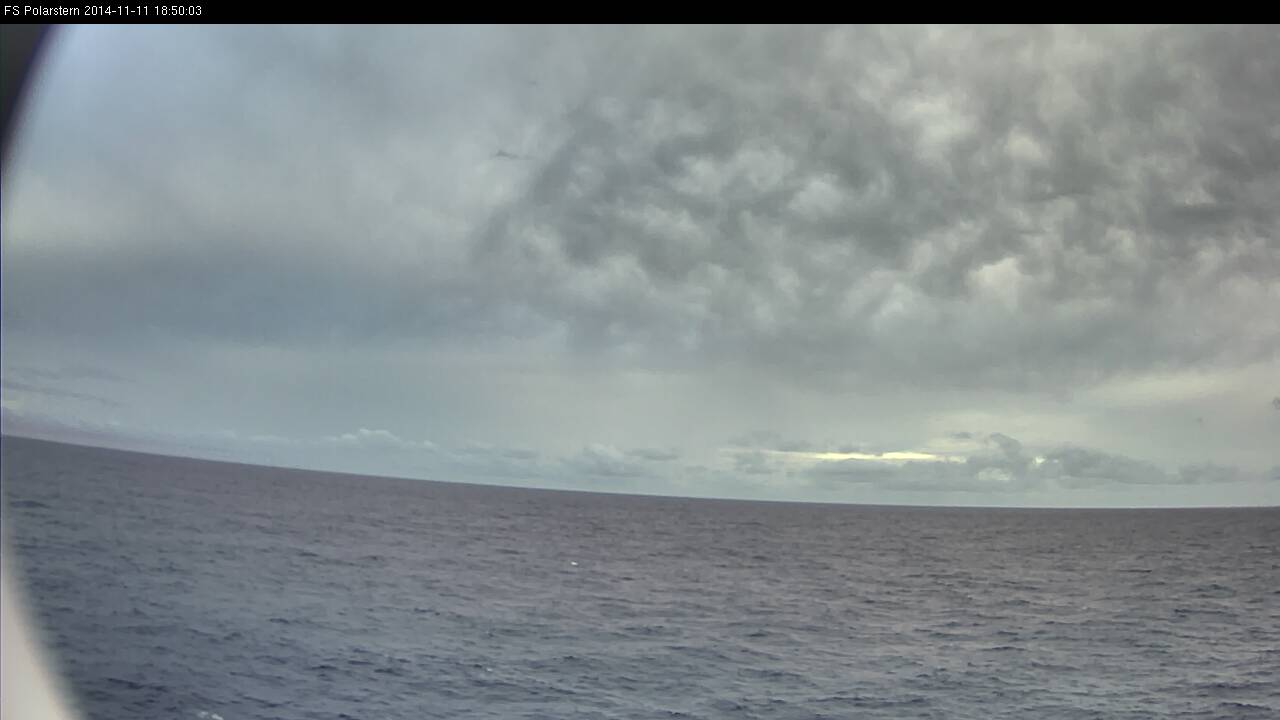
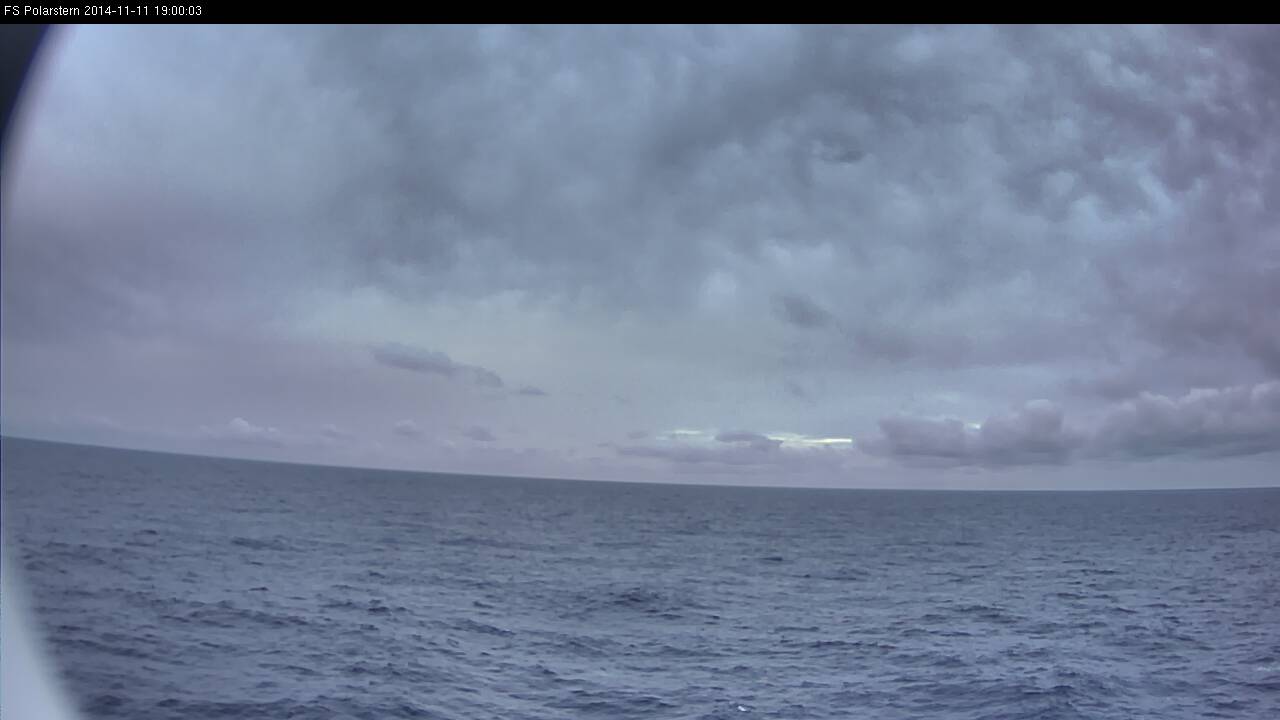
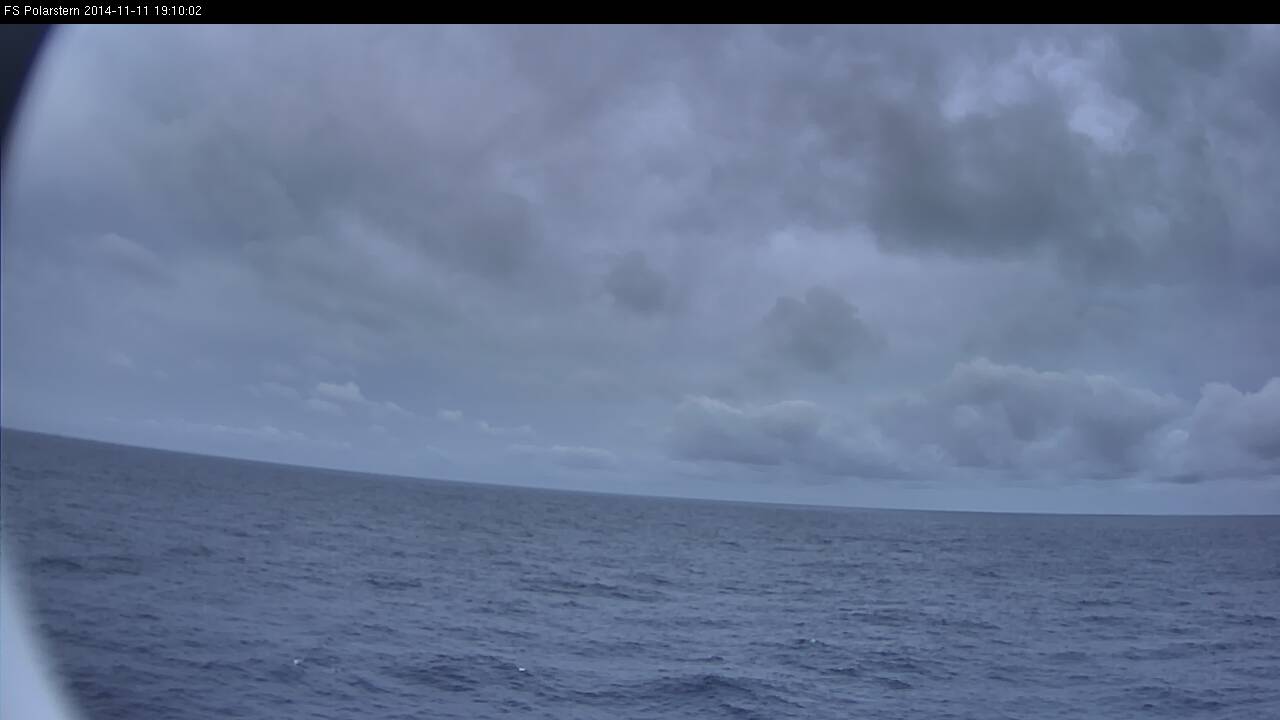
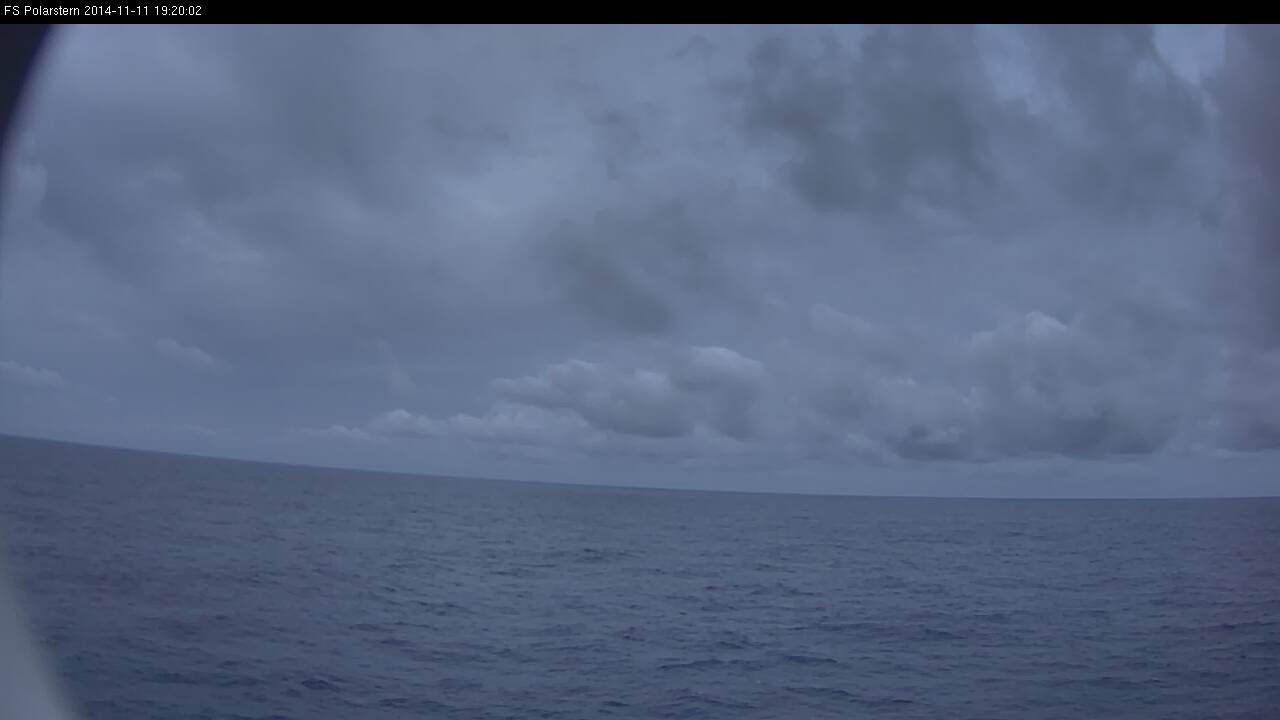
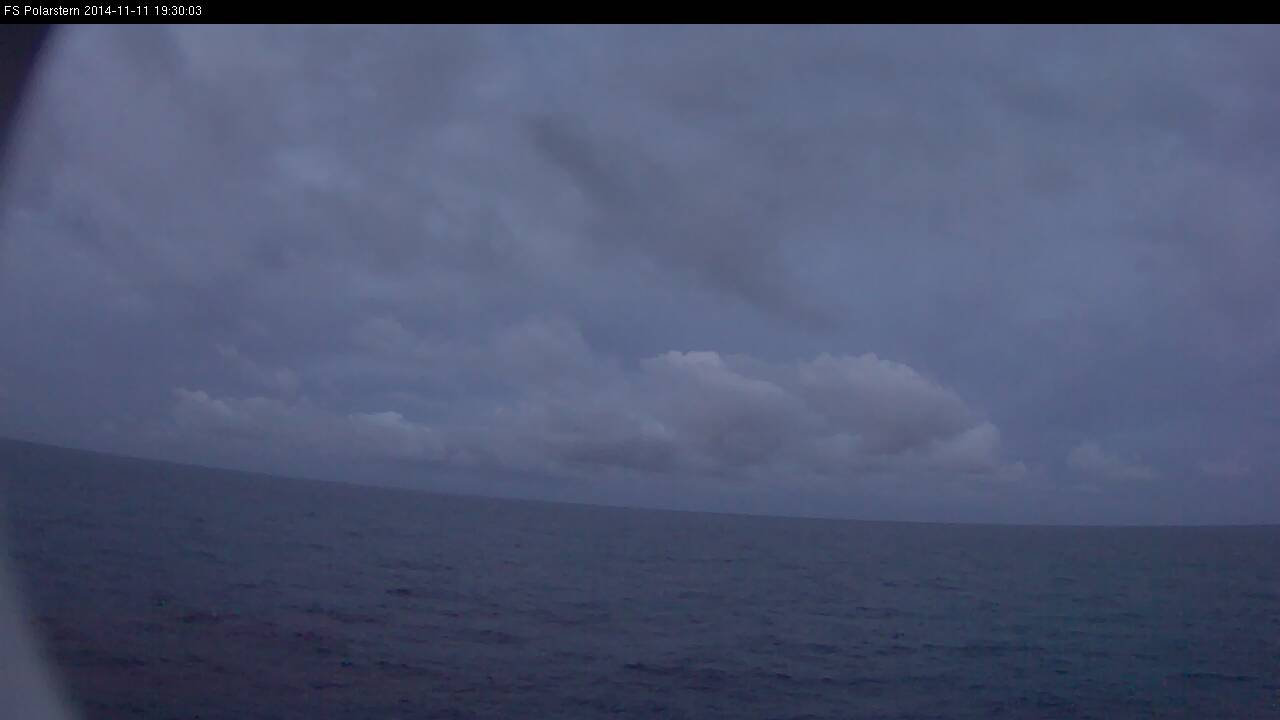
This loop shows all daytime webcam images inside of the ITCZ on 11 Nov 2014 between 07:00 UTC and 19:40 UTC.
Loop 6: Note - click on the loop to go through individual images