Weather situation on 8 November 2014
The Polarstern was sailing in the southern part of the northeastern trade winds and very close to the intertropical convergence zone. Figure L2-5's top half shows a Severe Storms RGB where the yellow dots suggest strong convection due to small ice particles at the cloud tops. The instability is strong enough to generate a thunderstorm near the Polarstern's position at 12:00 UTC. The position of the vessel and the thunderstorm are marked with a white arrow in the small detail square at the top right. You will find a brief description about the colors around the Polarstern's position in the Colour Interpretation Guide.
http://www.eumetrain.org/resources/MSG_severestorm_yellow_cloud.html
The bottom half of Fig. L2-5 shows the same situation in the Dust RGB.
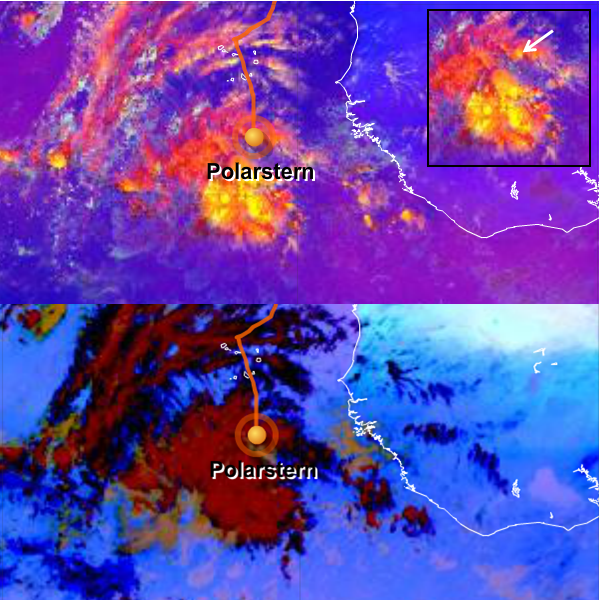
Figure L2-5: 8 Nov 2014, 12:00 UTC. Above: Severe Storms RGB. Below: Dust RGB. Source: EUMeTrain.
High opaque clouds appear red in the Dust RGB. A more detailed explanation of each component color's contribution to this red appearance can be found in the Colour Interpretation Guide:
http://www.eumetrain.org/resources/MSG_dust_red_clouds.html
As a point of contrast between the two images, only the Severe Storms RGB shows the active convective parts of the ITCZ.

Figure L2-6: 8 Nov 2014, 12:00 UTC, Severe Storms RGB, ASCAT wind vector. Source: EUMeTrain.
Fig. L2-6 shows the scatterometer winds from ASCAT, an instrument onboard the polar satellite MetOp. The figure depicts the wind vector field at the sea surface attained by measuring the radar backscatter signal. Because of its wavelength (5 cm) the signal of ASCAT is not too affected by rain. You can see that the general wind direction is NNE/NE but in the vicinity of the thunderstorms the direction varies from N to E.
If you are interested in a closer look at the ASCAT data and the fundamentals of the instrument, see the list of links at the end of this logbook entry.
The 12:00 UTC SYNOP measurement shows a wind direction and speed of 60° / 07 knots, a thunderstorm with light or moderate rain and 7/8 Cumulonimbus capillatus. DBLK is the Polarstern's call sign.
DBLK 08121 99107 70230 11396 80607 10240 20221 40155 51019 6///1 79522 879//
22242 04283 20301 302// 40803 6//// =
The 12:00 UTC sounding shows this strong lability except in the small trade wind inversion around 1 km. If the inversion disappears, the cumulonimbus clouds could grow up to 150 hPa (ca. 13 km) near the ITCZ.
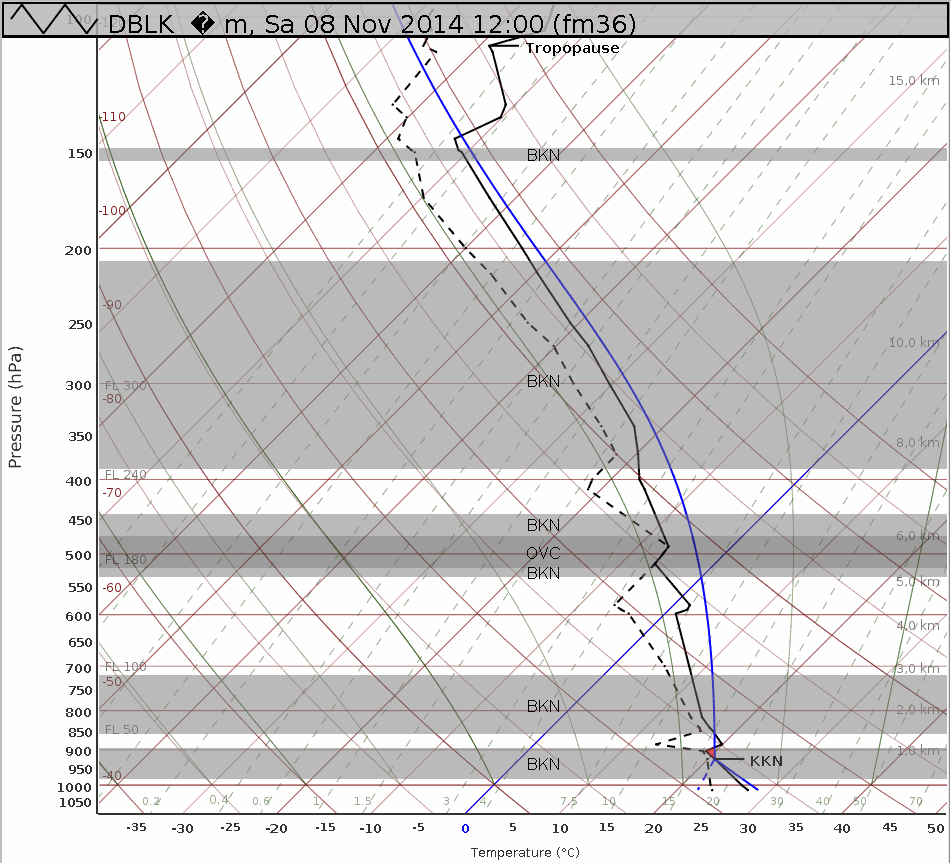
Figure L2-7: Sounding from the Polarstern, 8 Nov 2014, 12:00 UTC. KKN = Lifted condensation level. BKN (broken) = 5/8-7/8 cloud cover in the given layer, OVC (overcast) = 8/8 cloud cover in the given layer. Source: DWD.
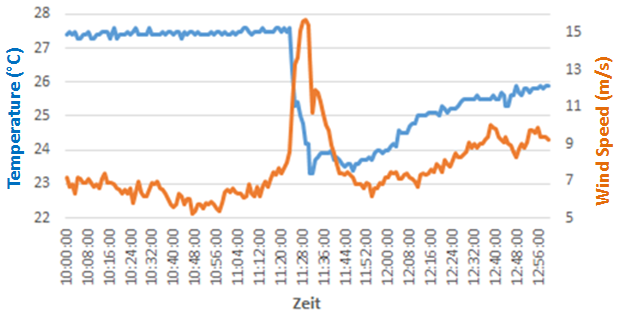
Figure L2-8: Course of temperature and wind speed on 8 Nov 2014 from 10:00 UTC to 12:56 UTC measured on the Polarstern during a thunderstorm. Source: DWD.
In this thunderstorm the temperature falls from 27,5°C to 23,5°C and the wind speed increases briefly to nearly 15 m/s. Because the water temperature is 28,3°C, after the shower the air temperature rises continously up to 26°C by the end of this time frame.
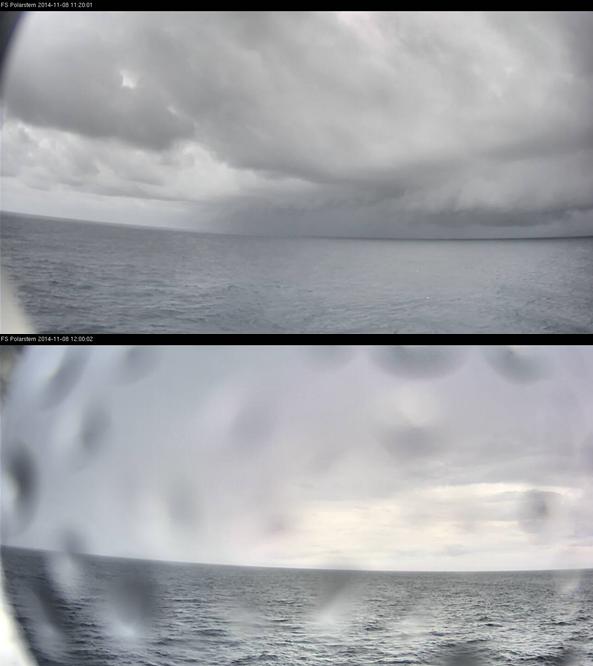
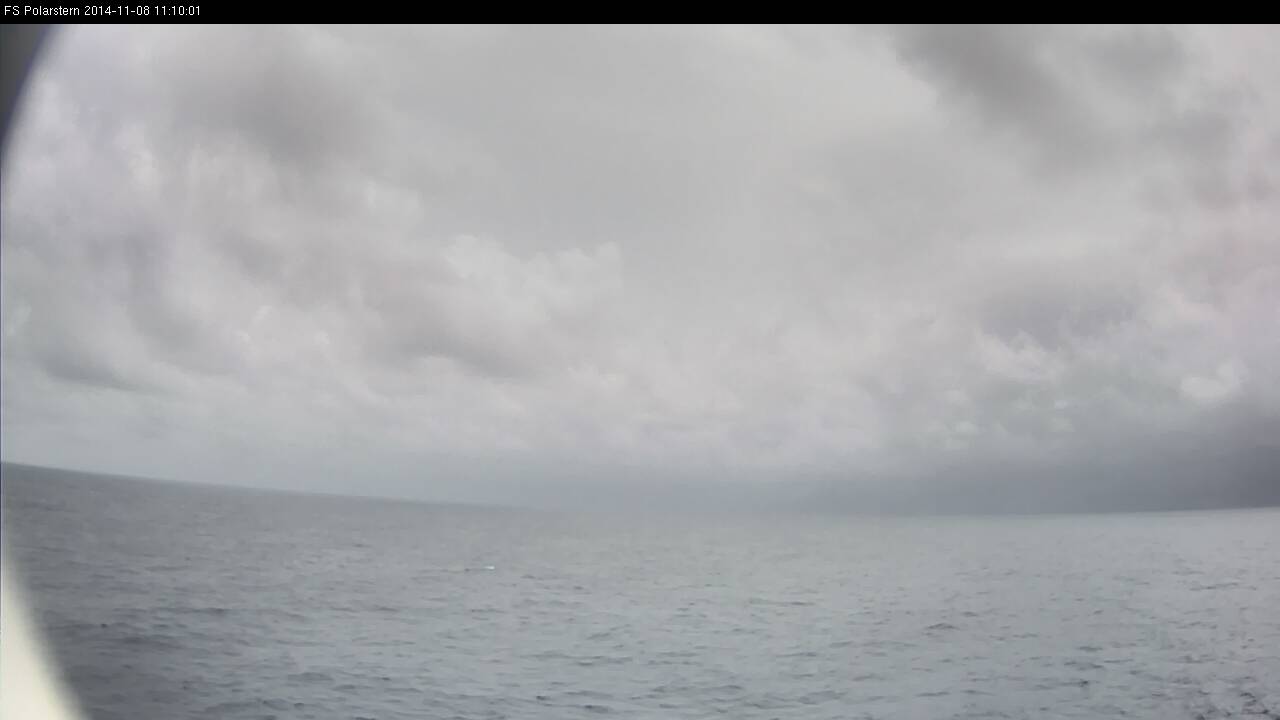
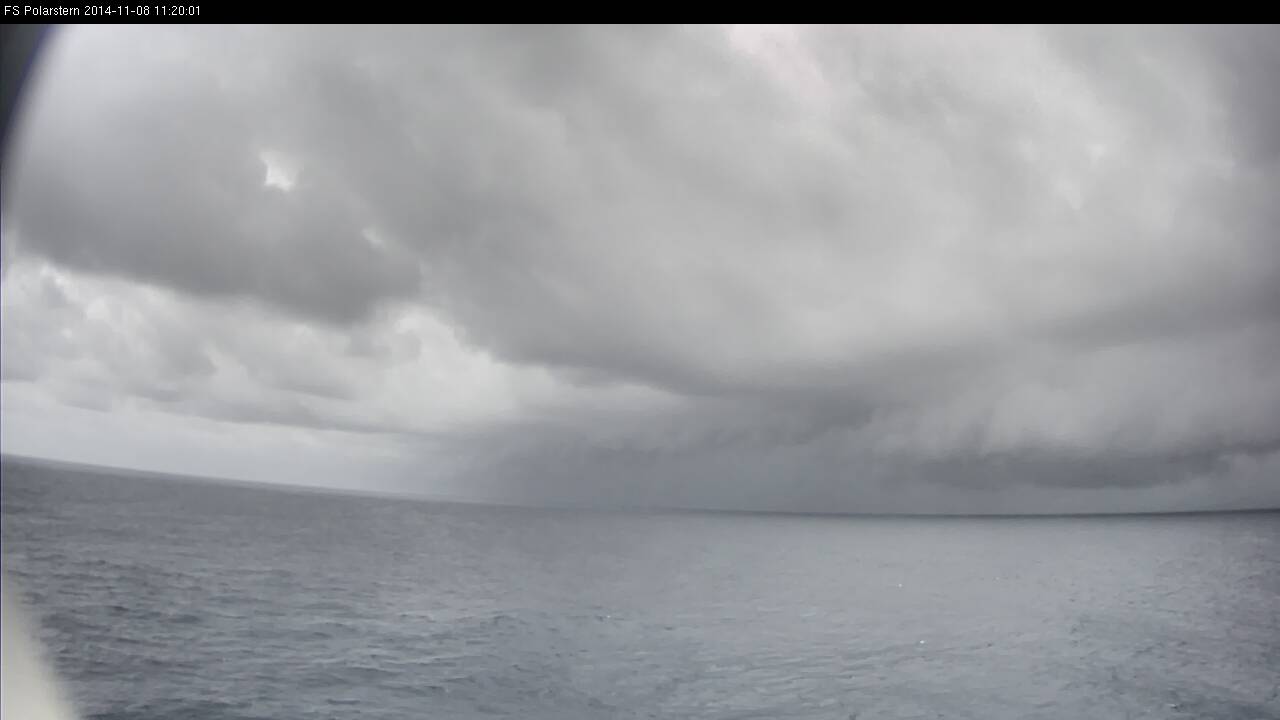
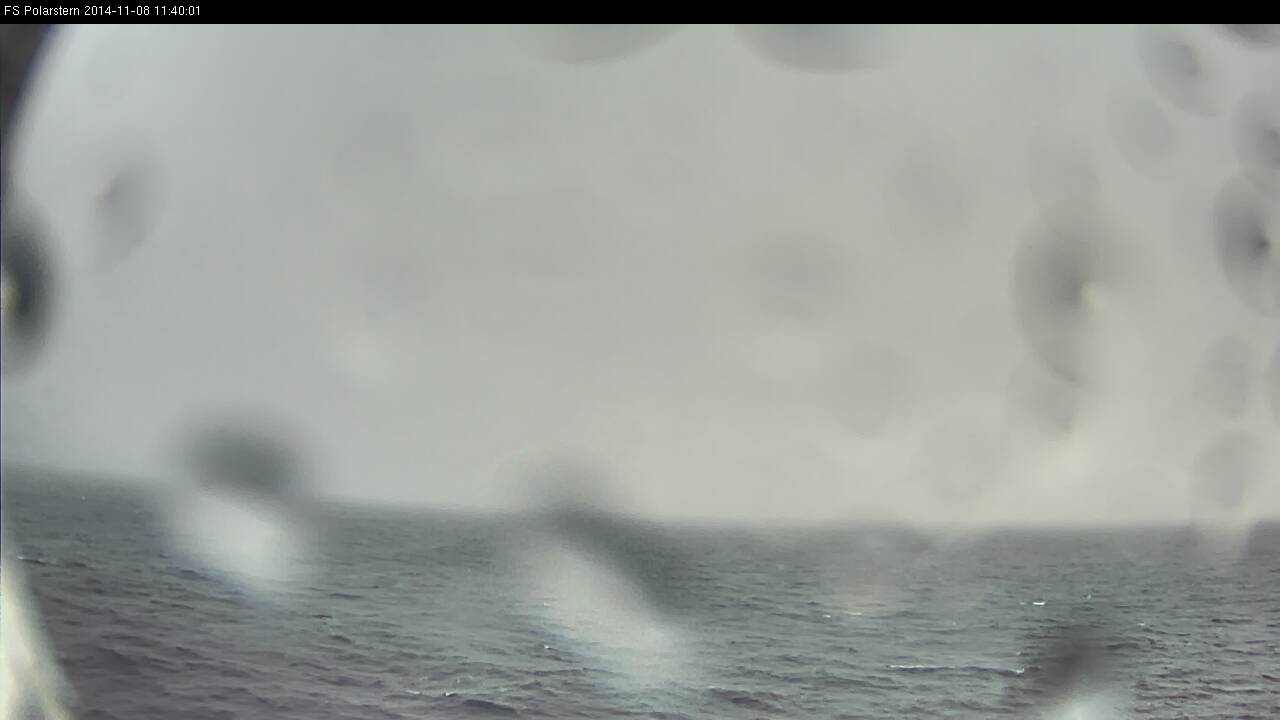
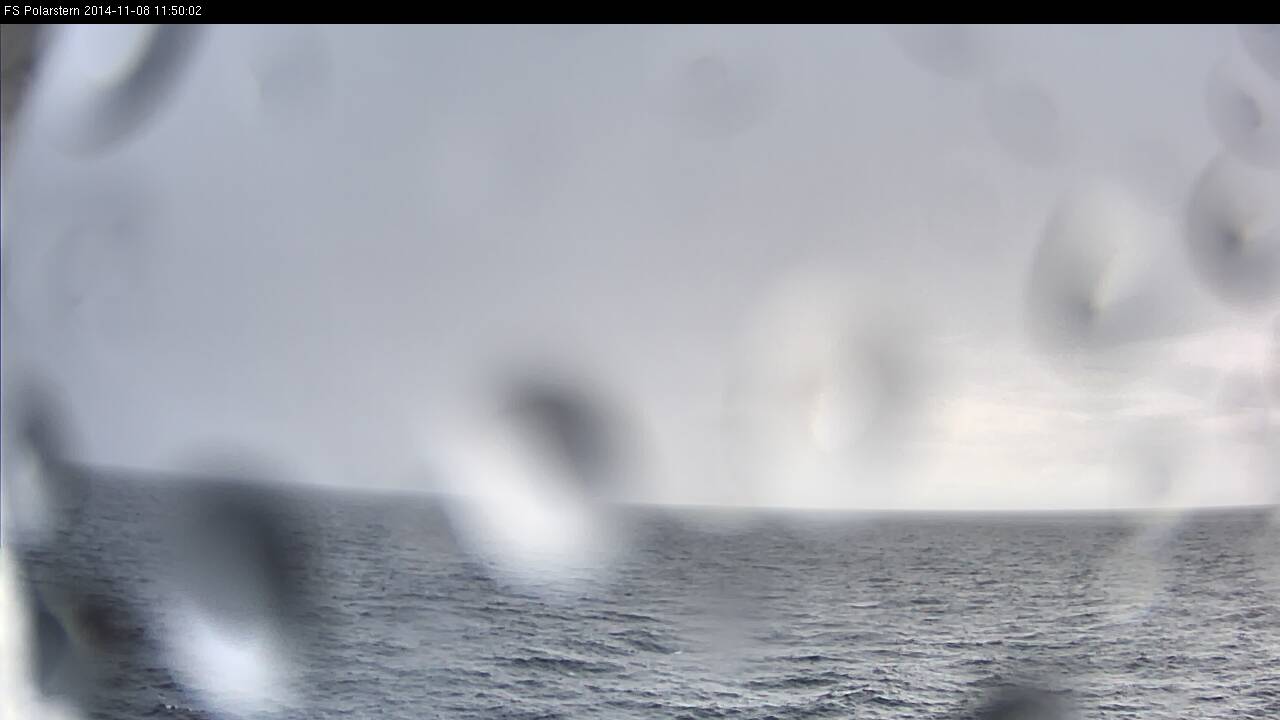
Figure L2-9: Webcam image from 8 Nov 2014 at the beginning and end of the thunderstorm. Source: DWD.
Above: 11:20 UTC with arcus clouds. Below: 12:00 UTC.
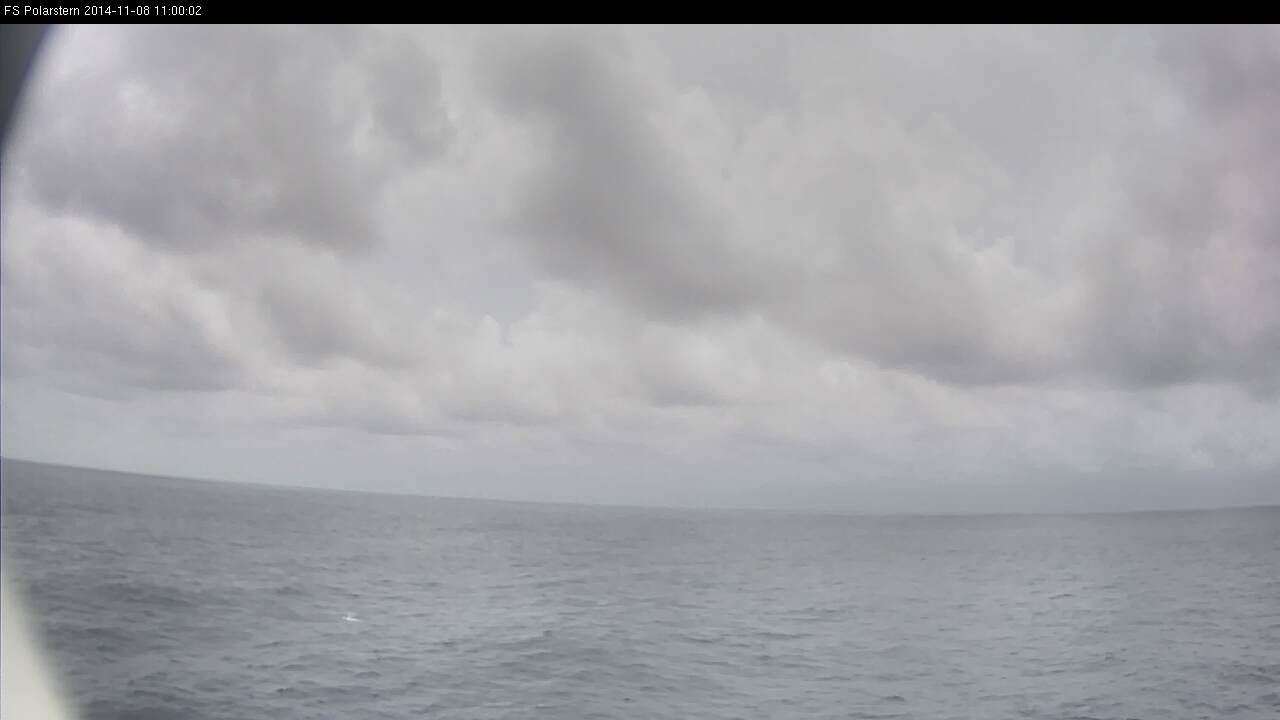
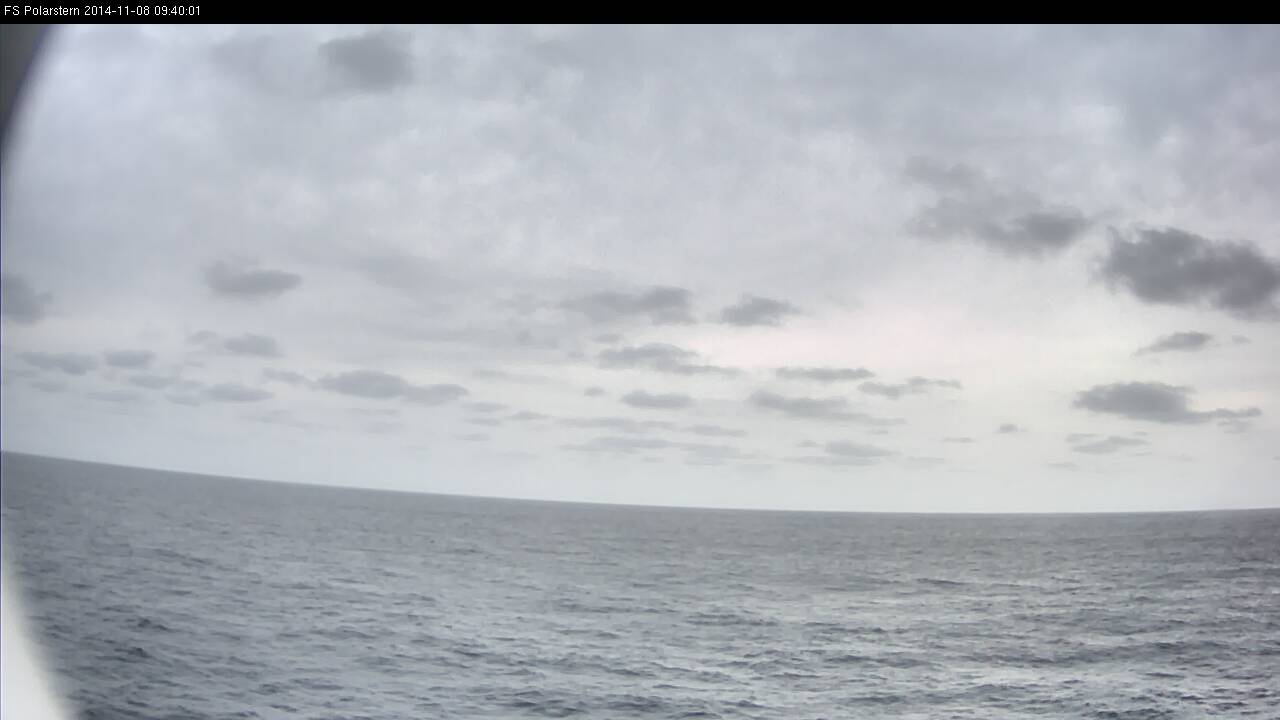
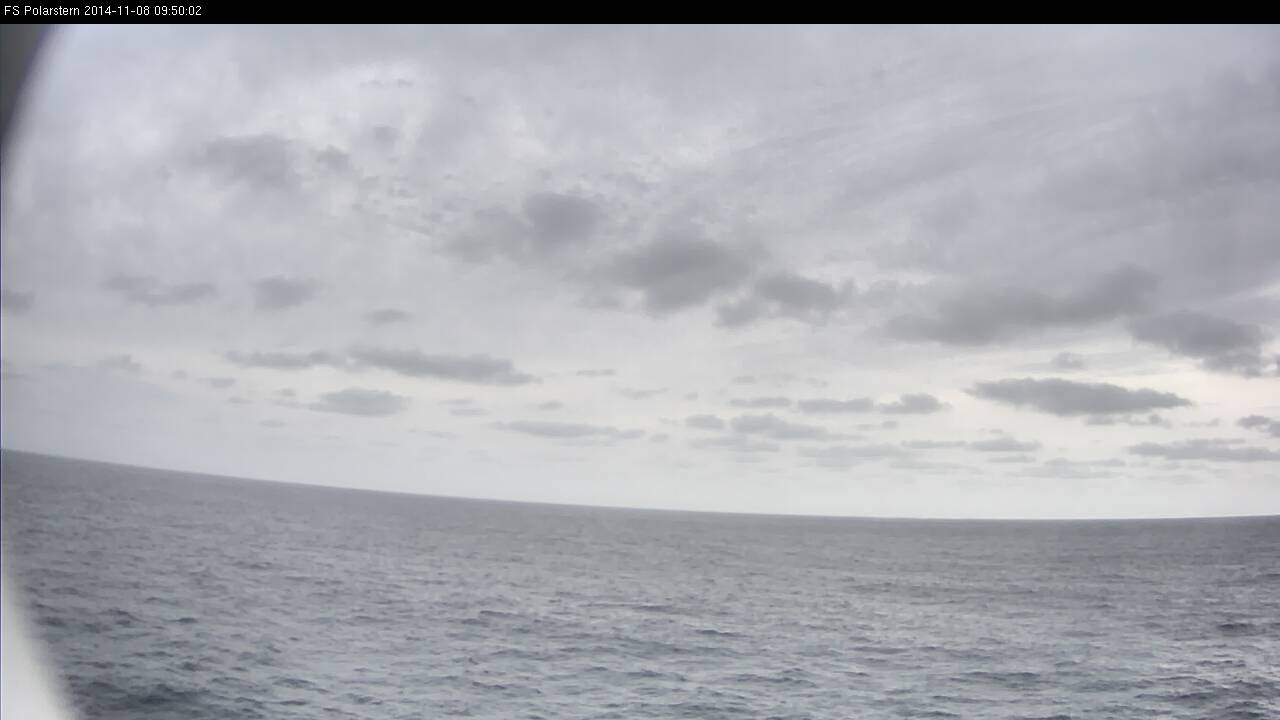
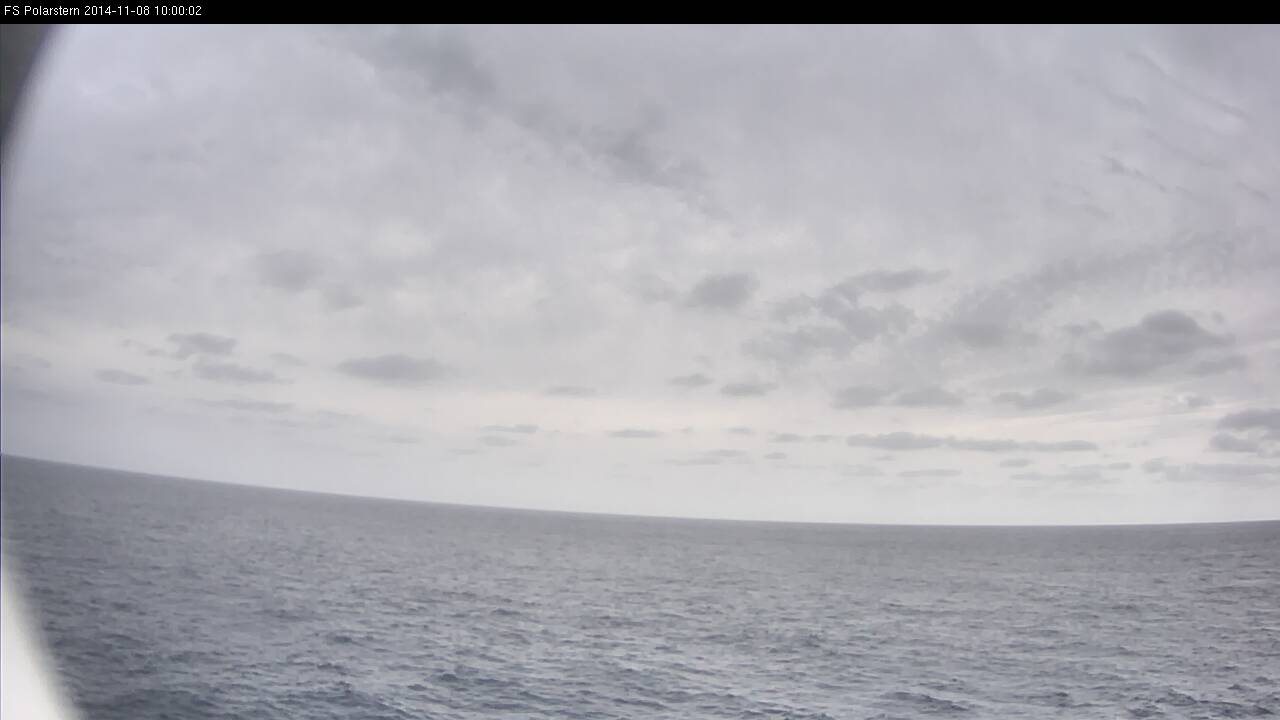
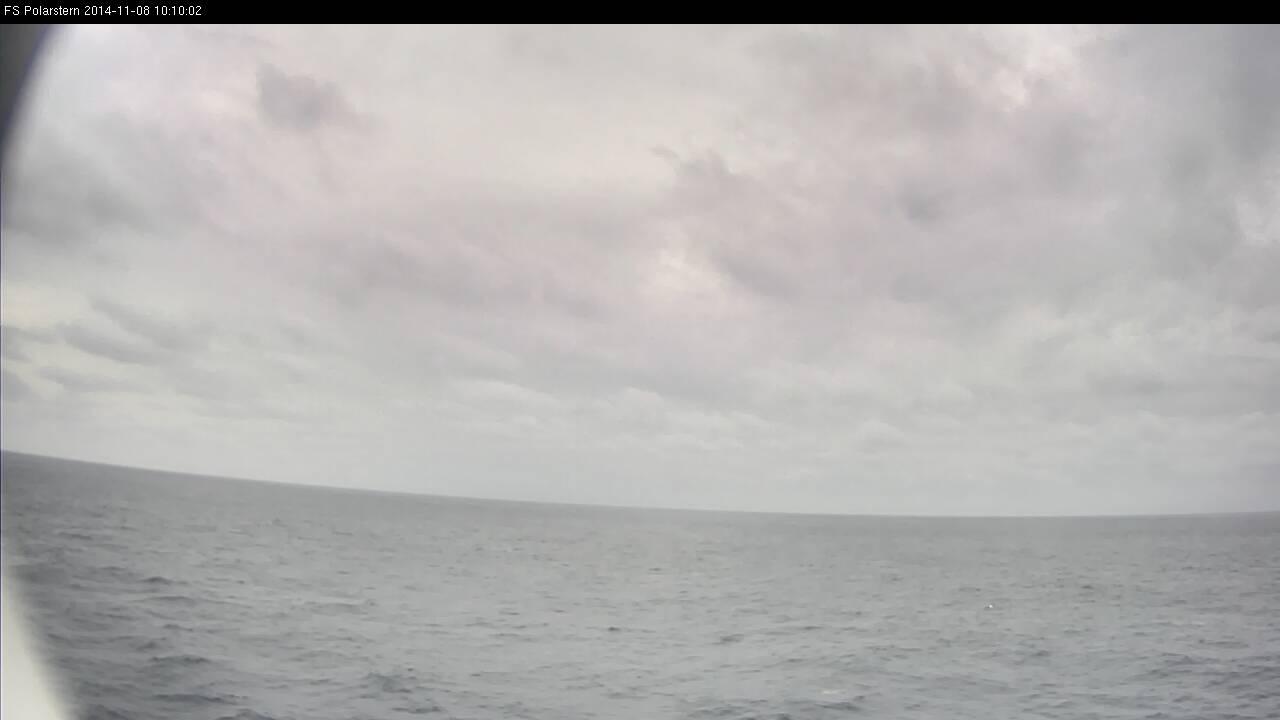
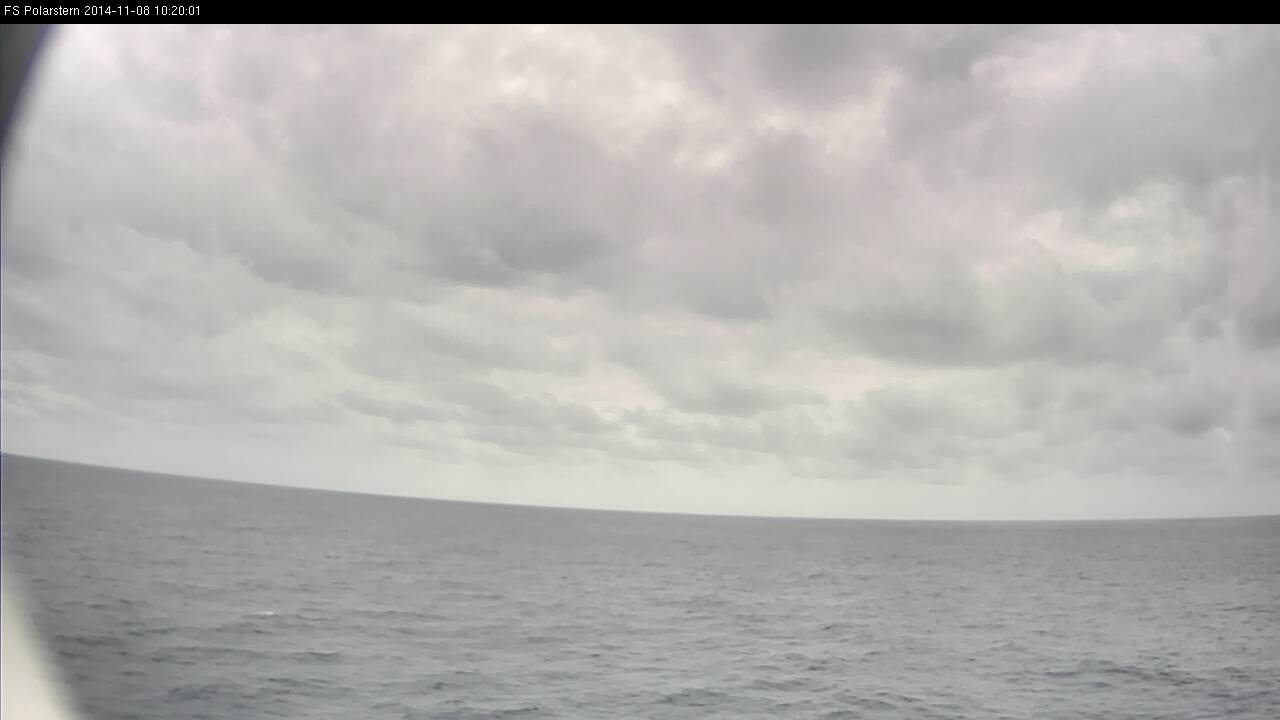
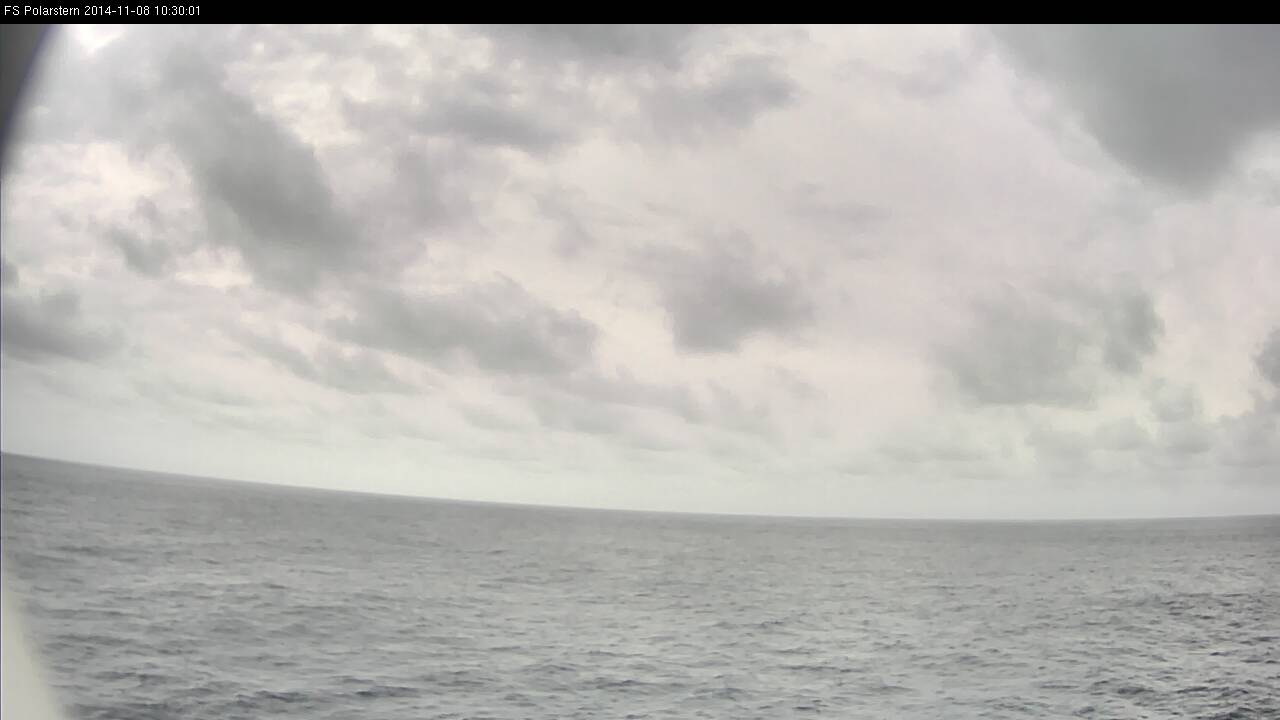
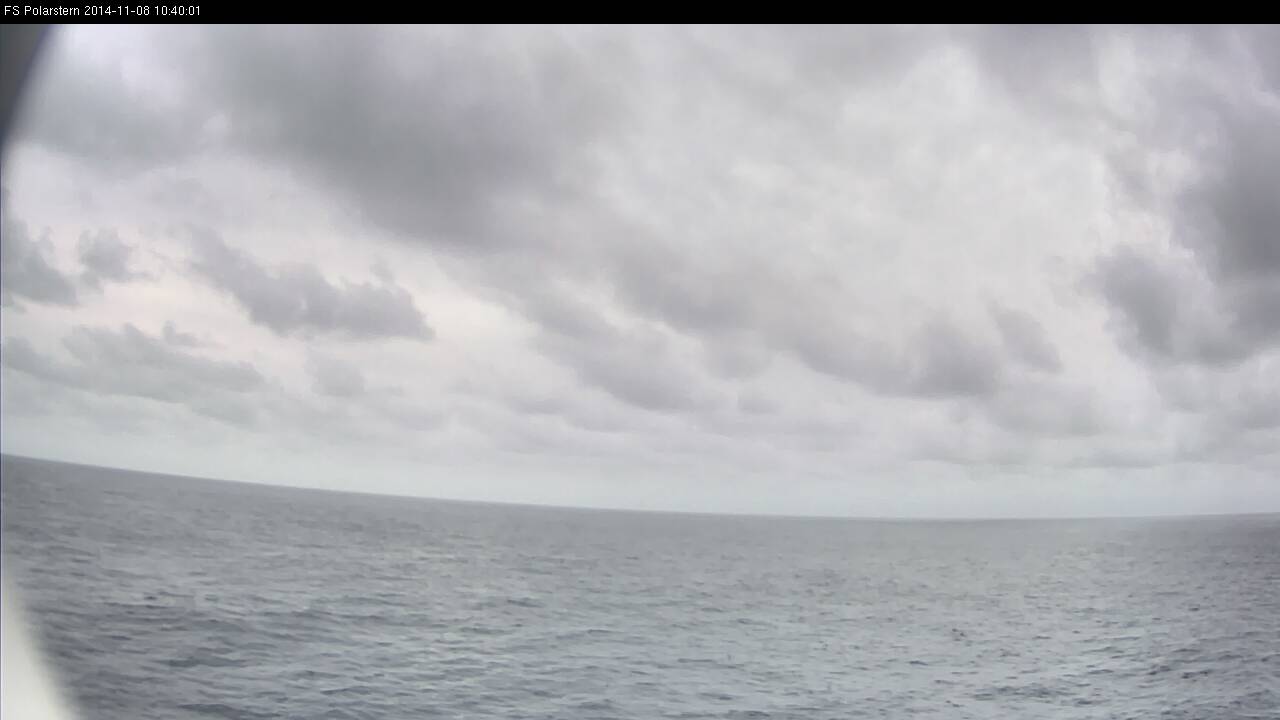
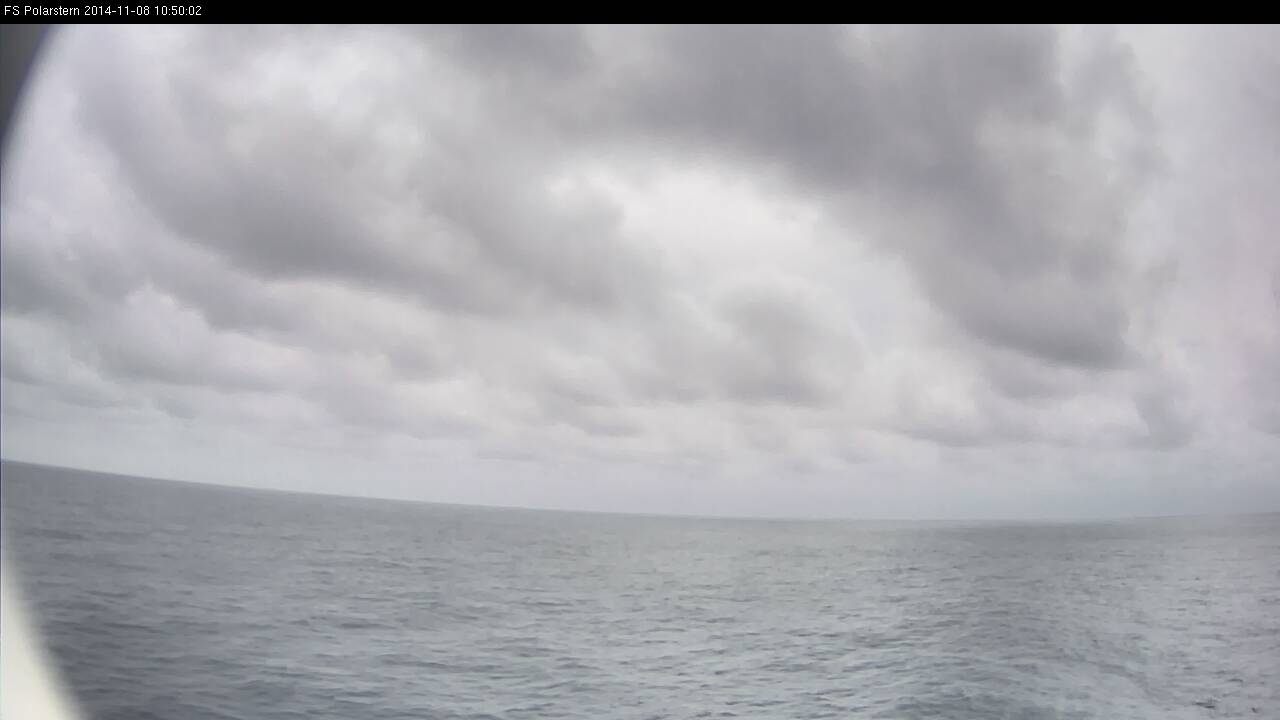
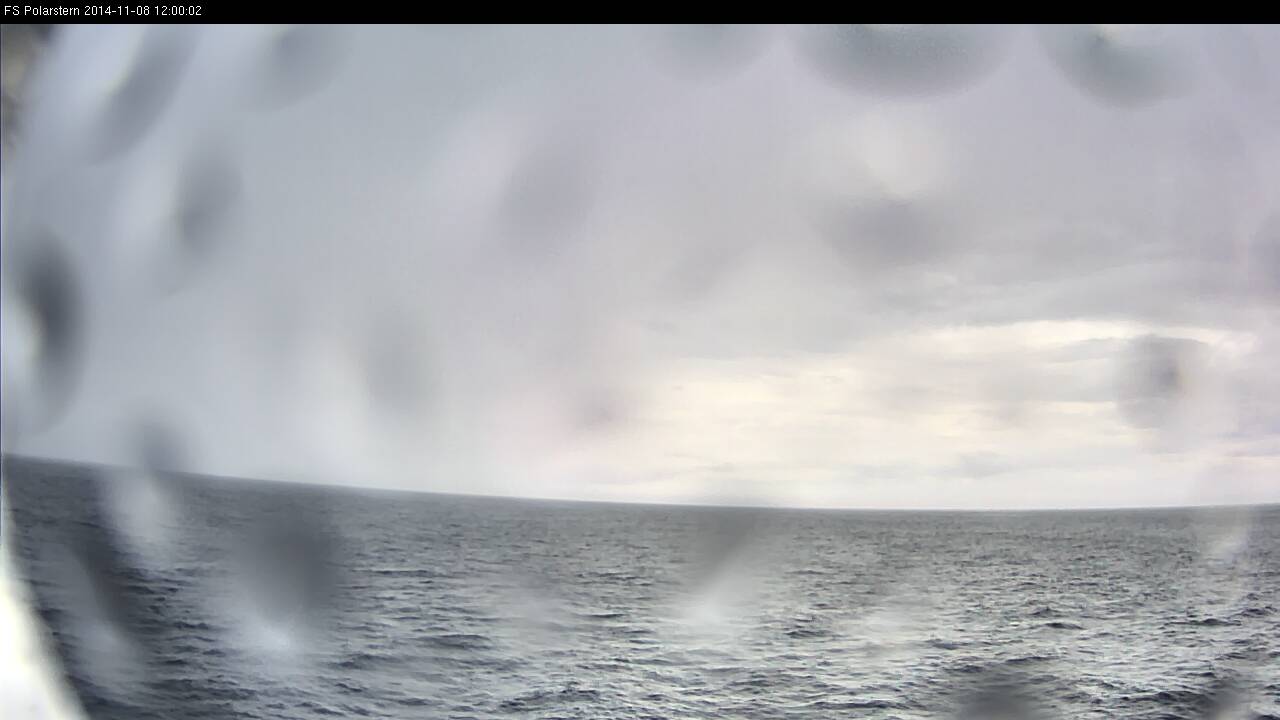
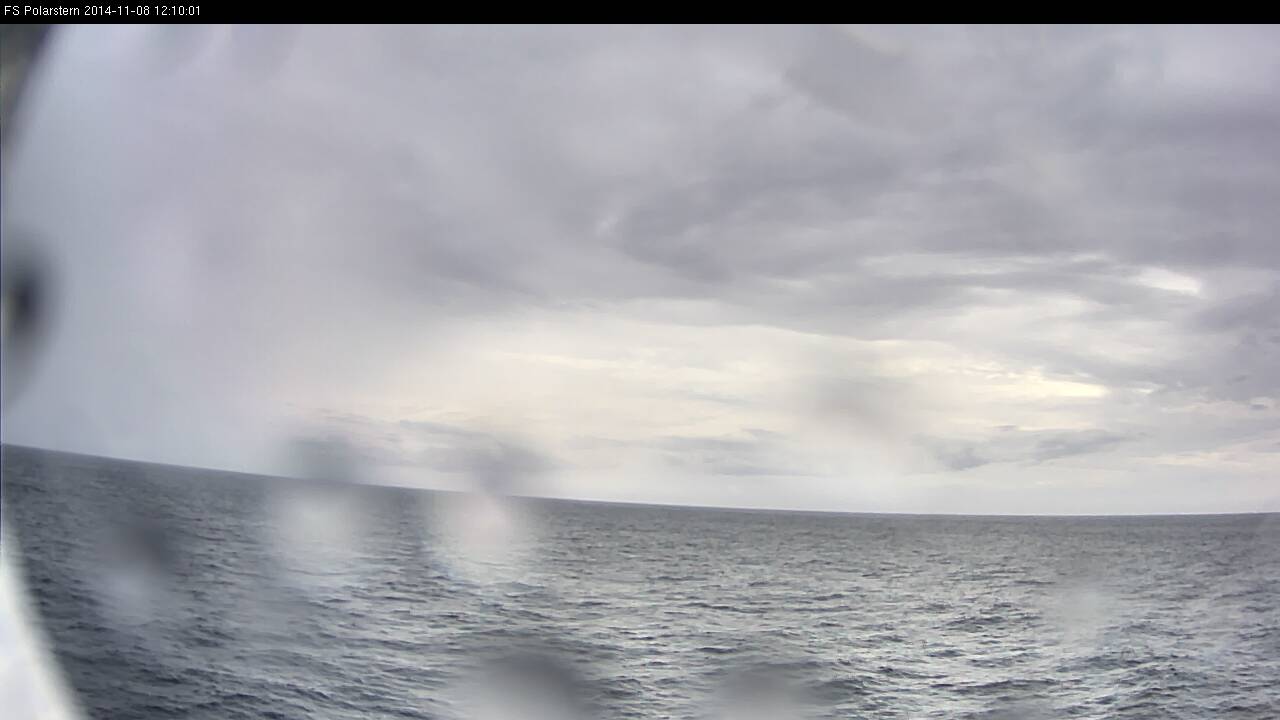
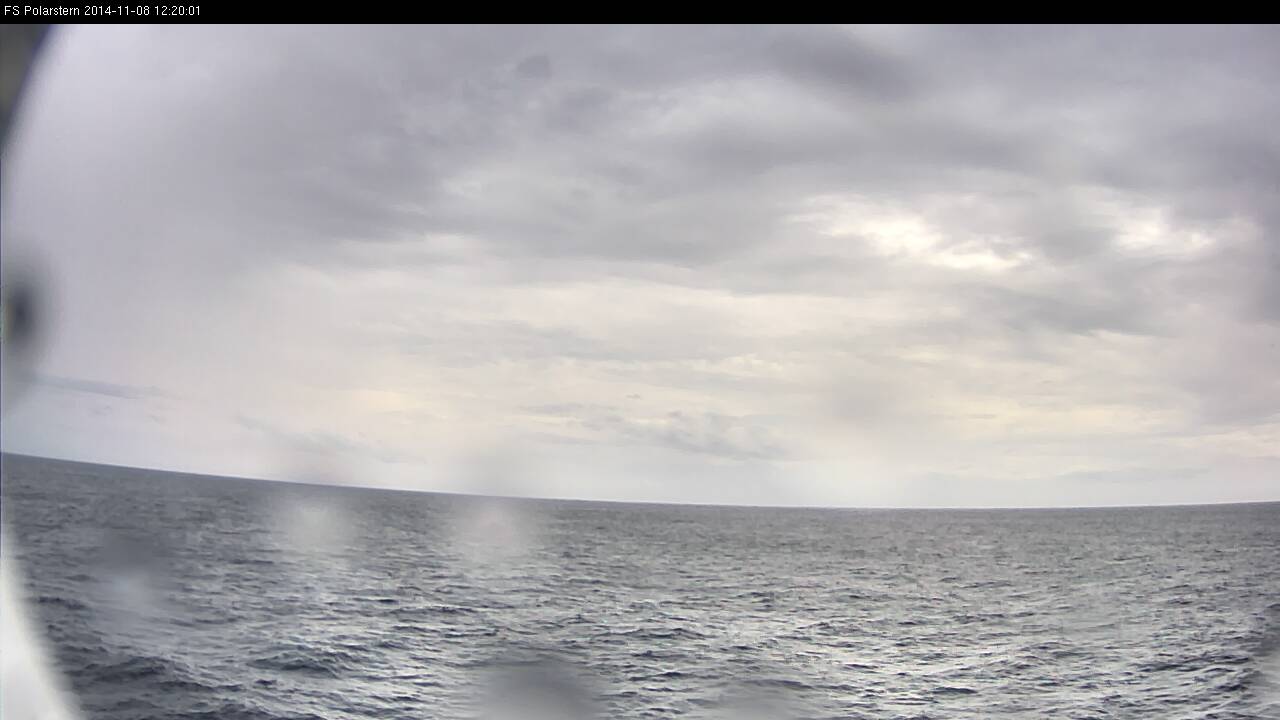
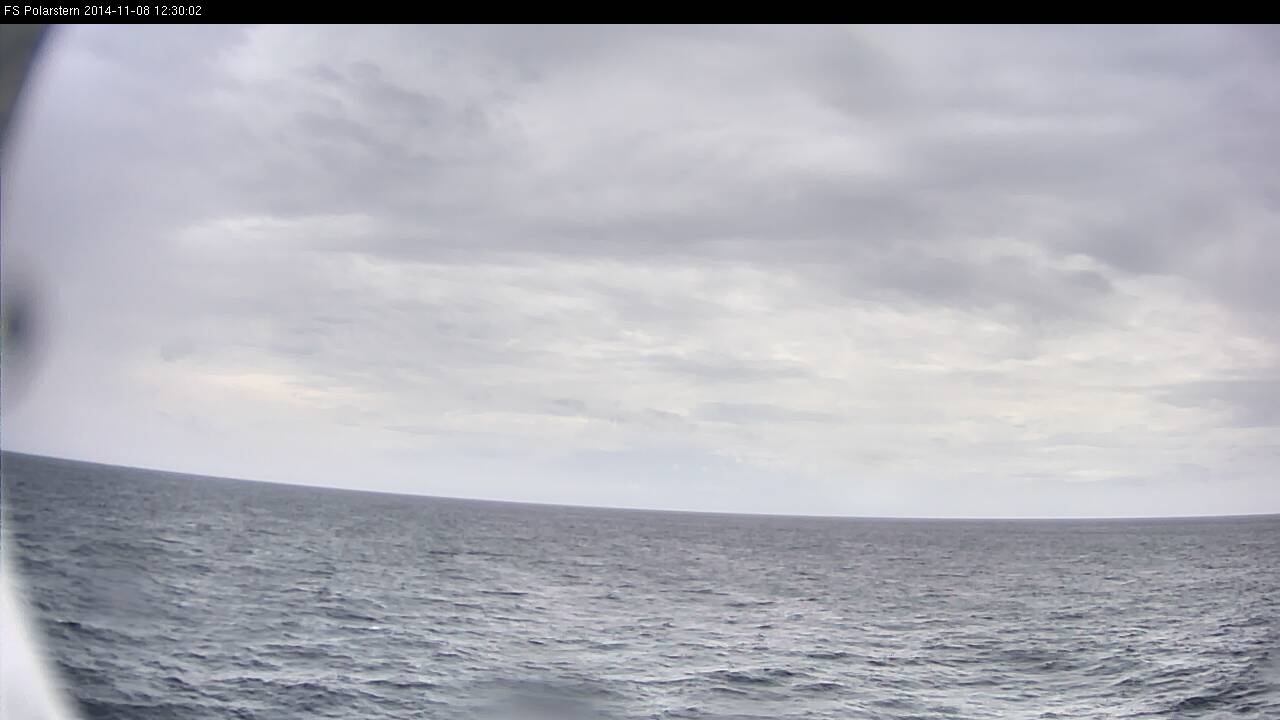
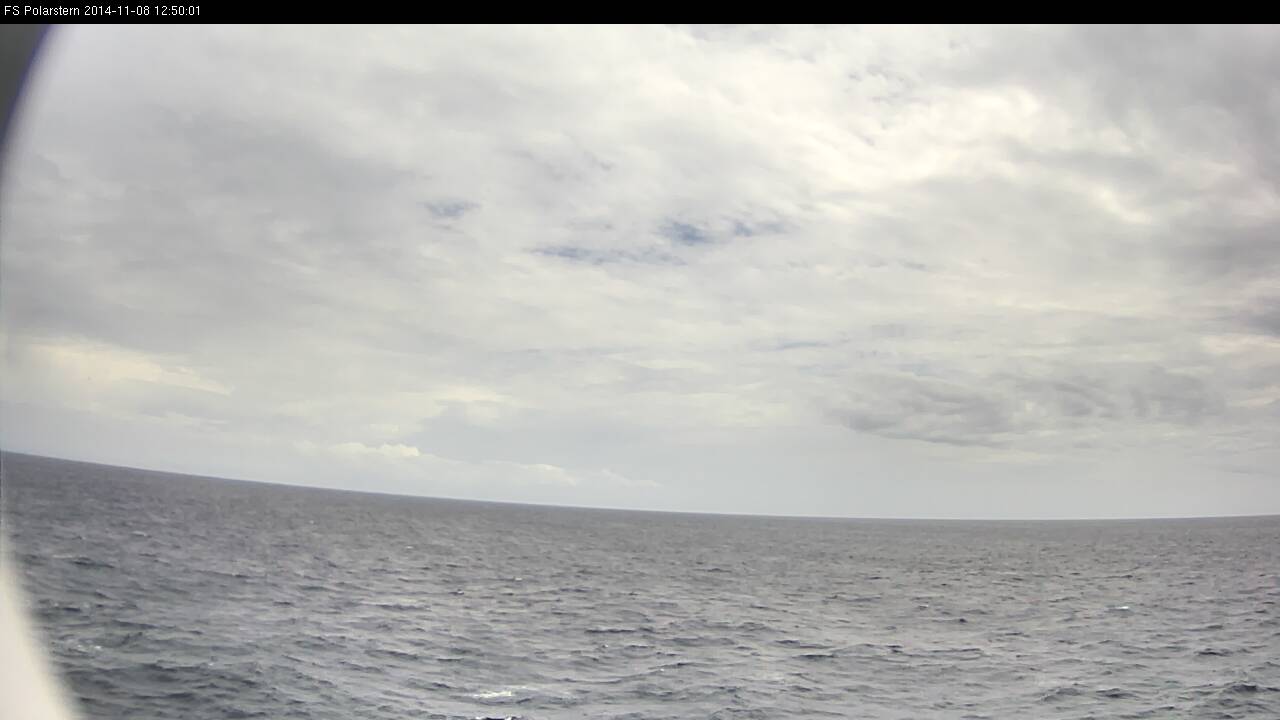
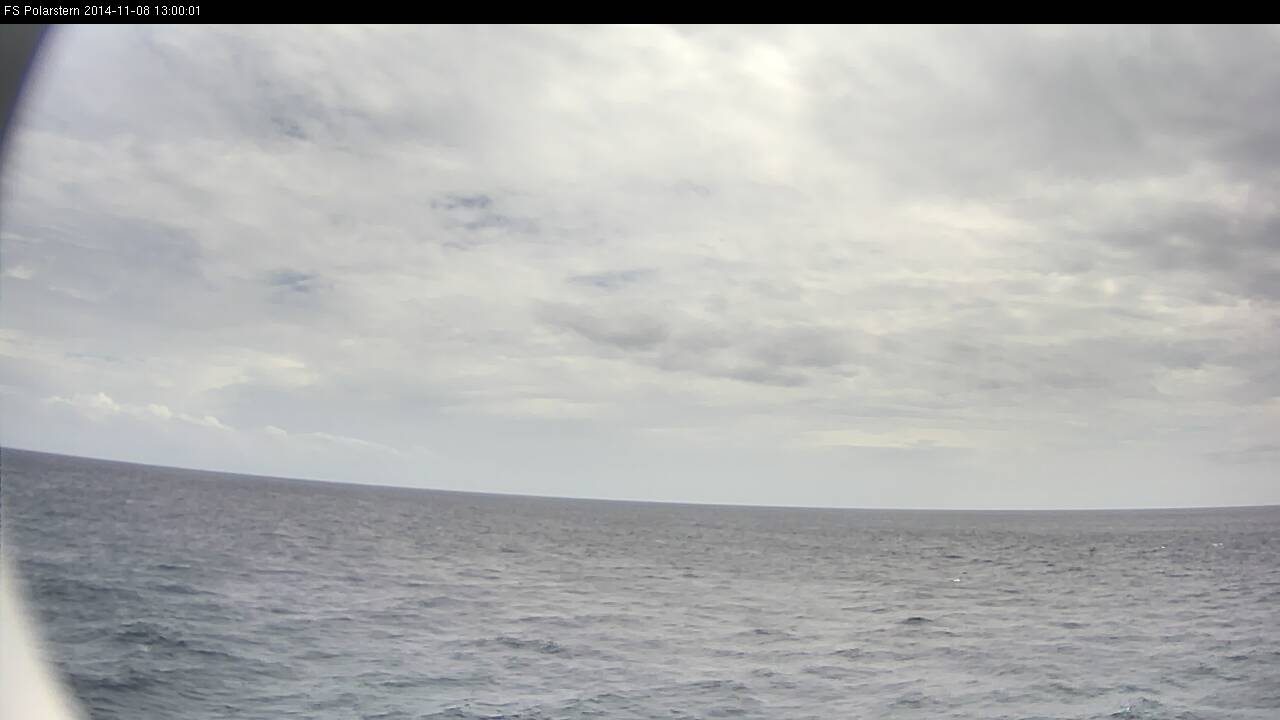
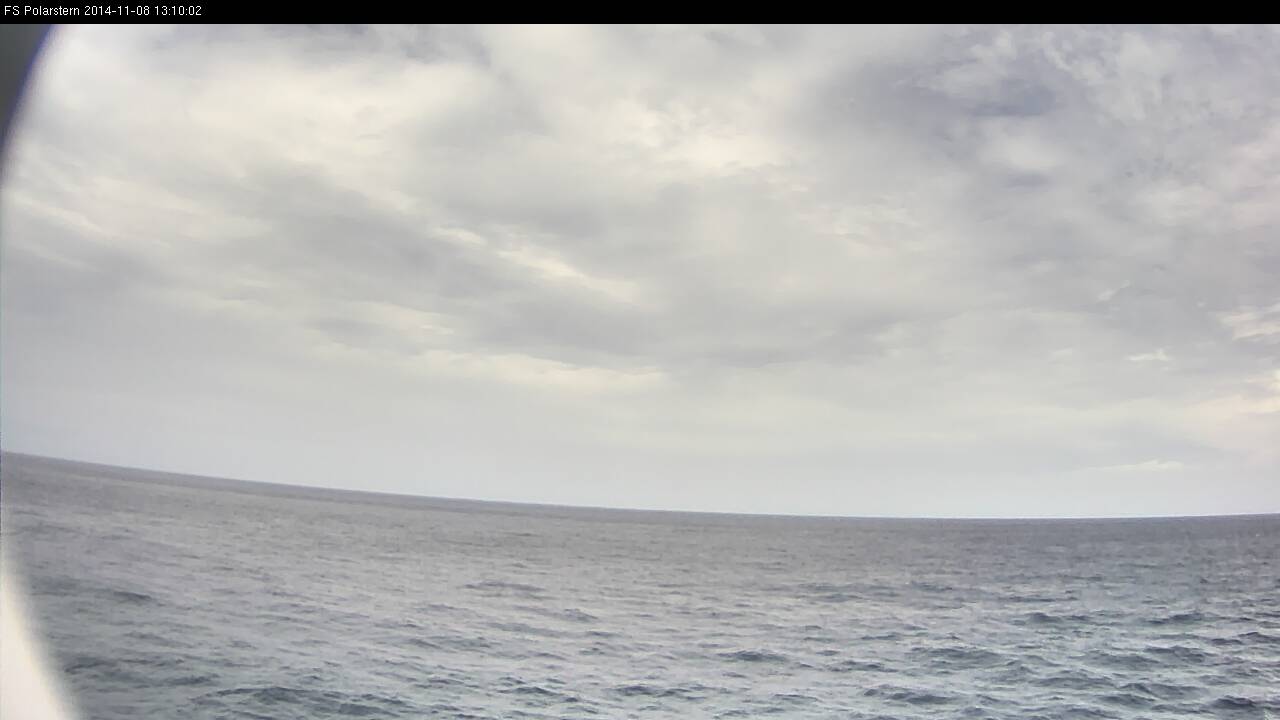
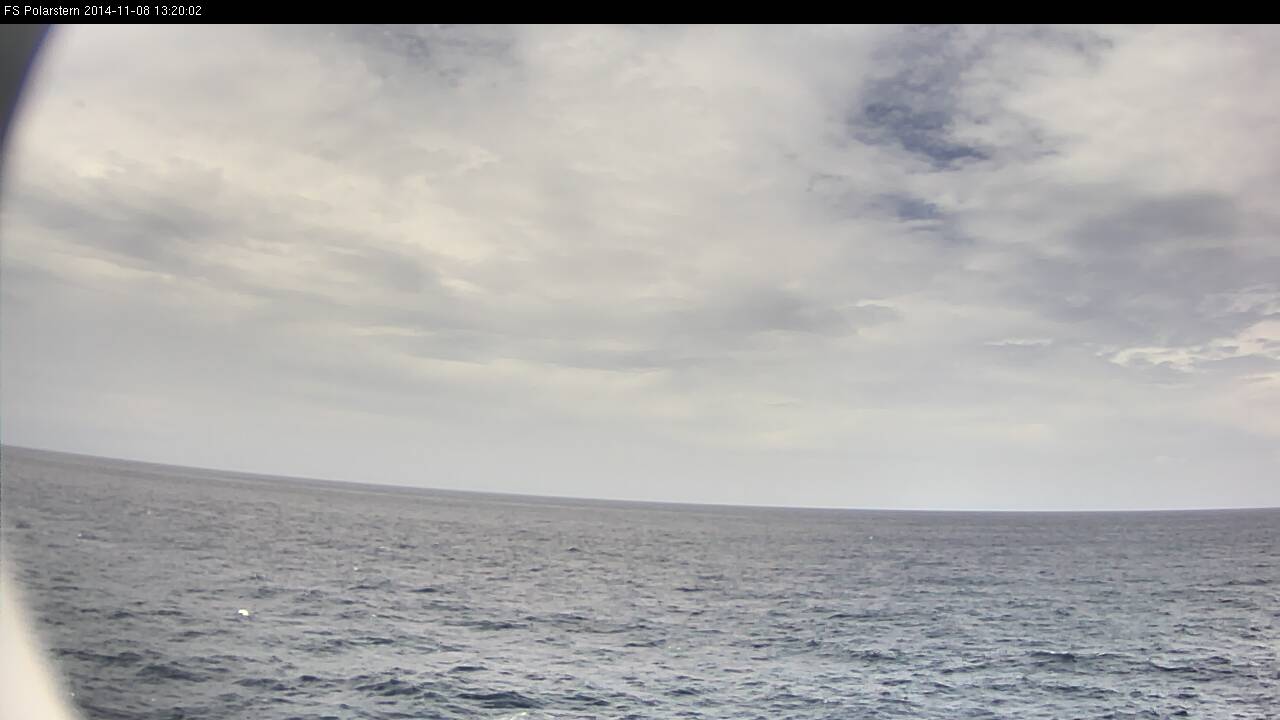
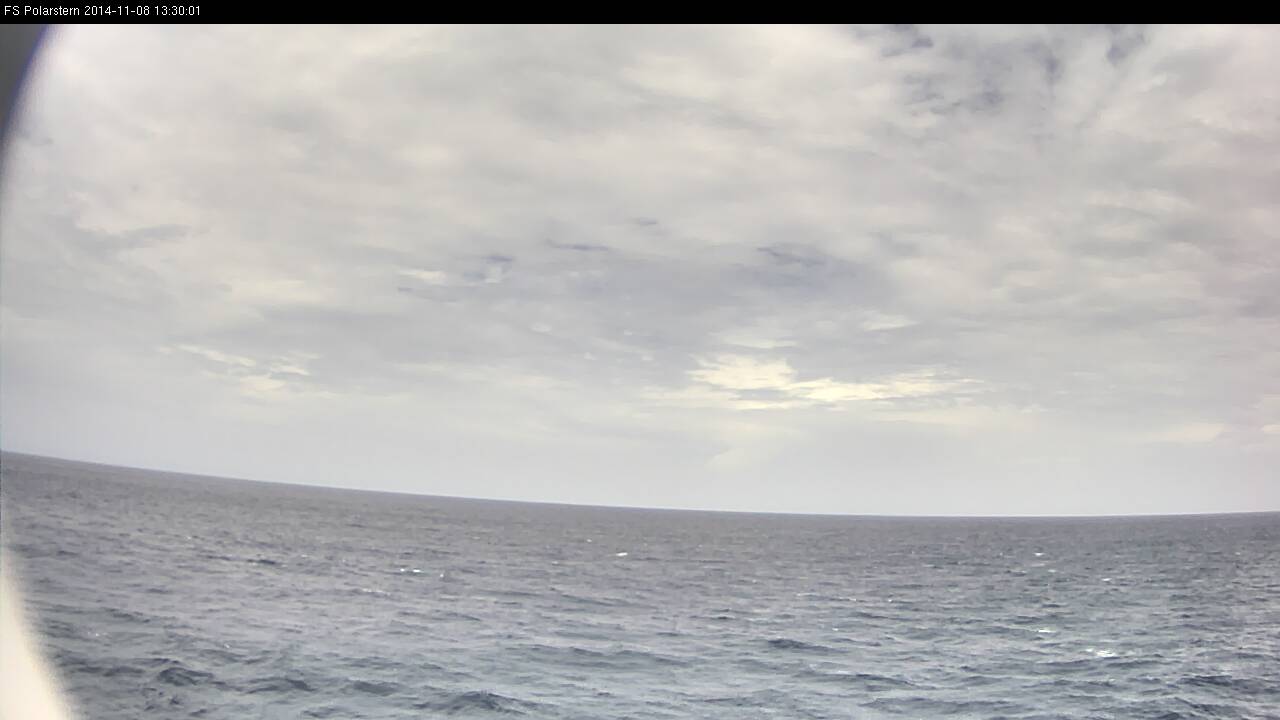
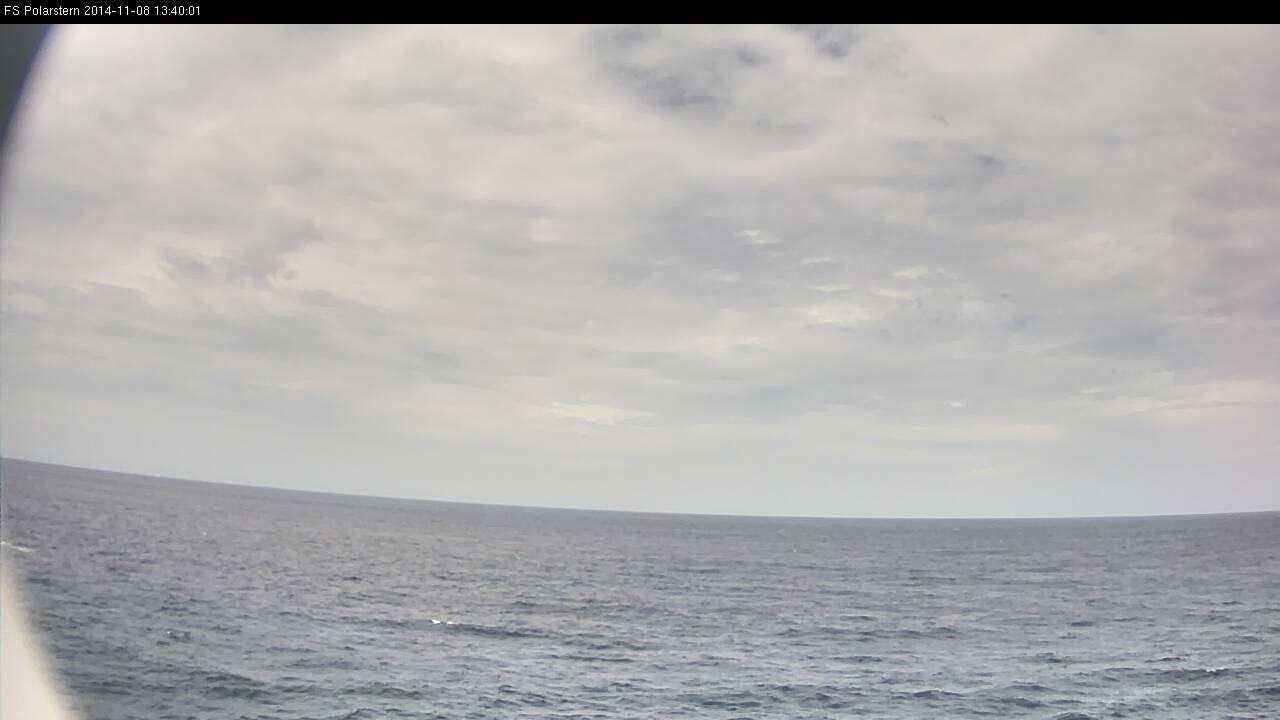
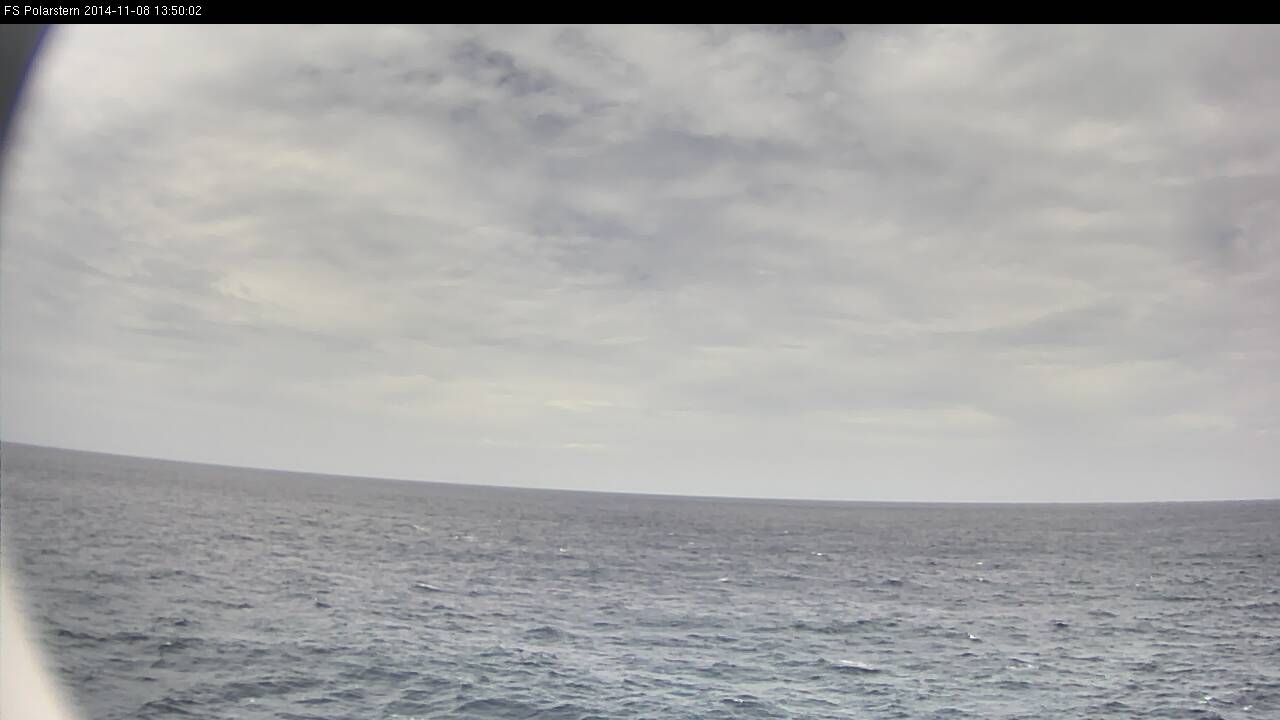
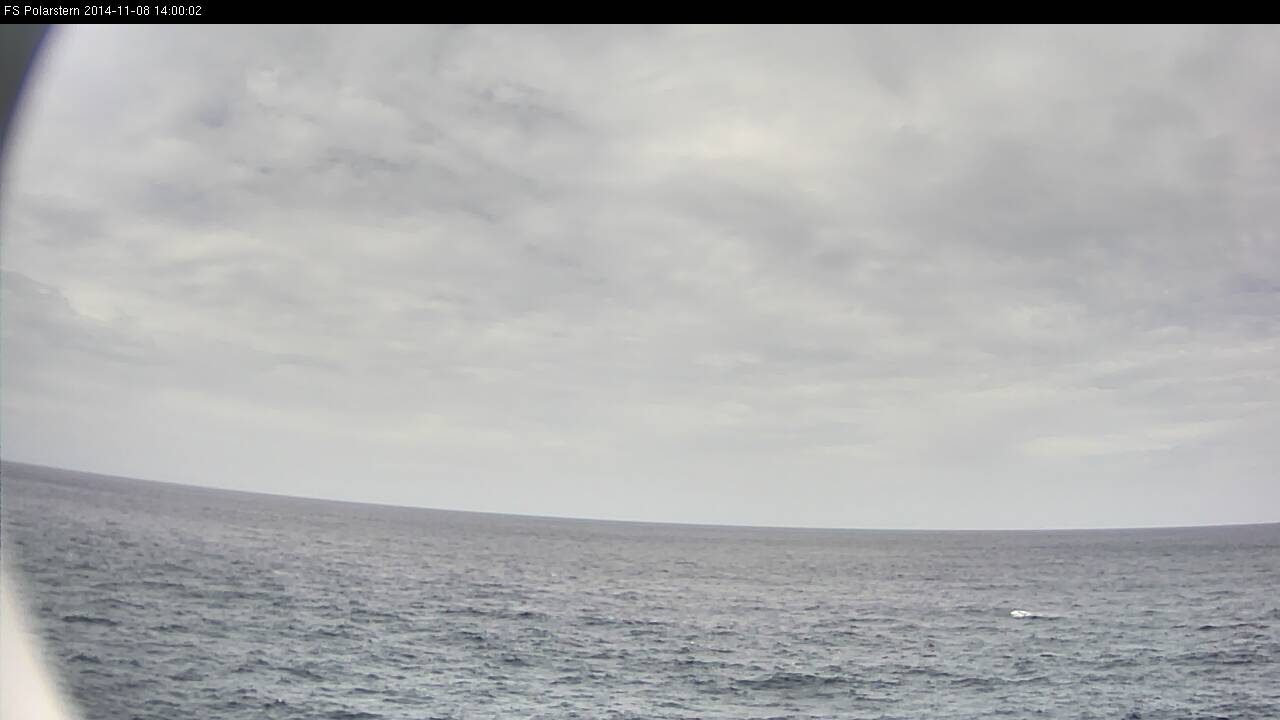
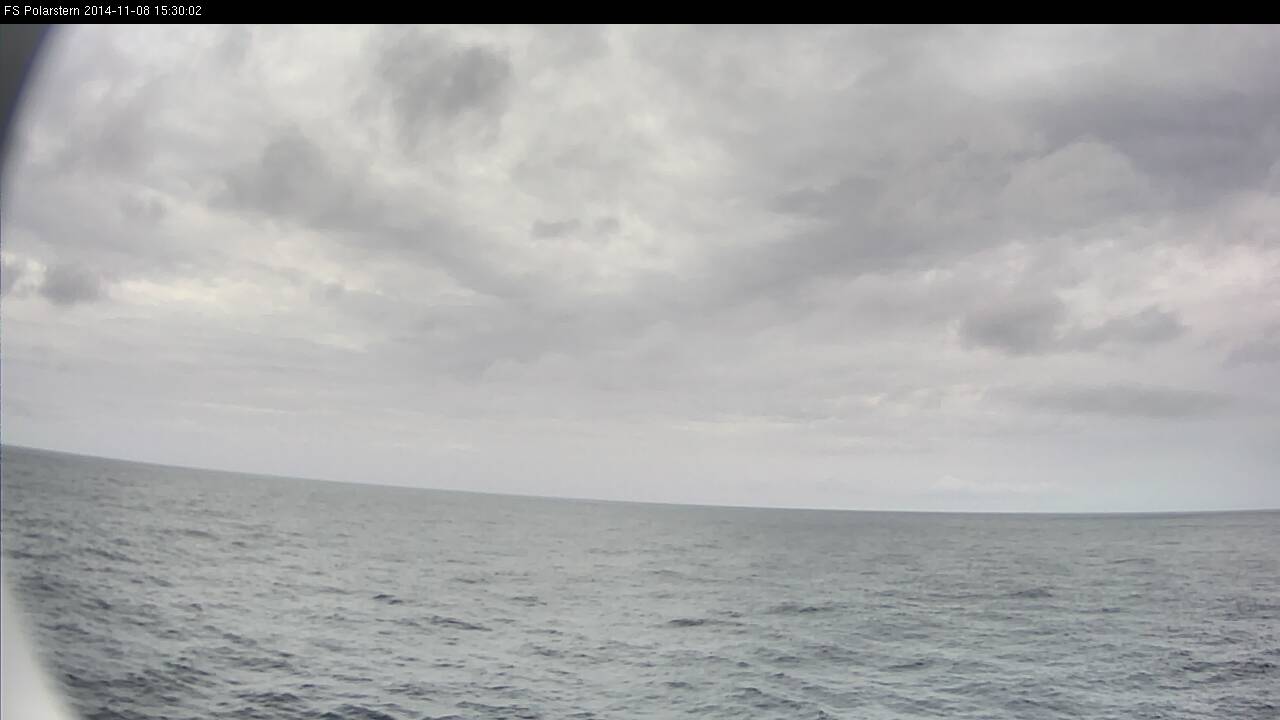
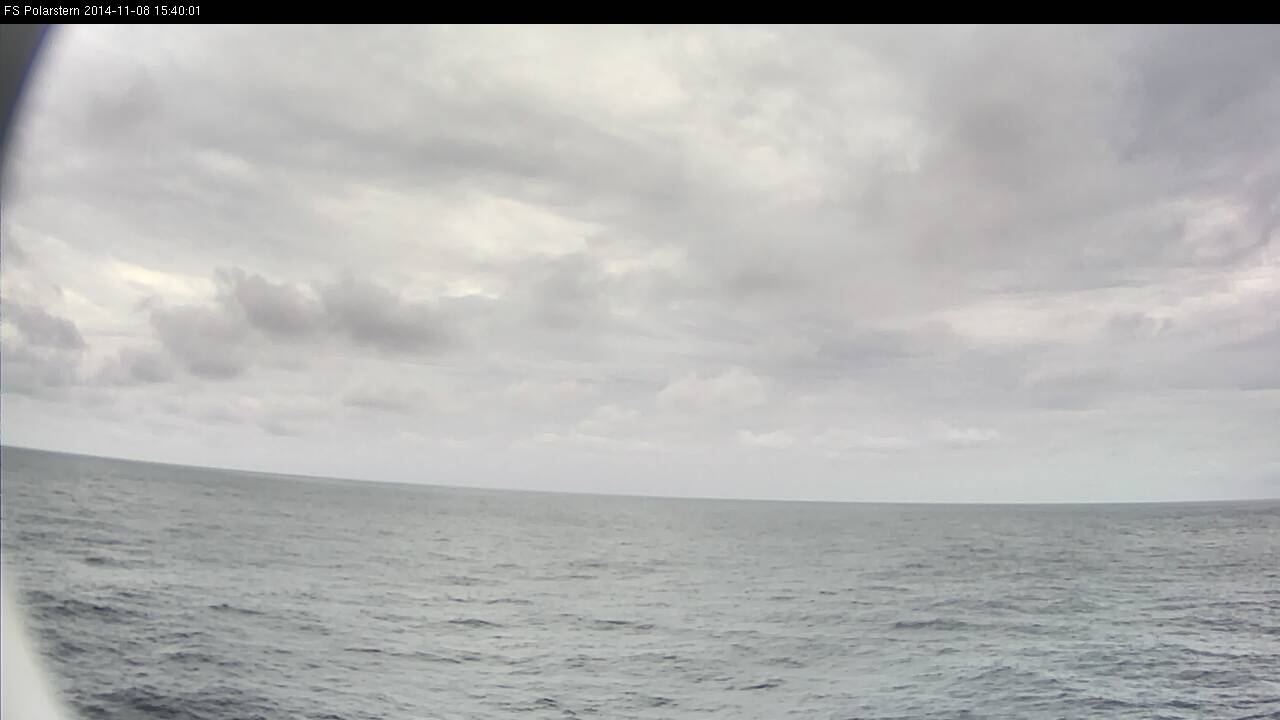
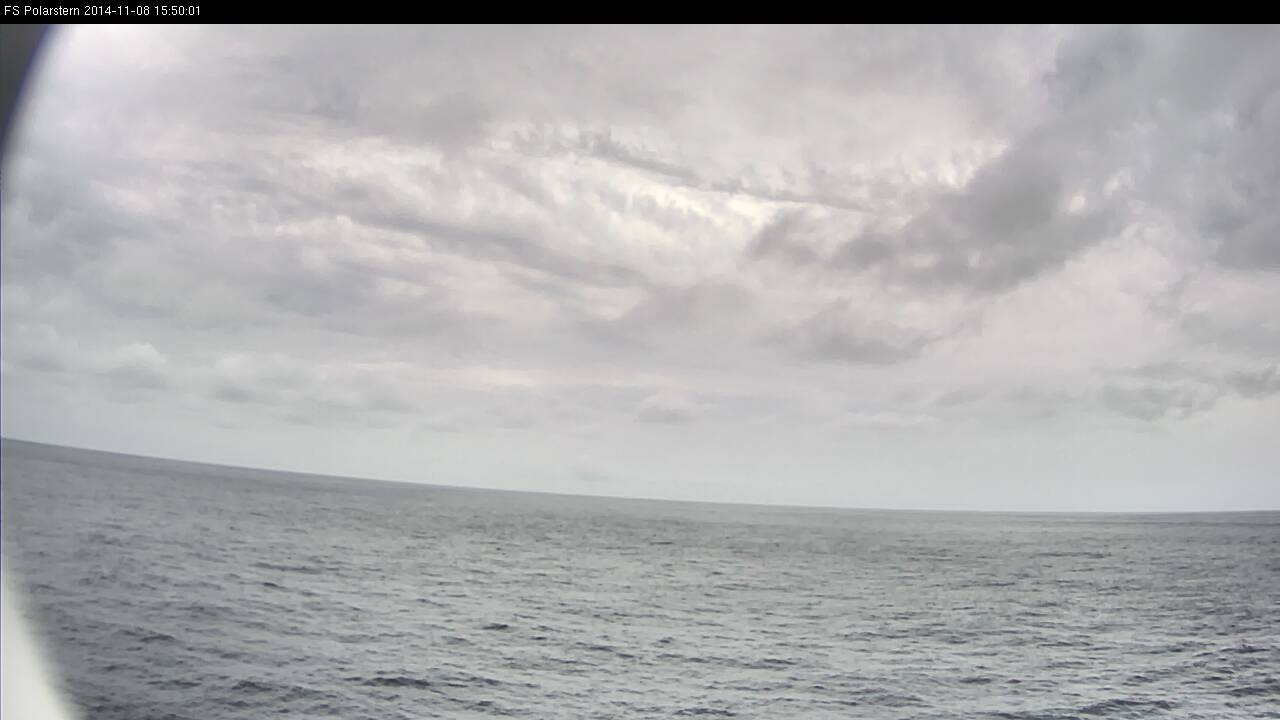
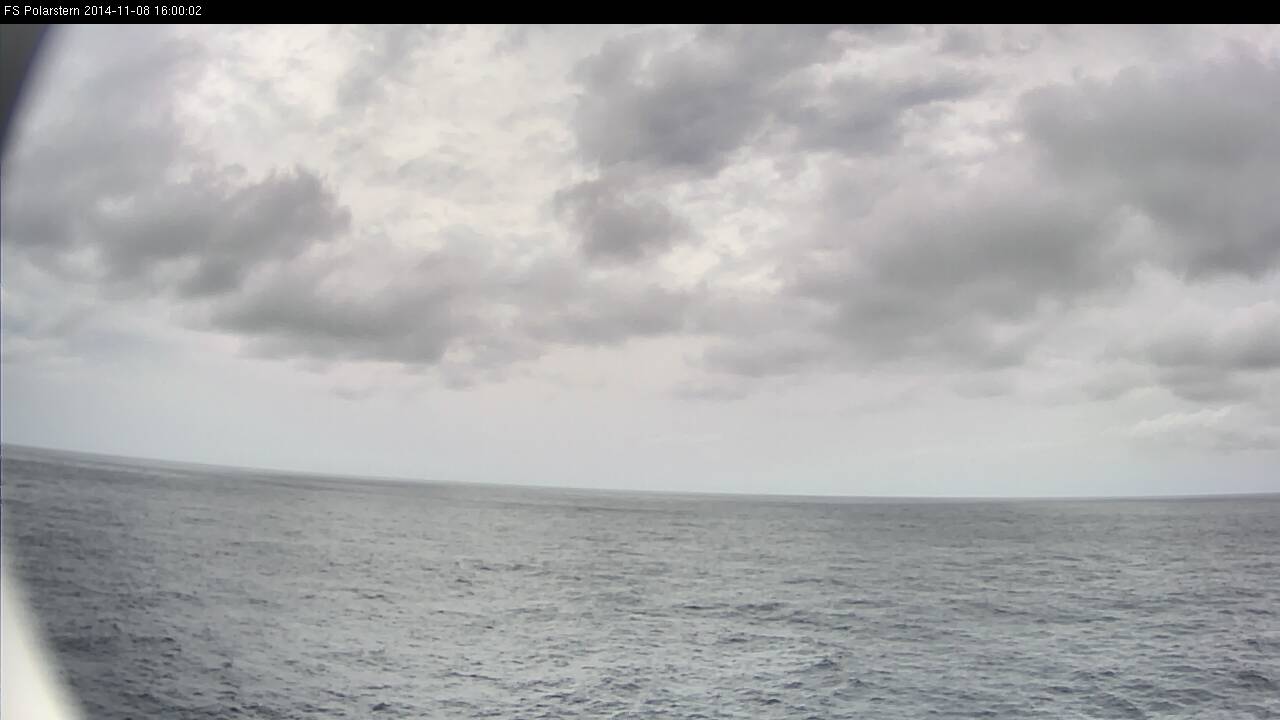
In the following images you can see the approaching cumulonimbus and arcus from the webcam between 11:00 UTC and 13:00 UTC.
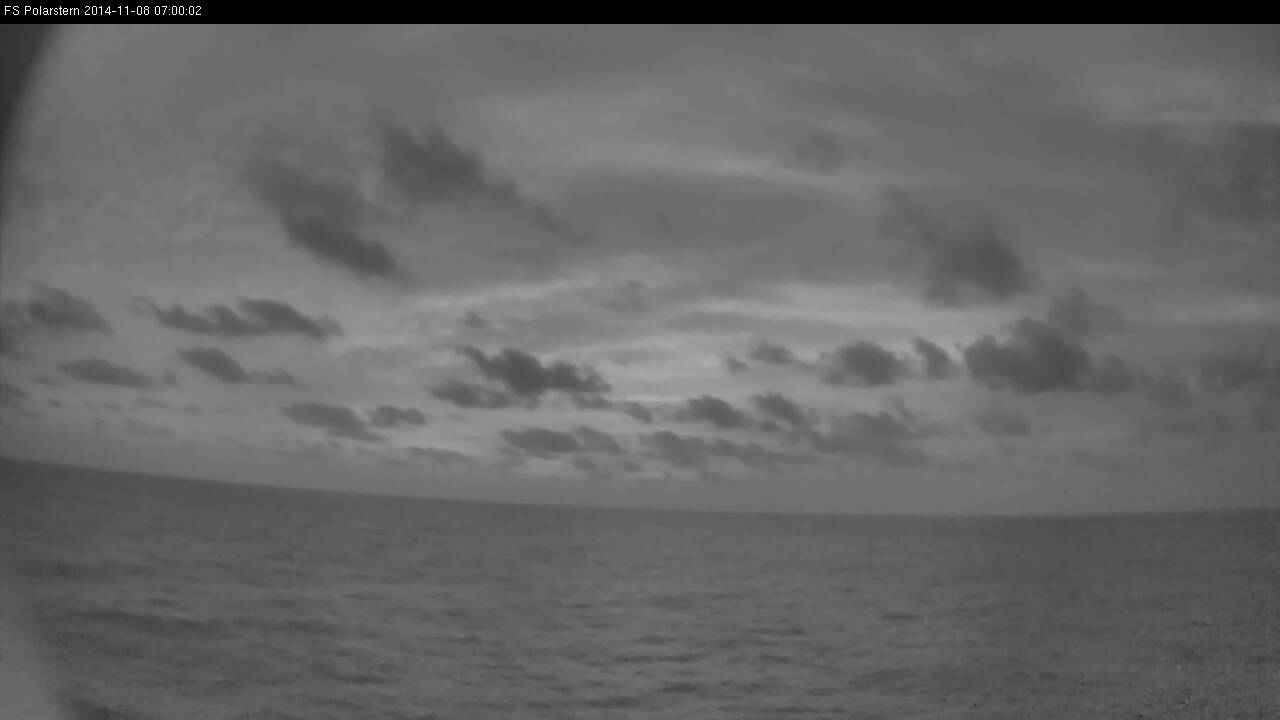
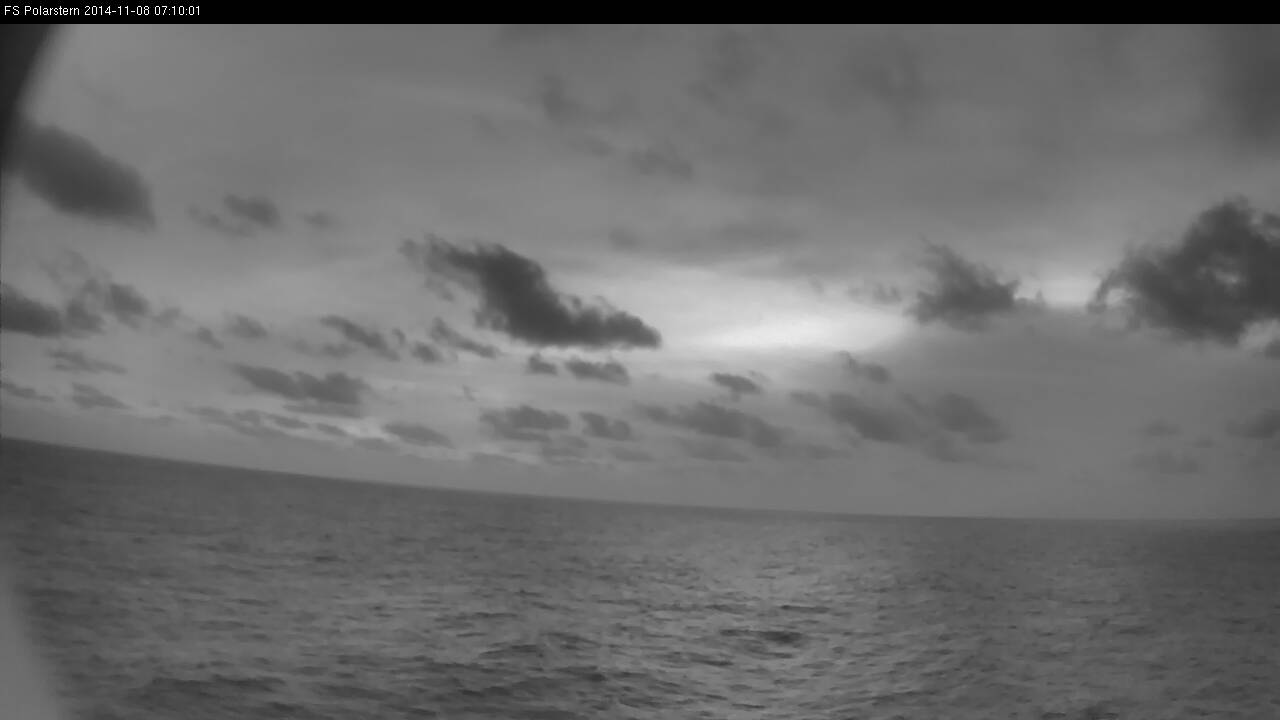
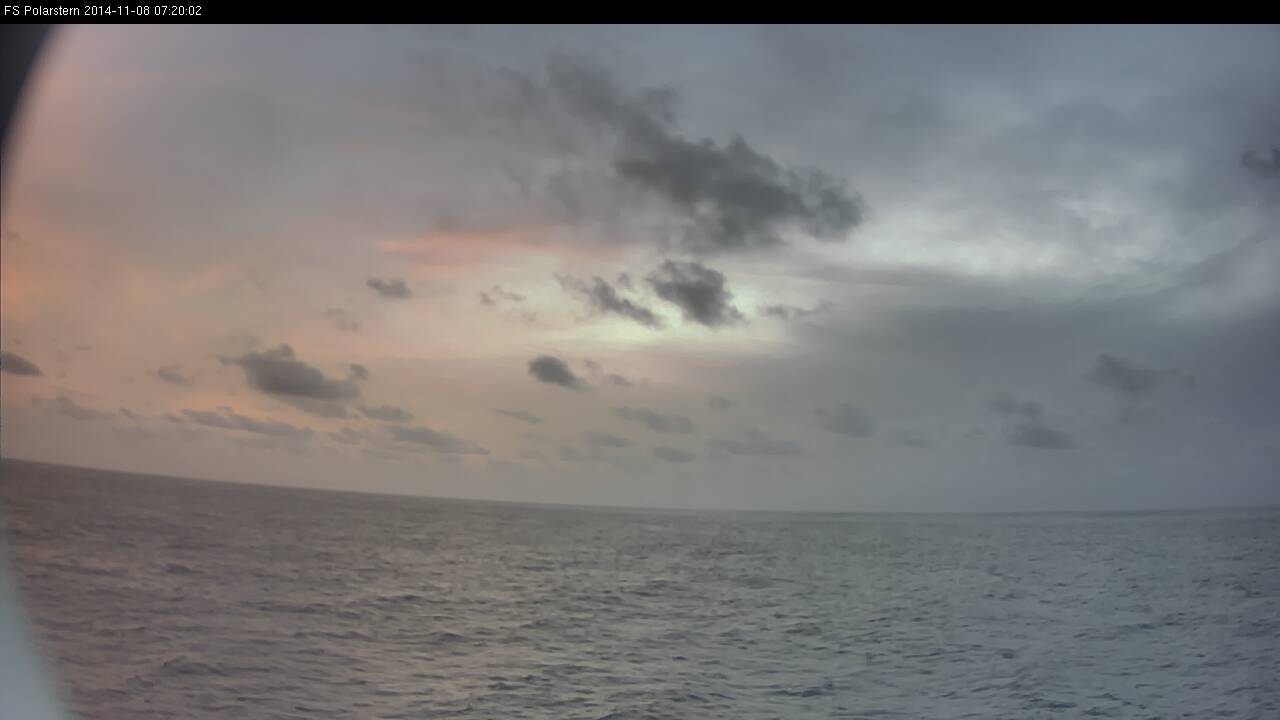
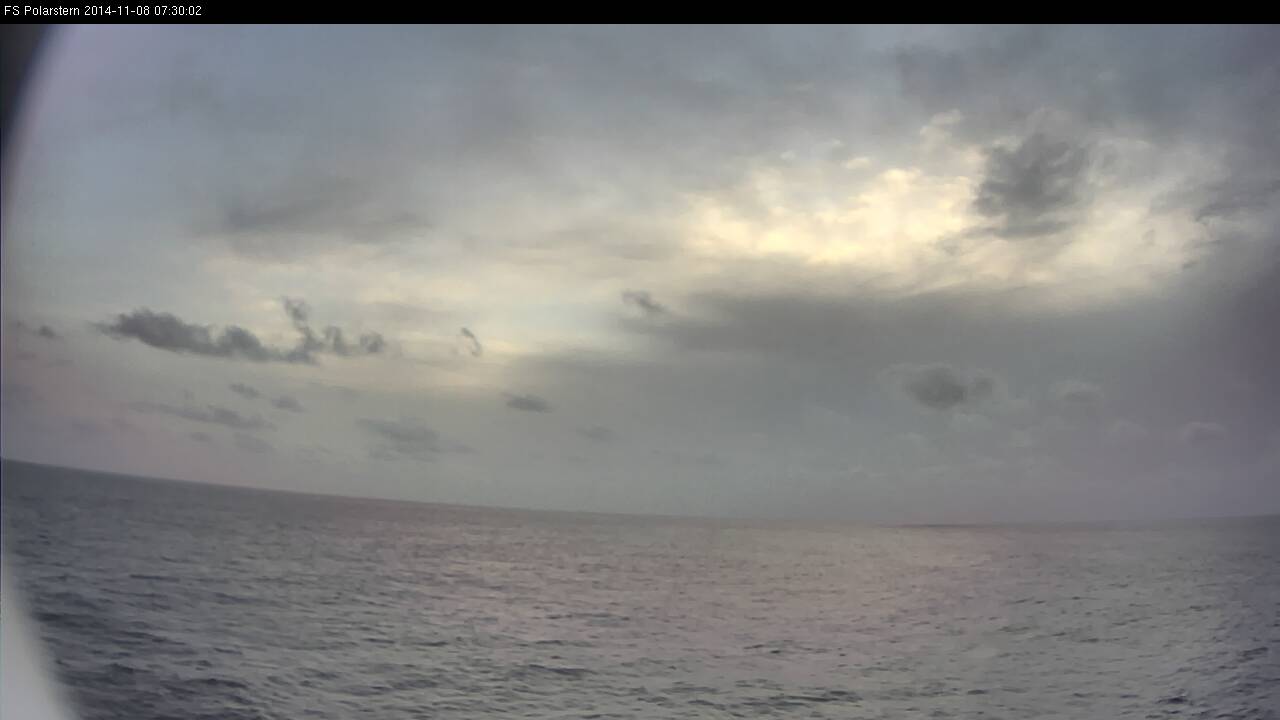
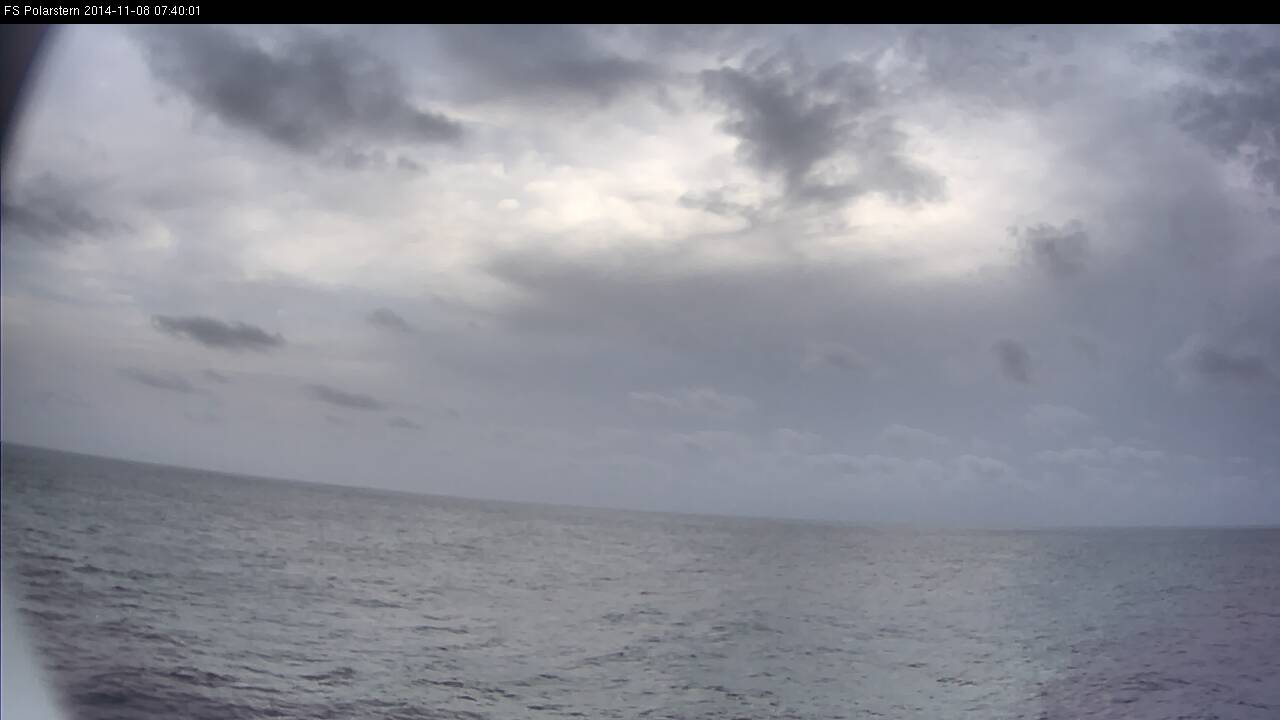
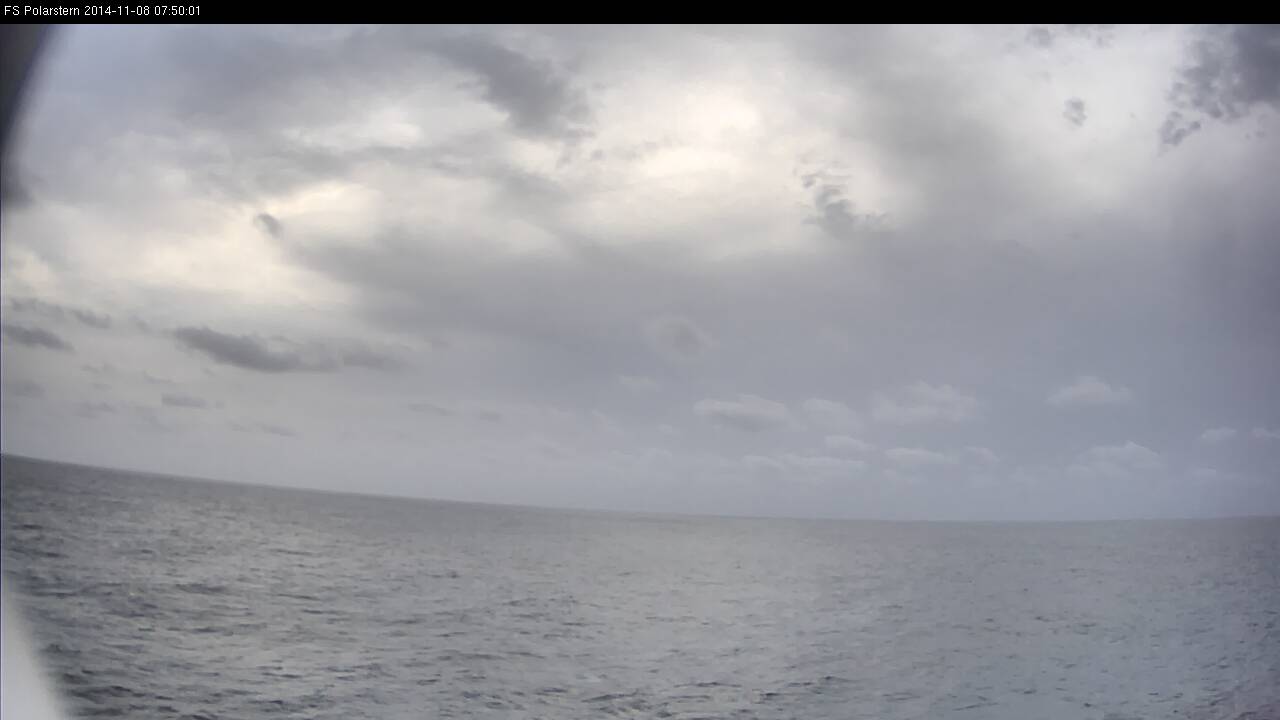
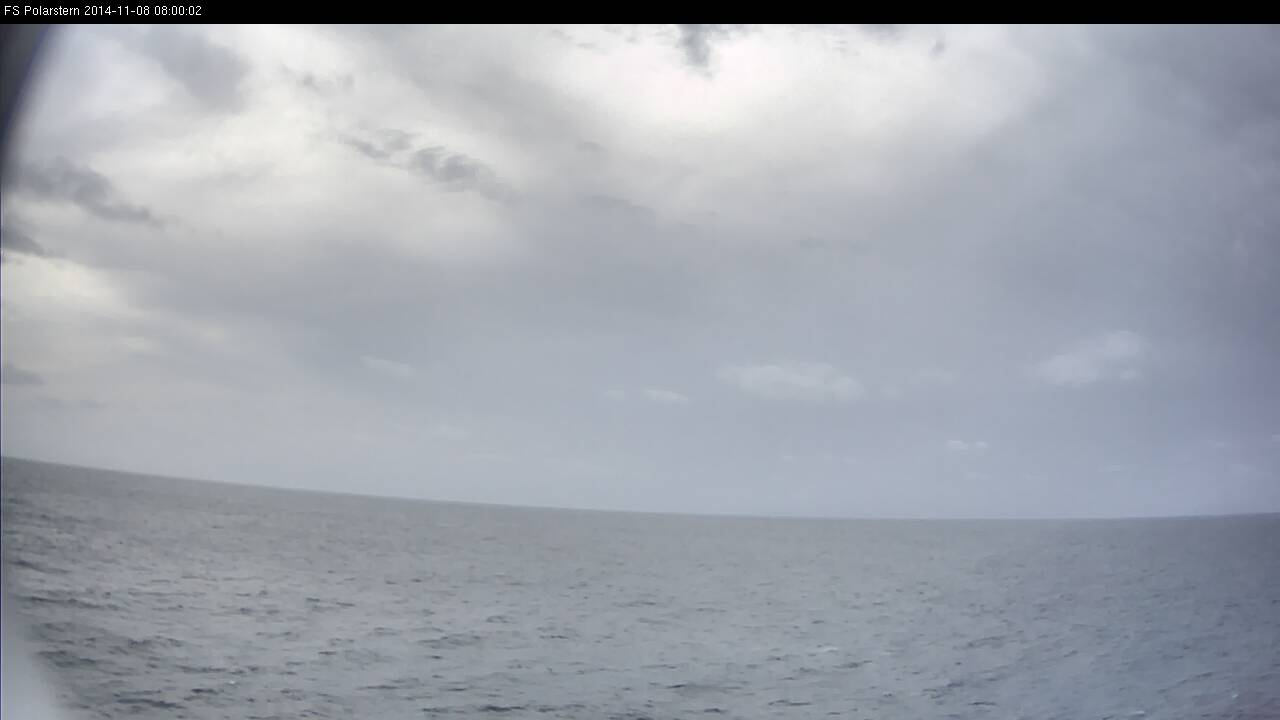
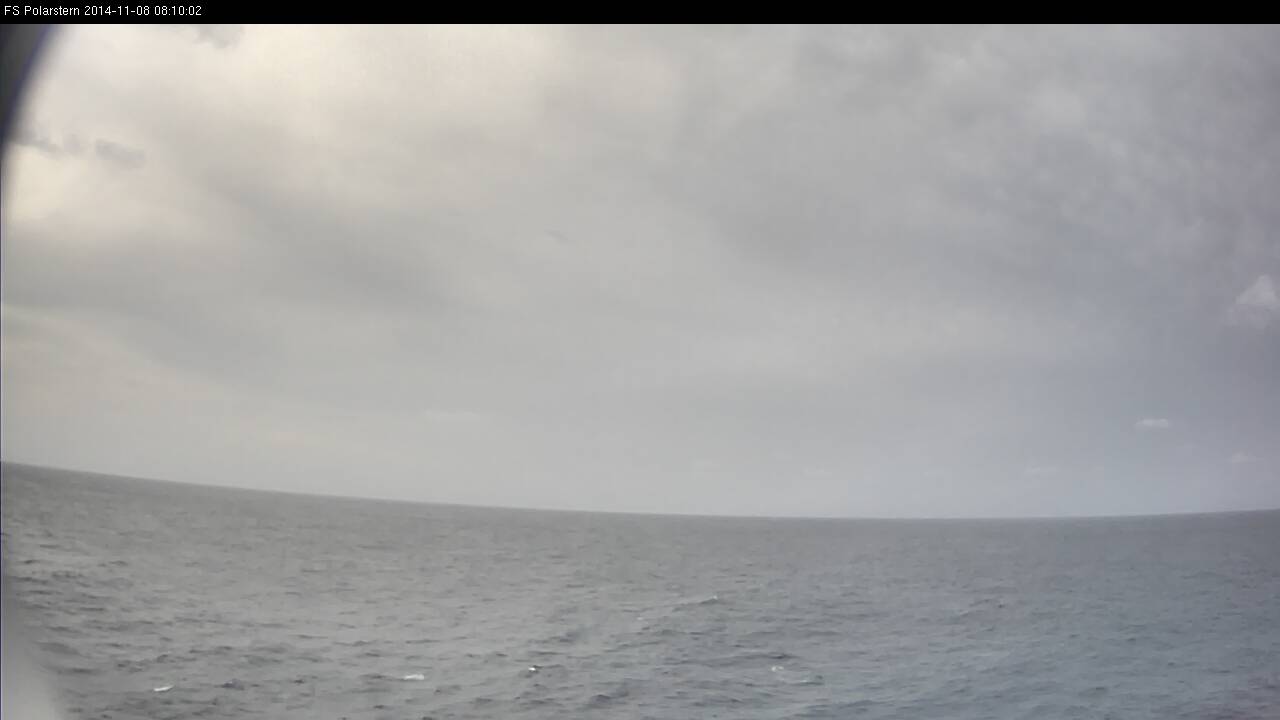
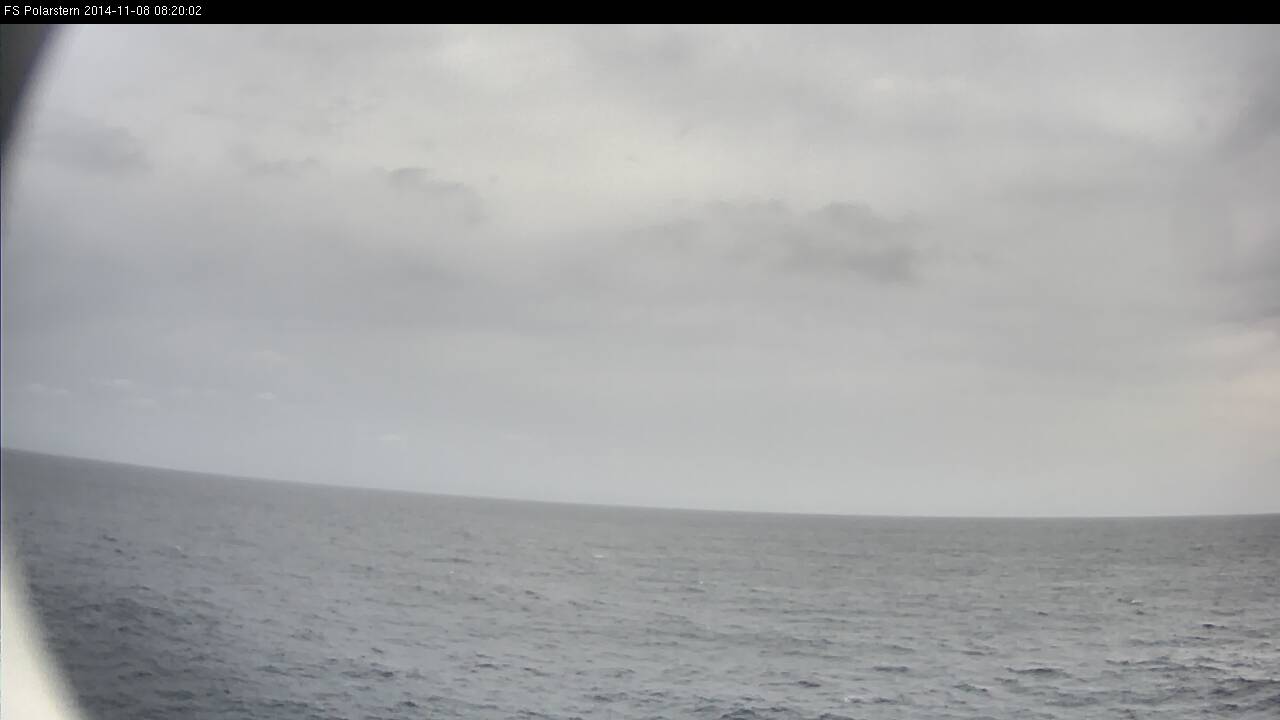
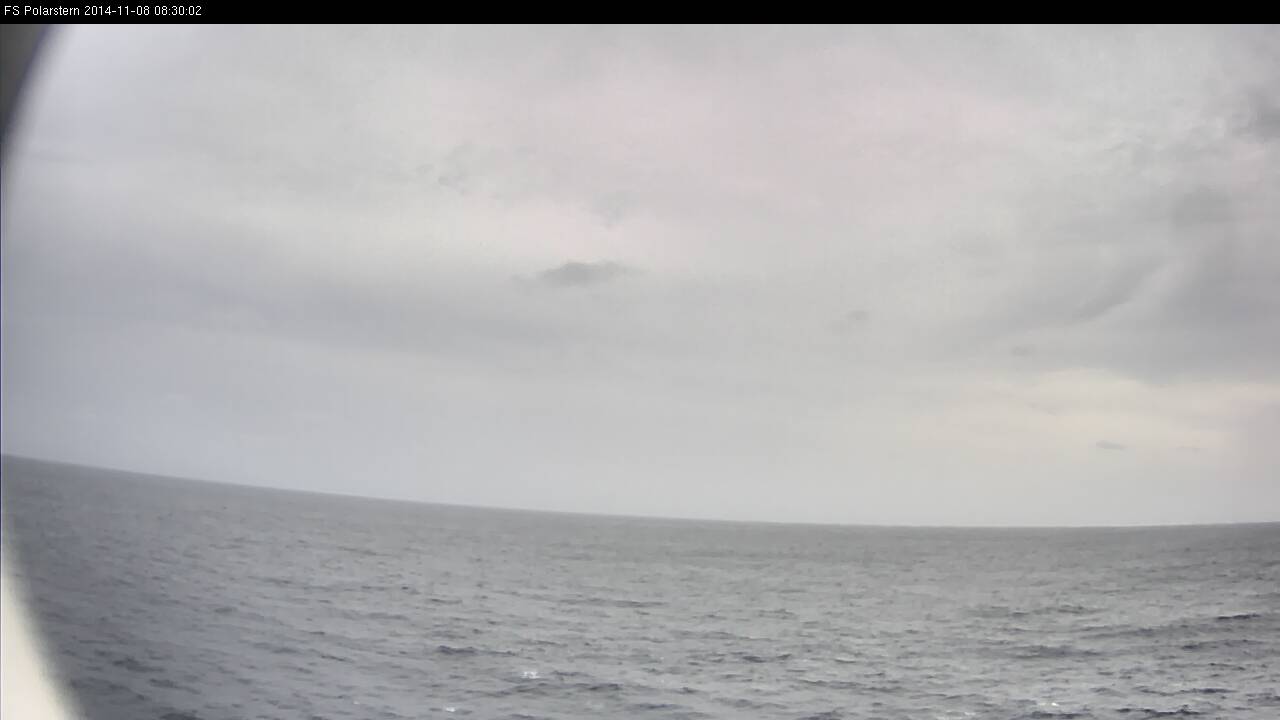
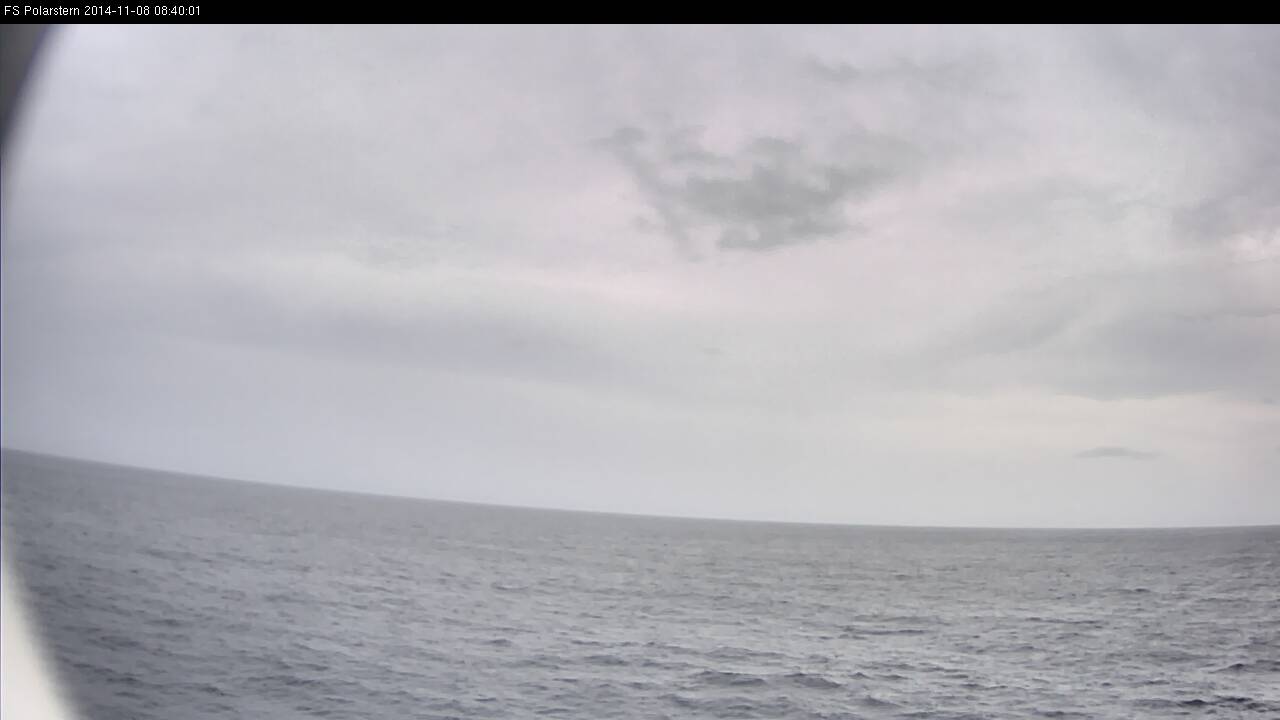
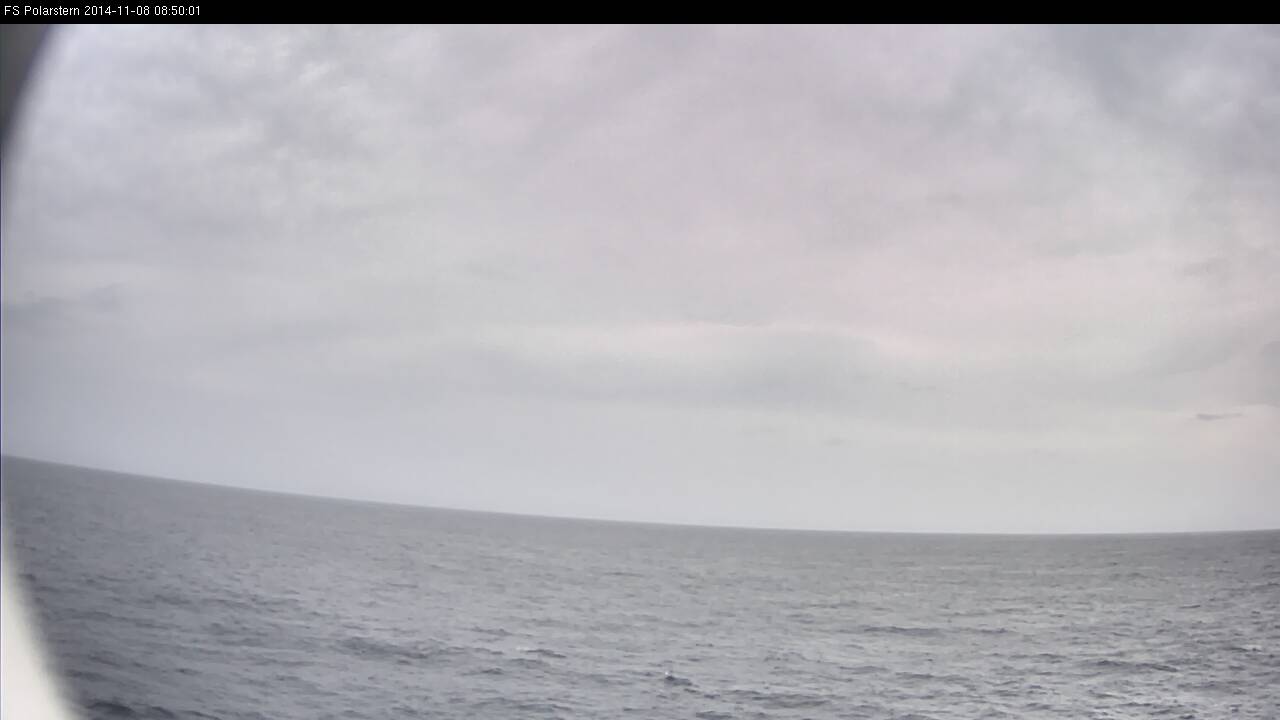
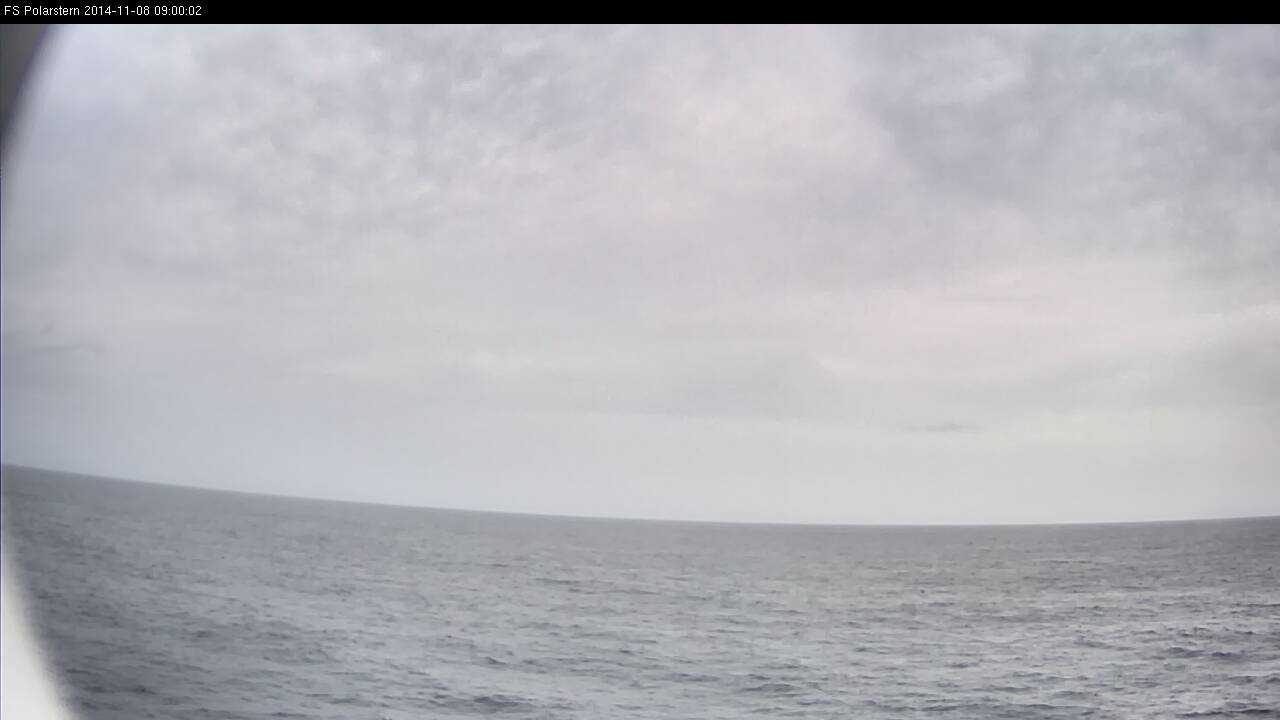
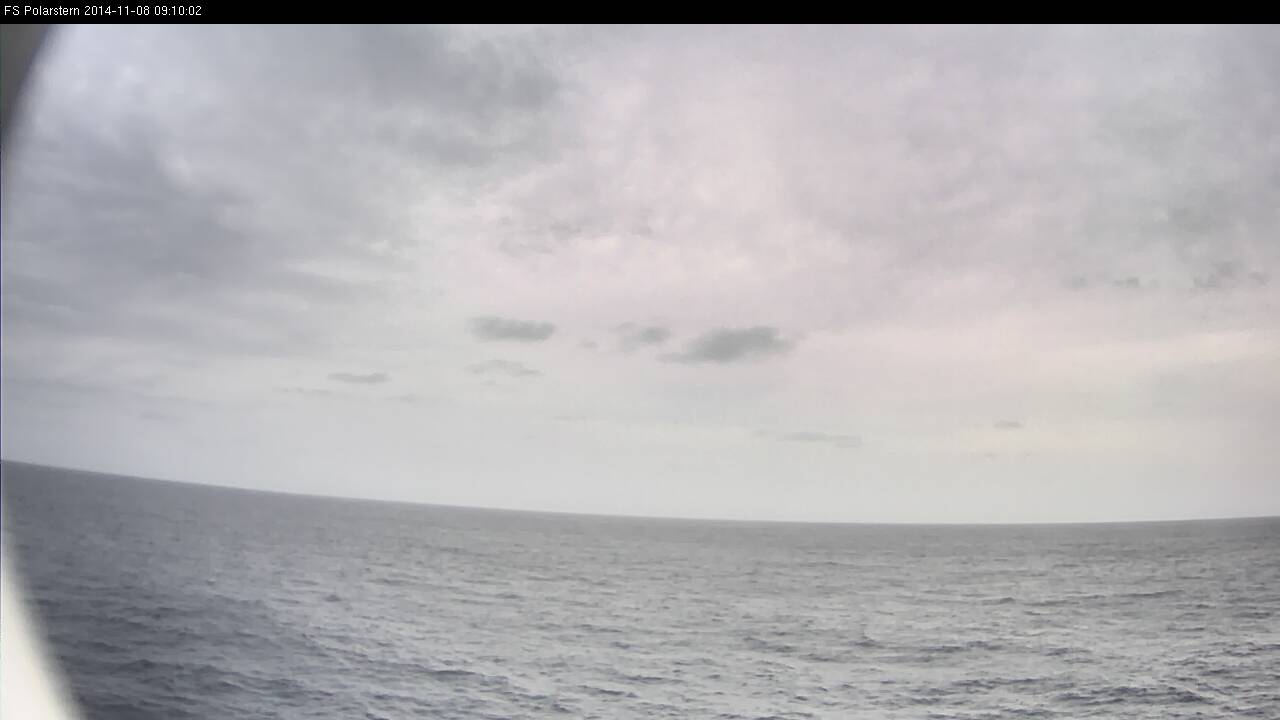
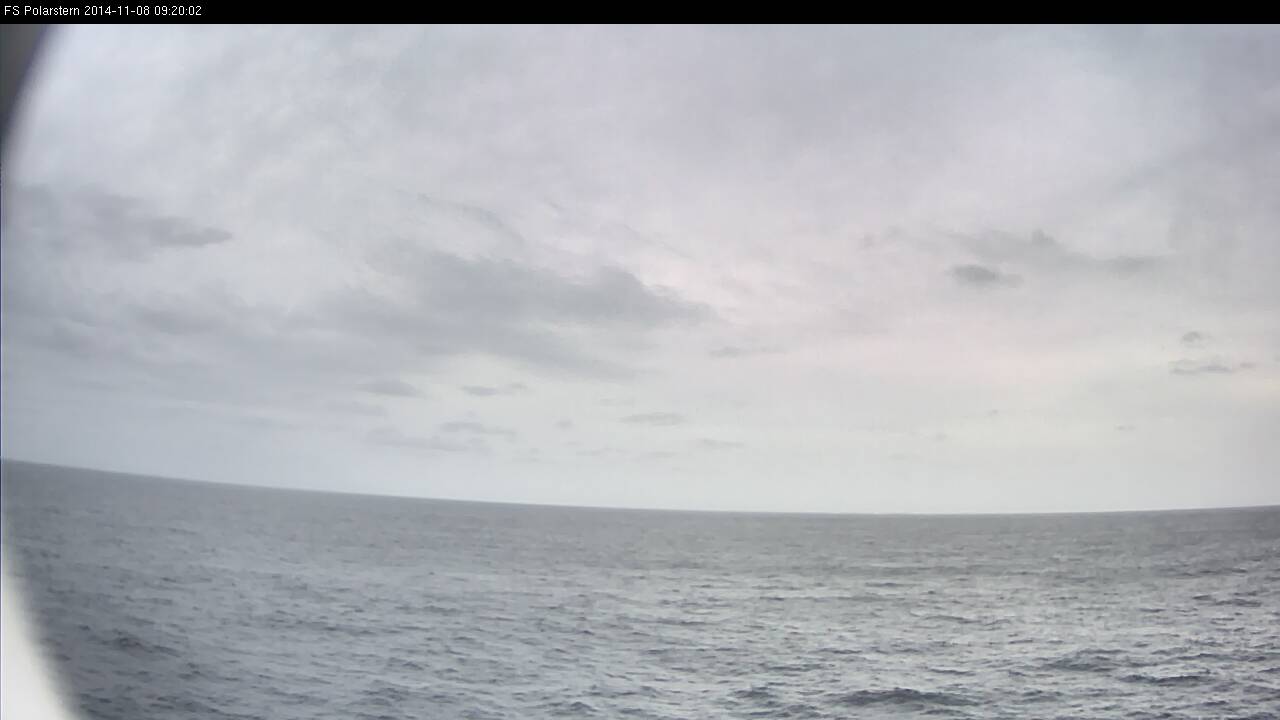
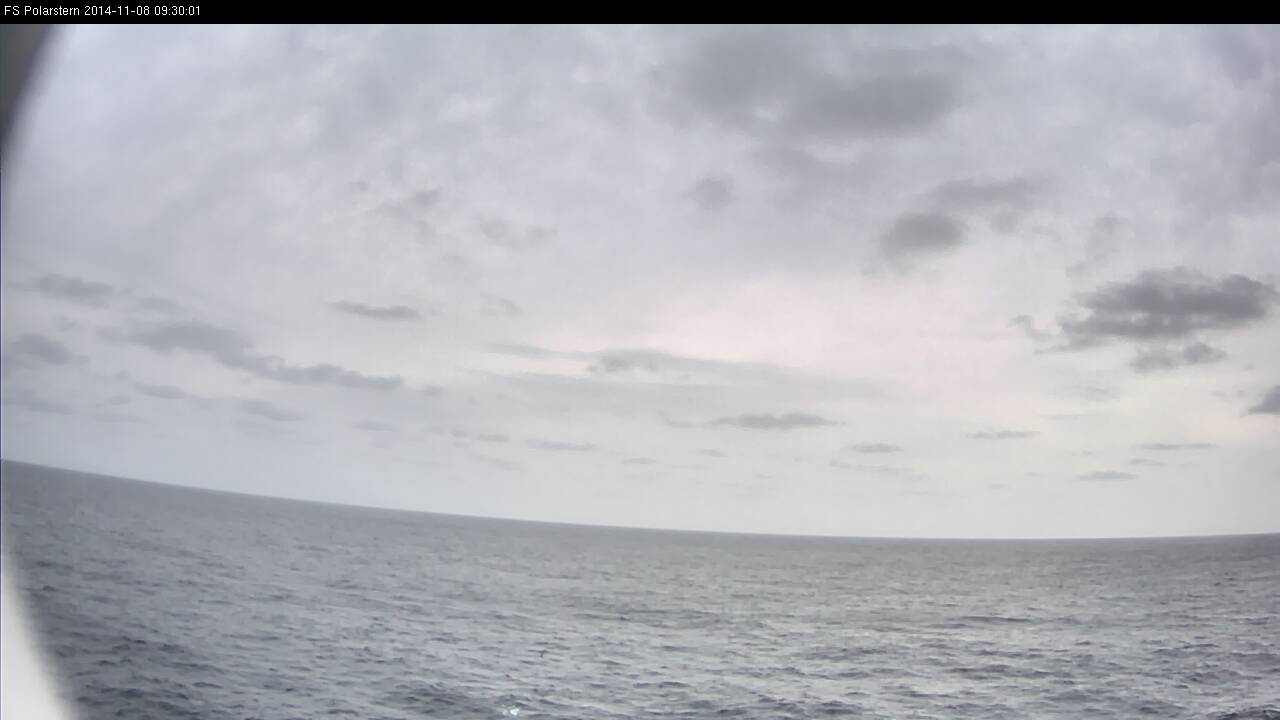
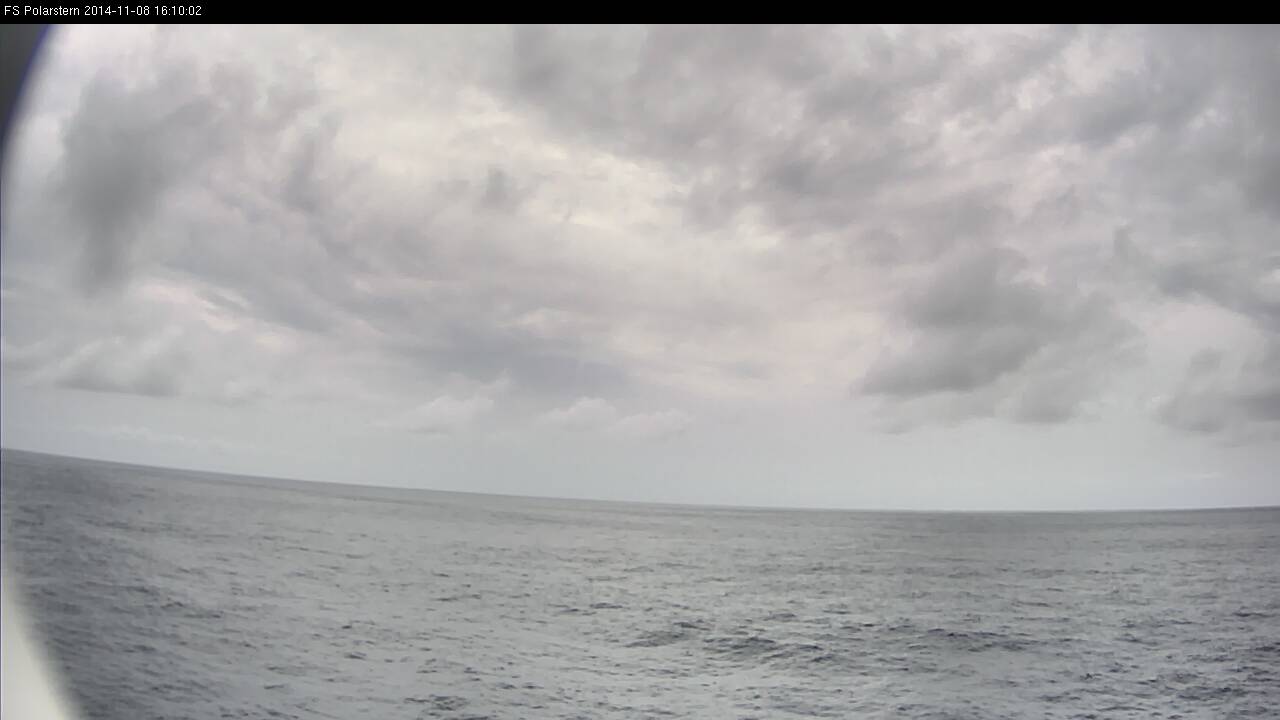
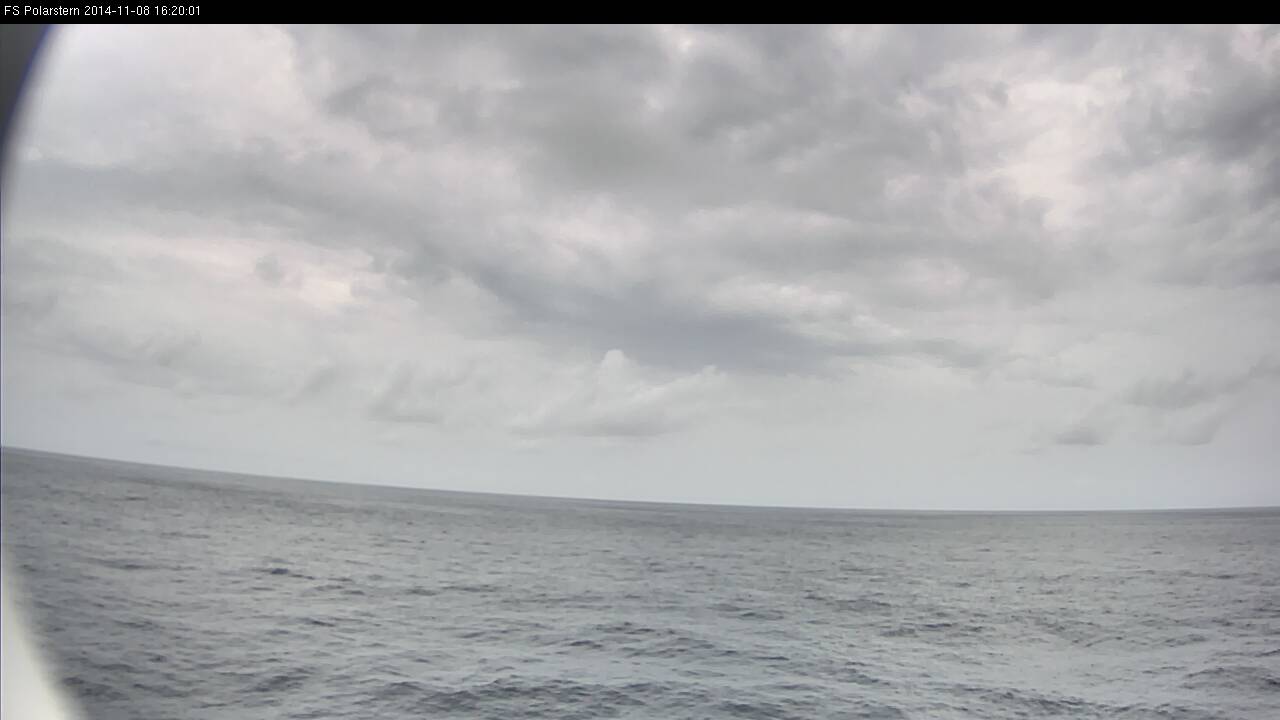
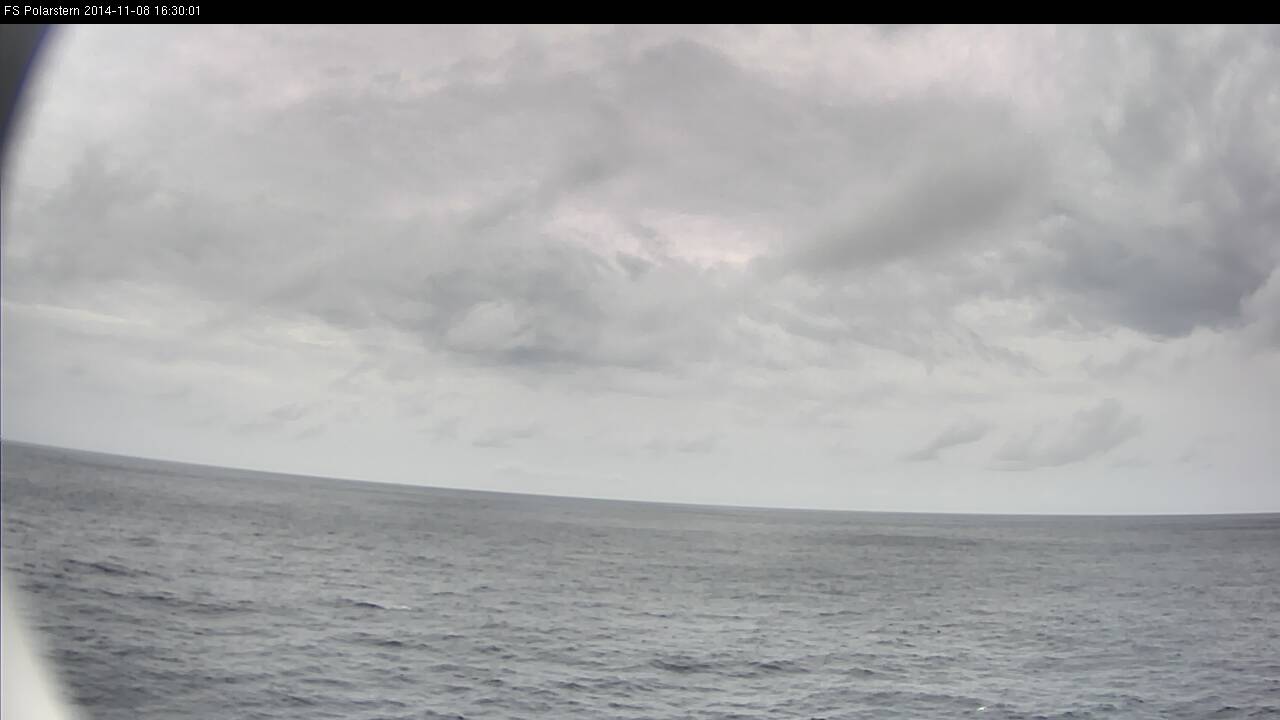
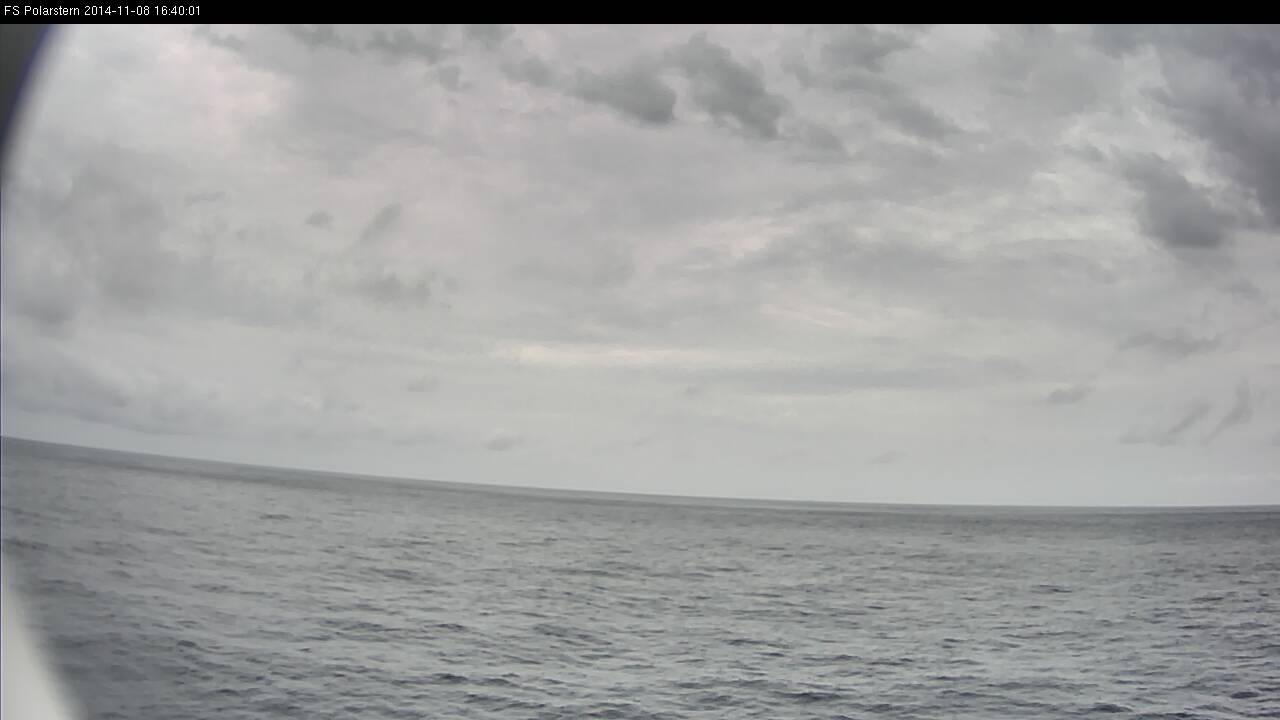
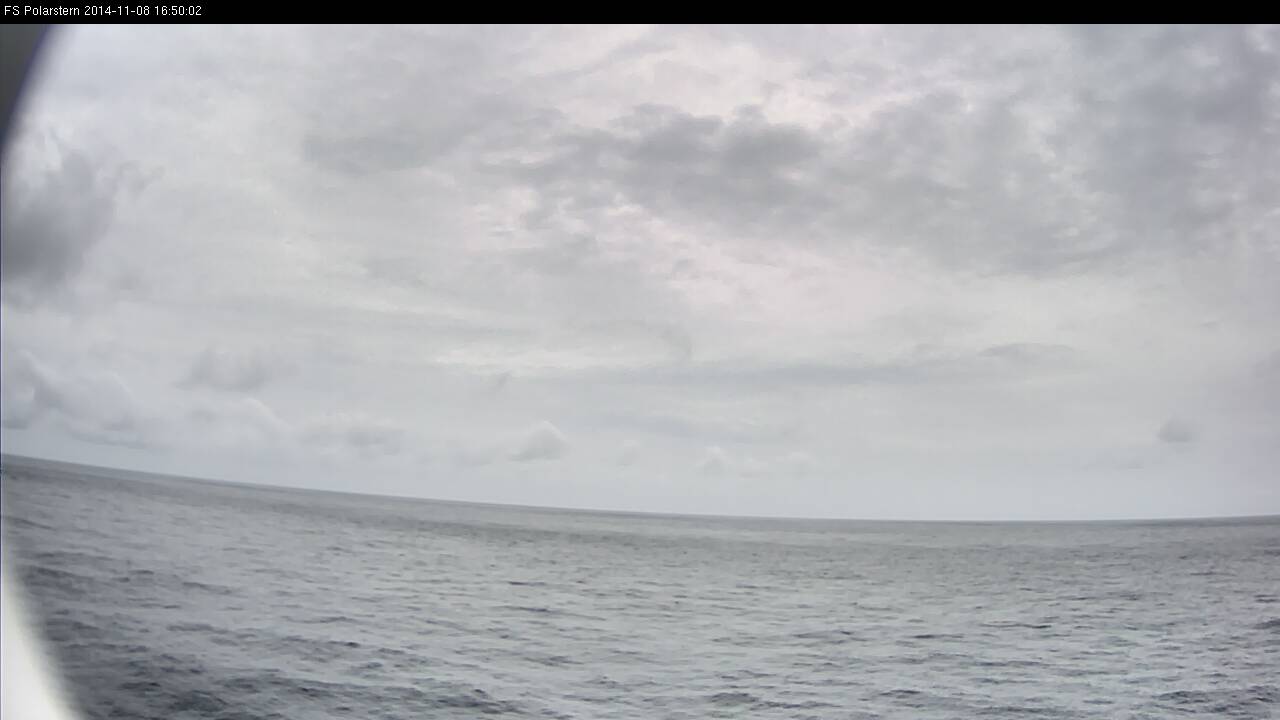
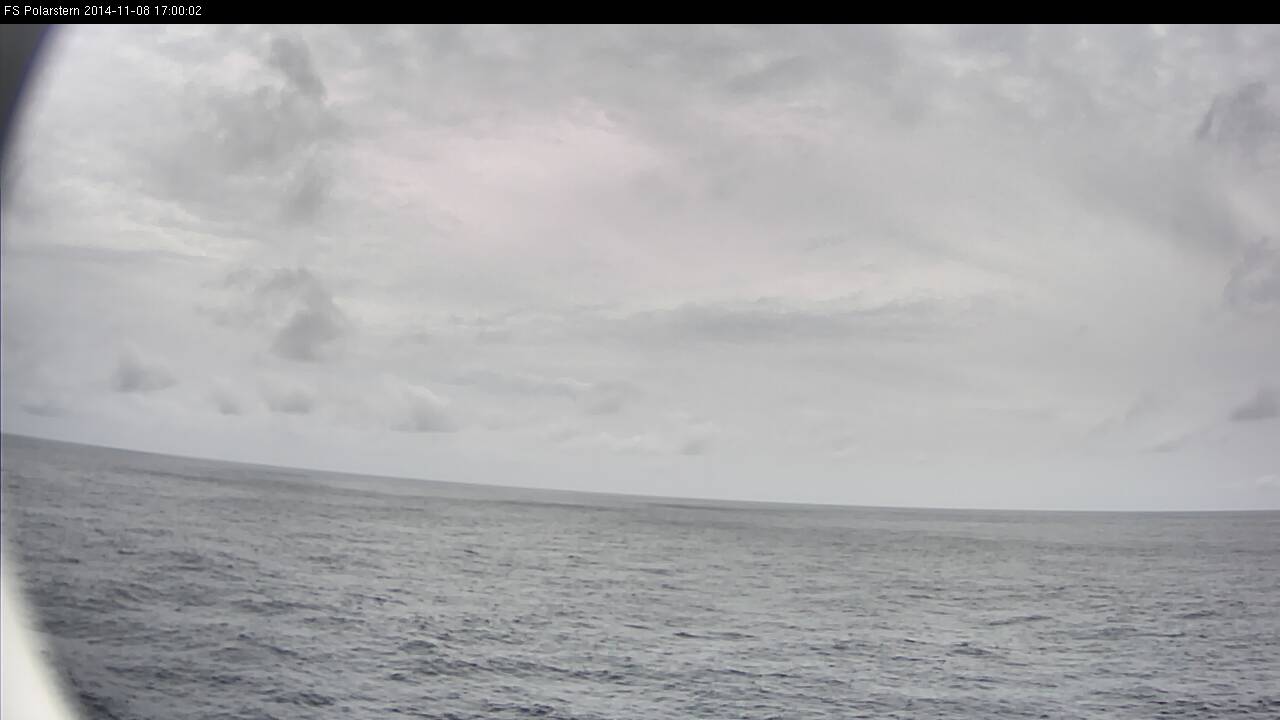
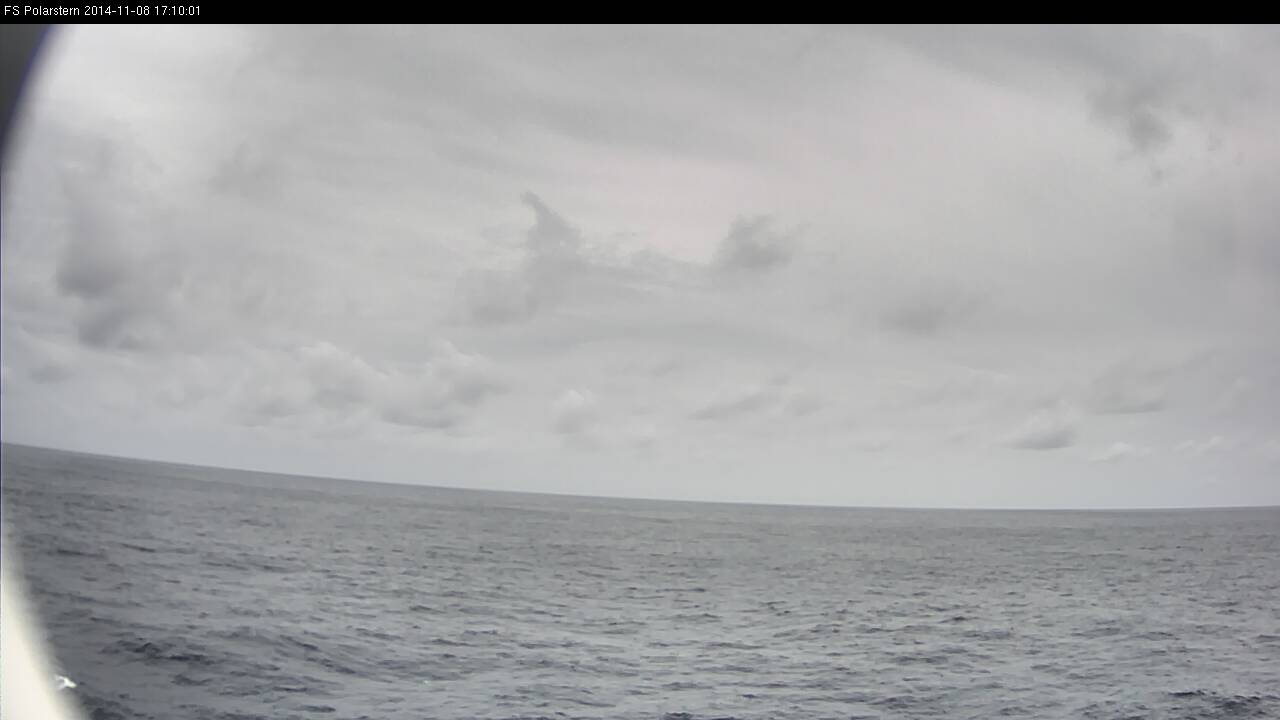
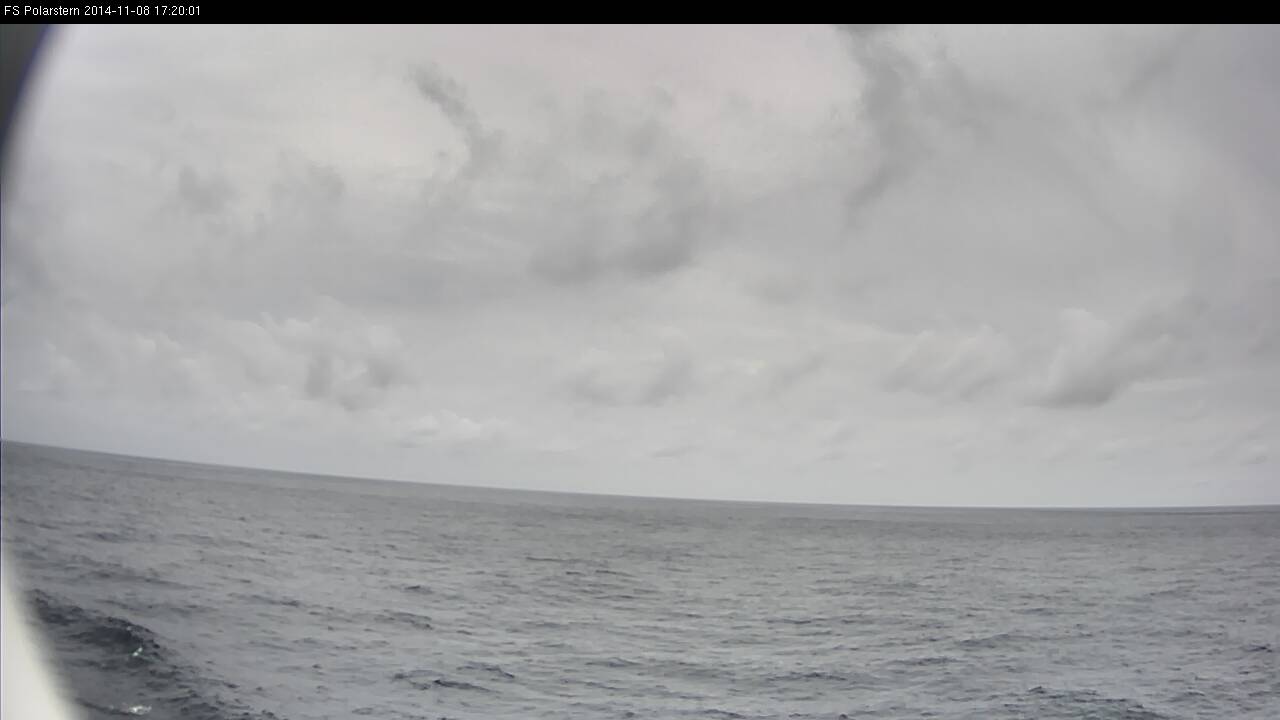
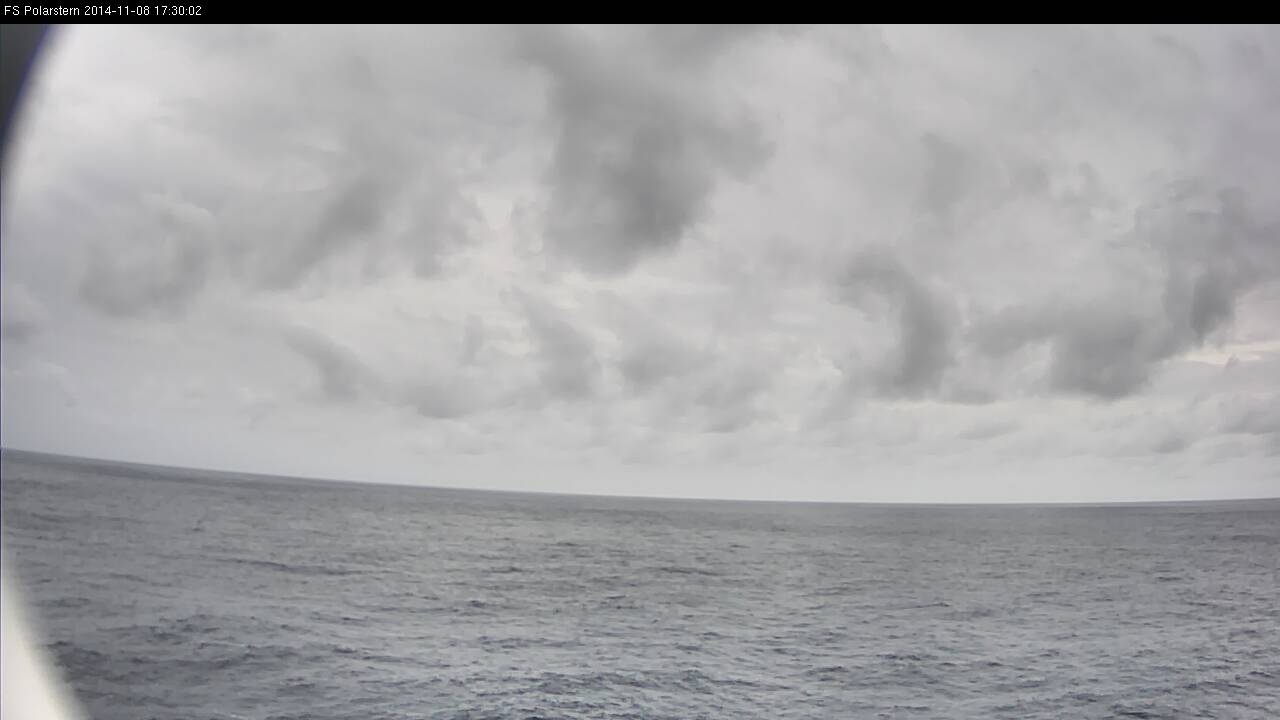
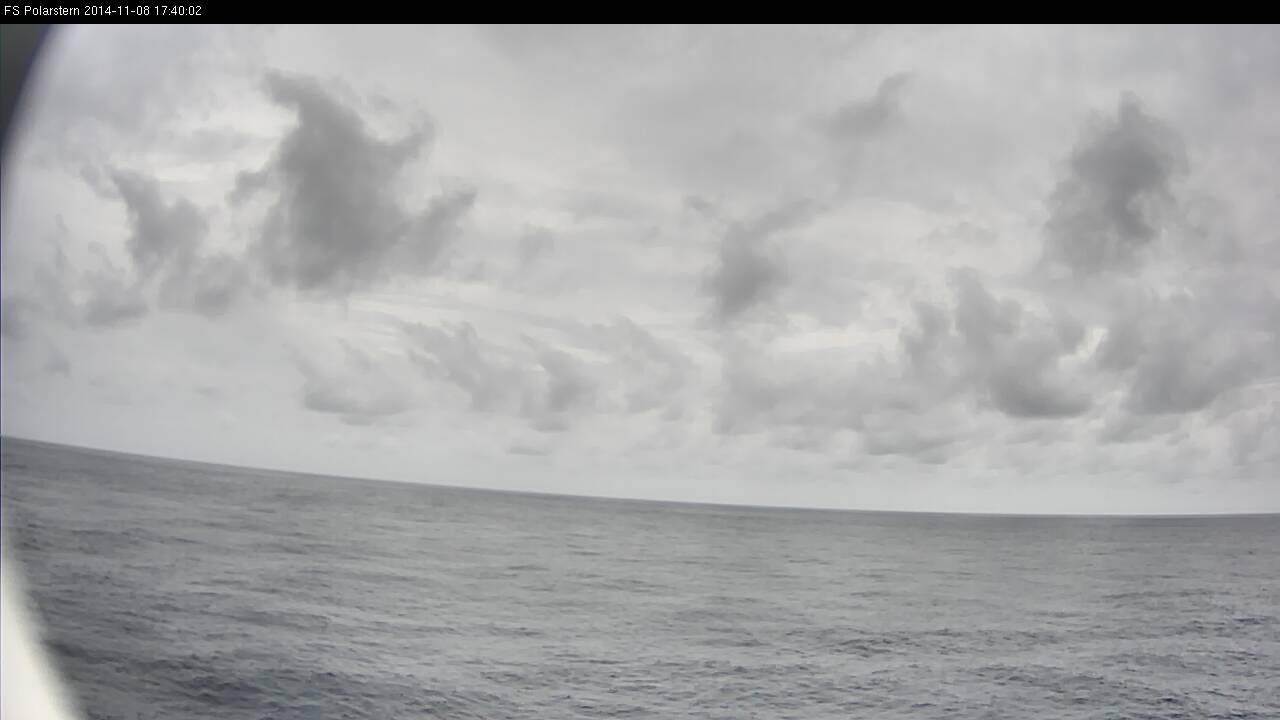
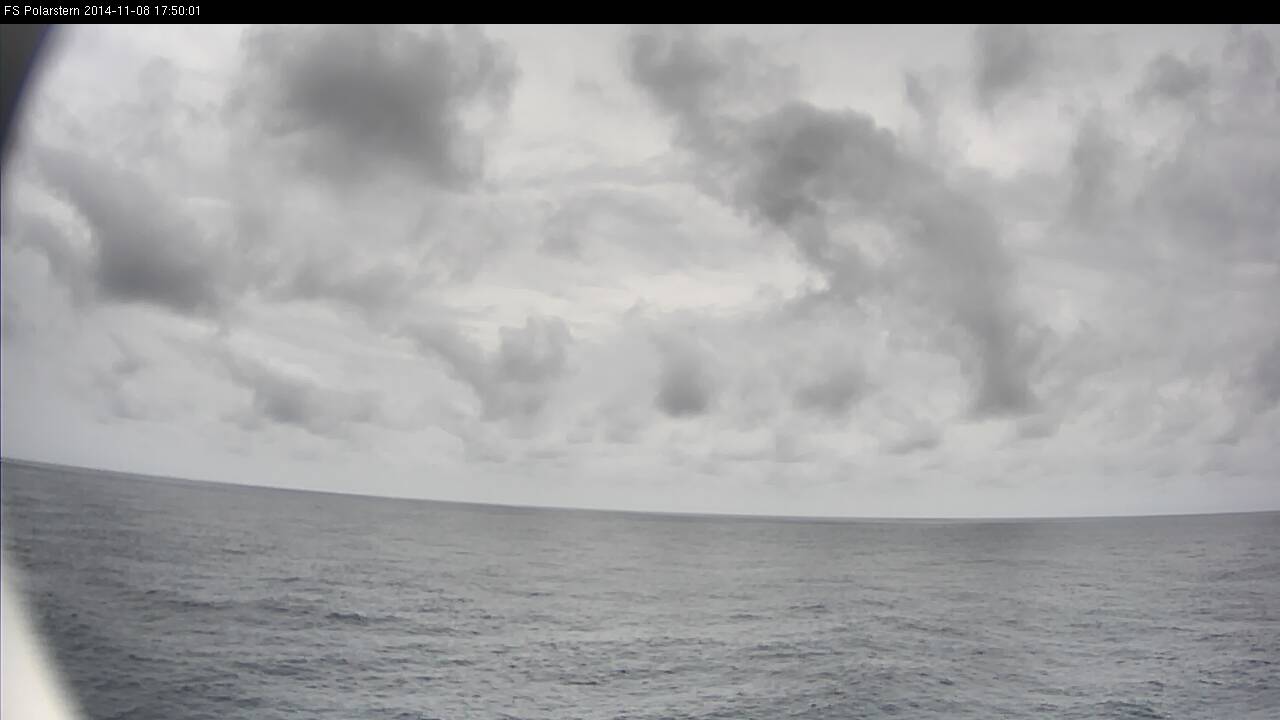
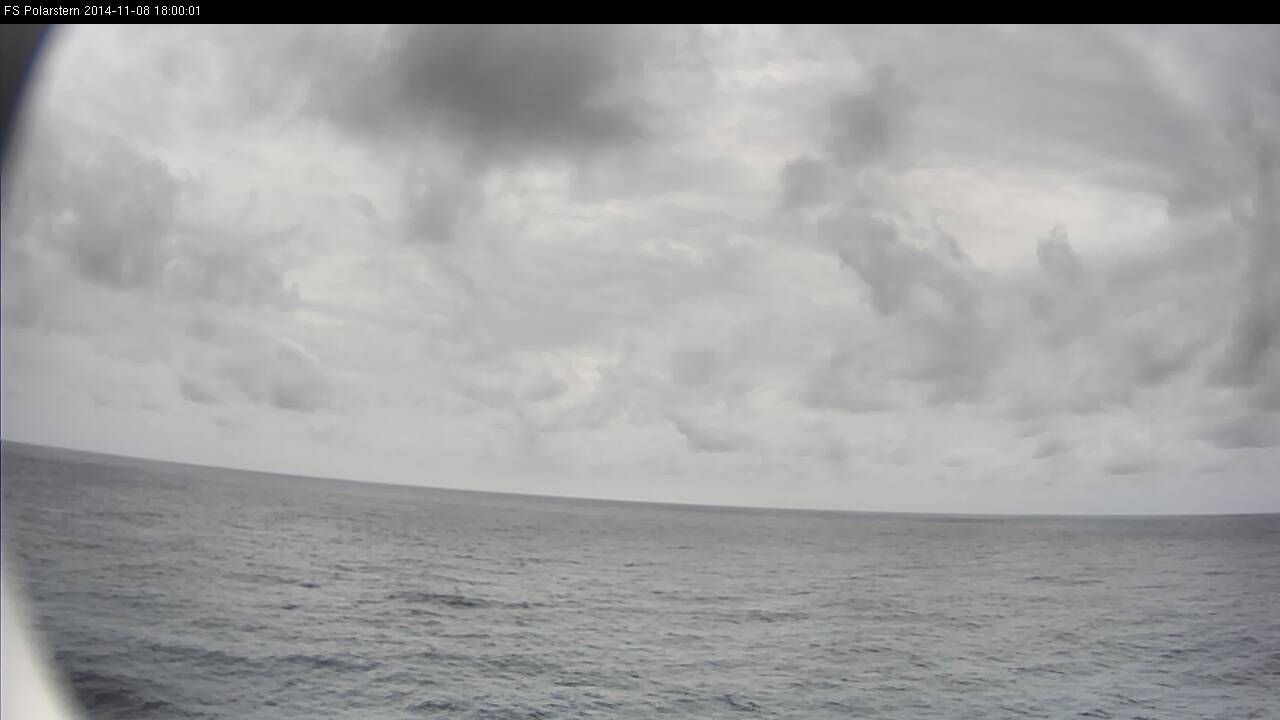
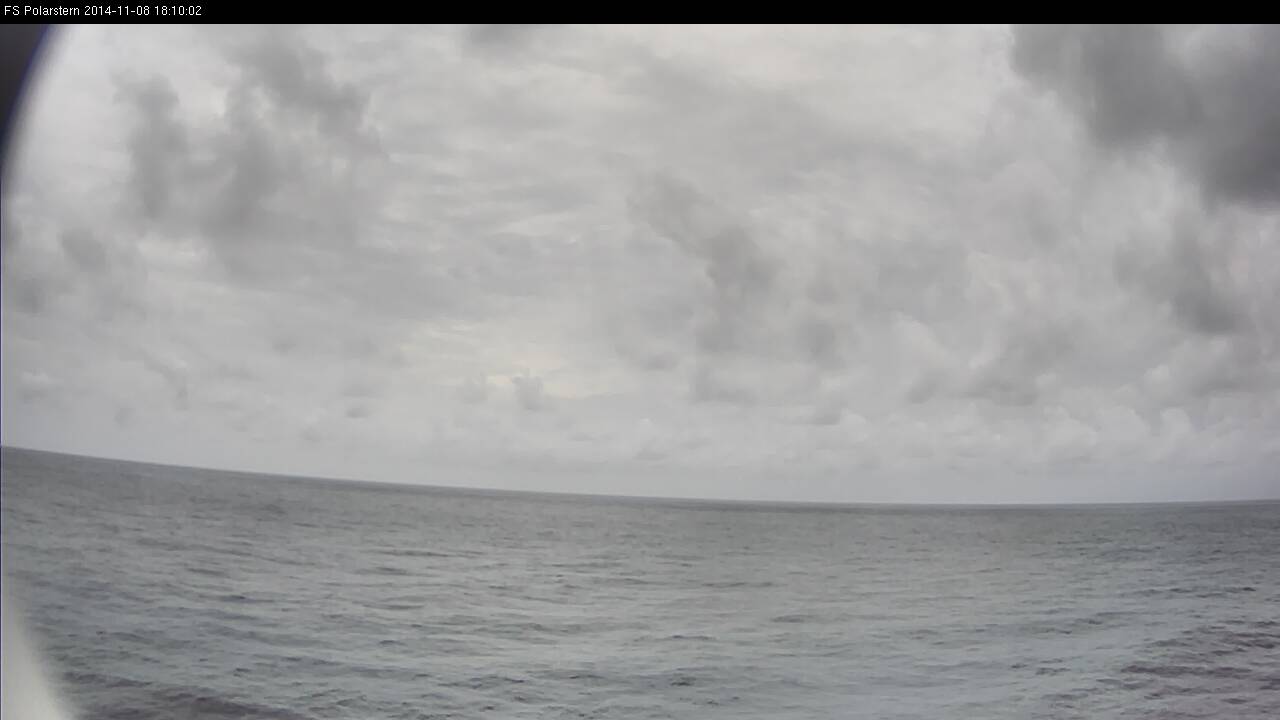
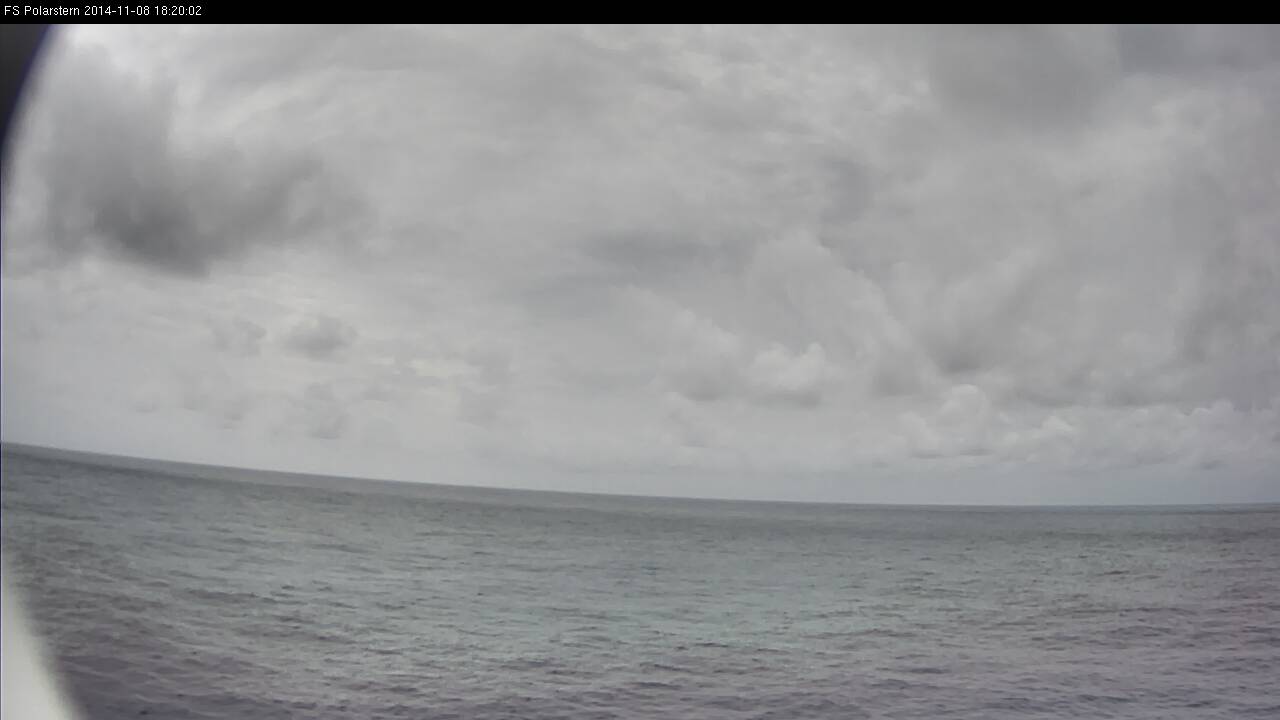
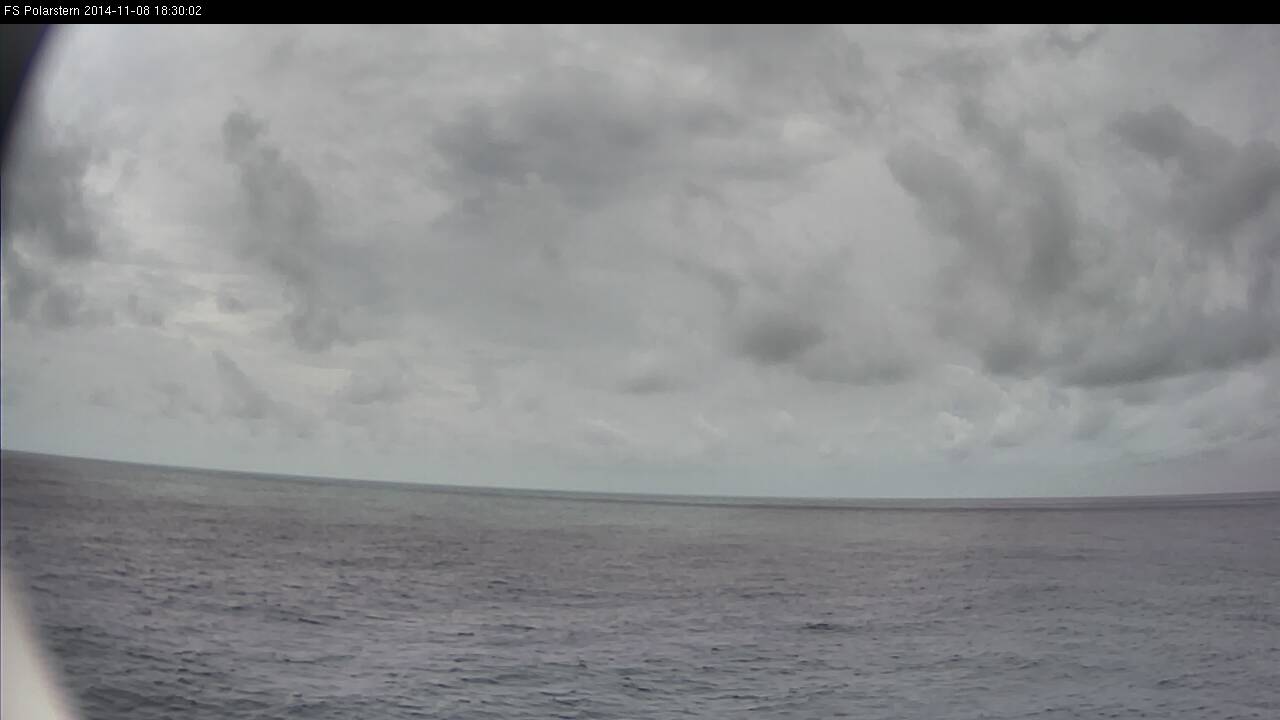
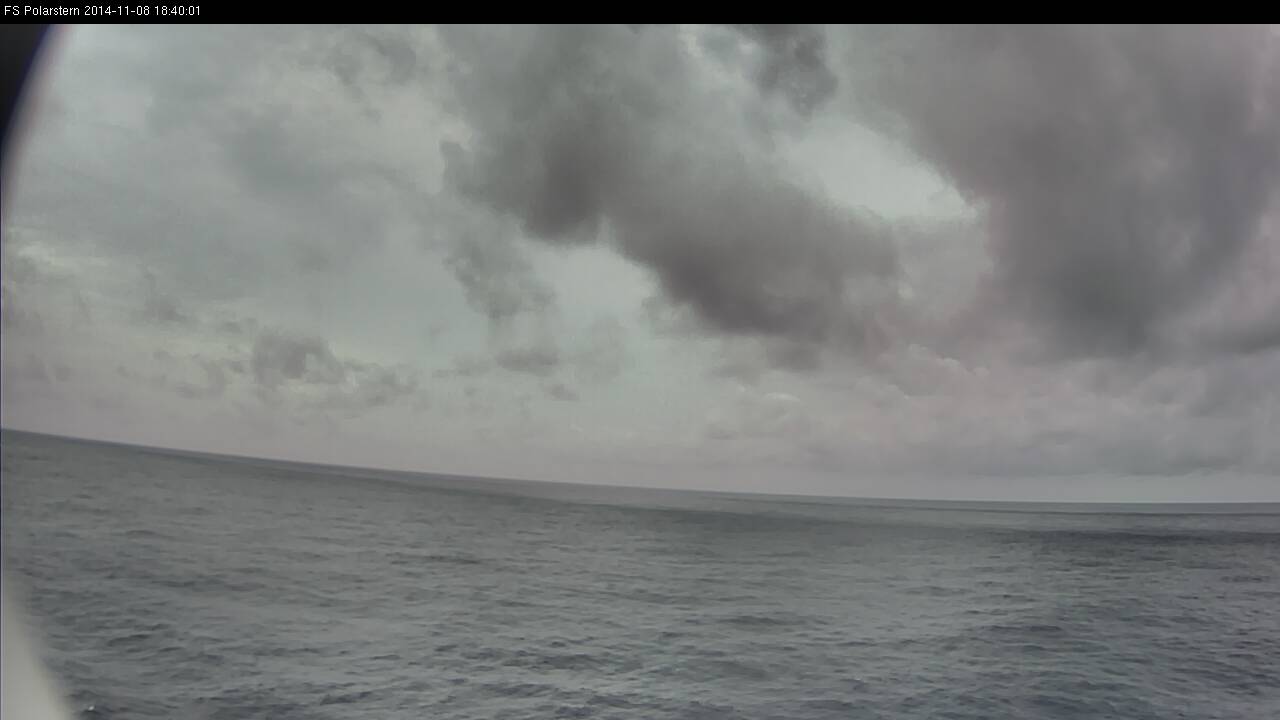
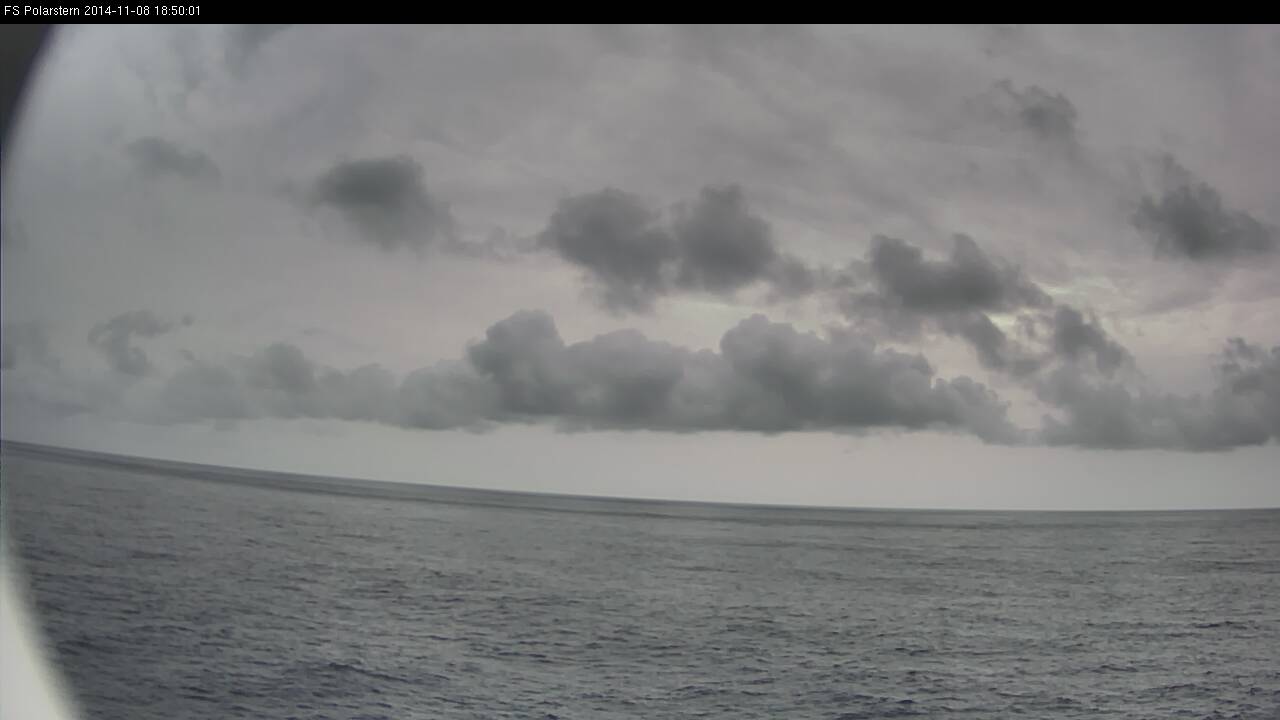
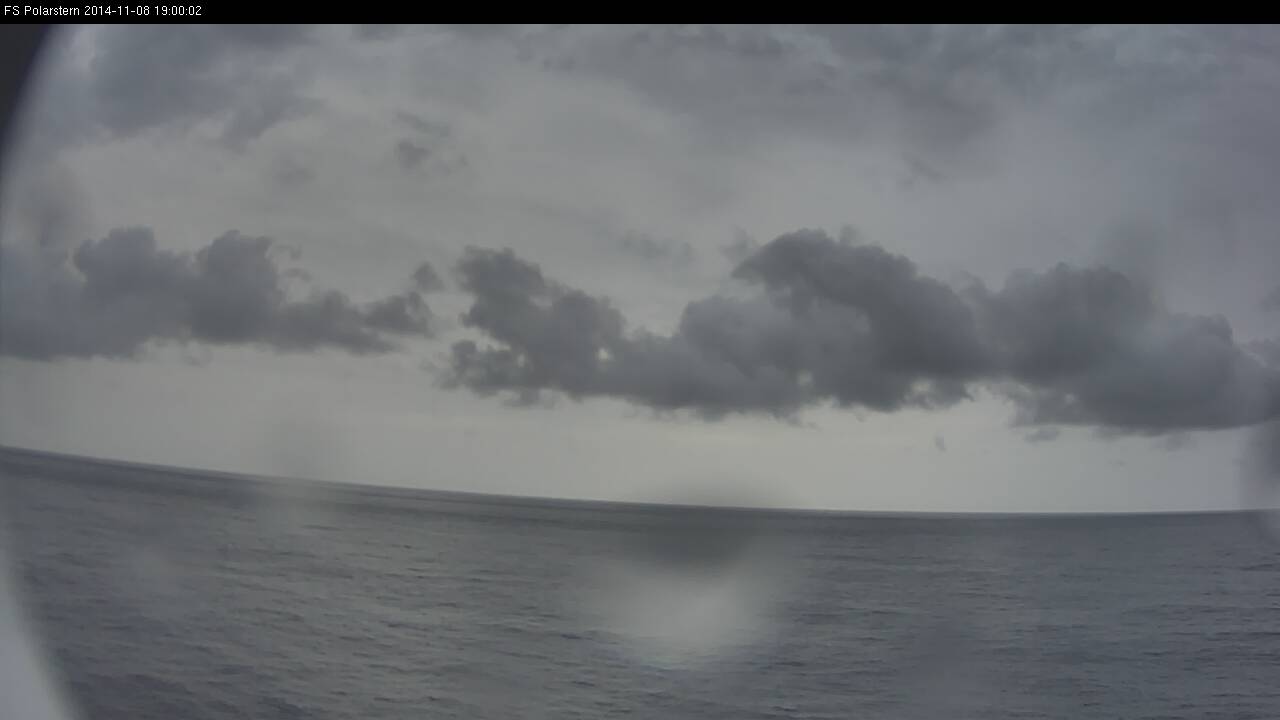
Loop 2: Note - click on the loop to go through individual images
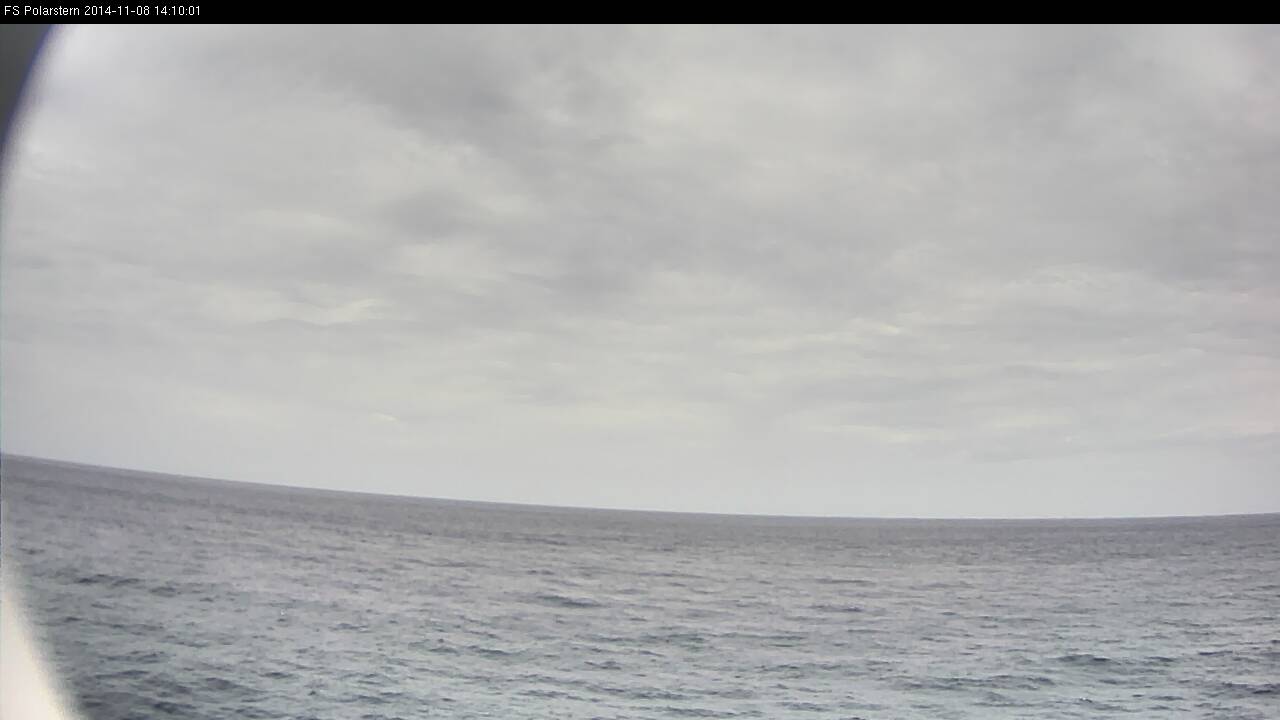
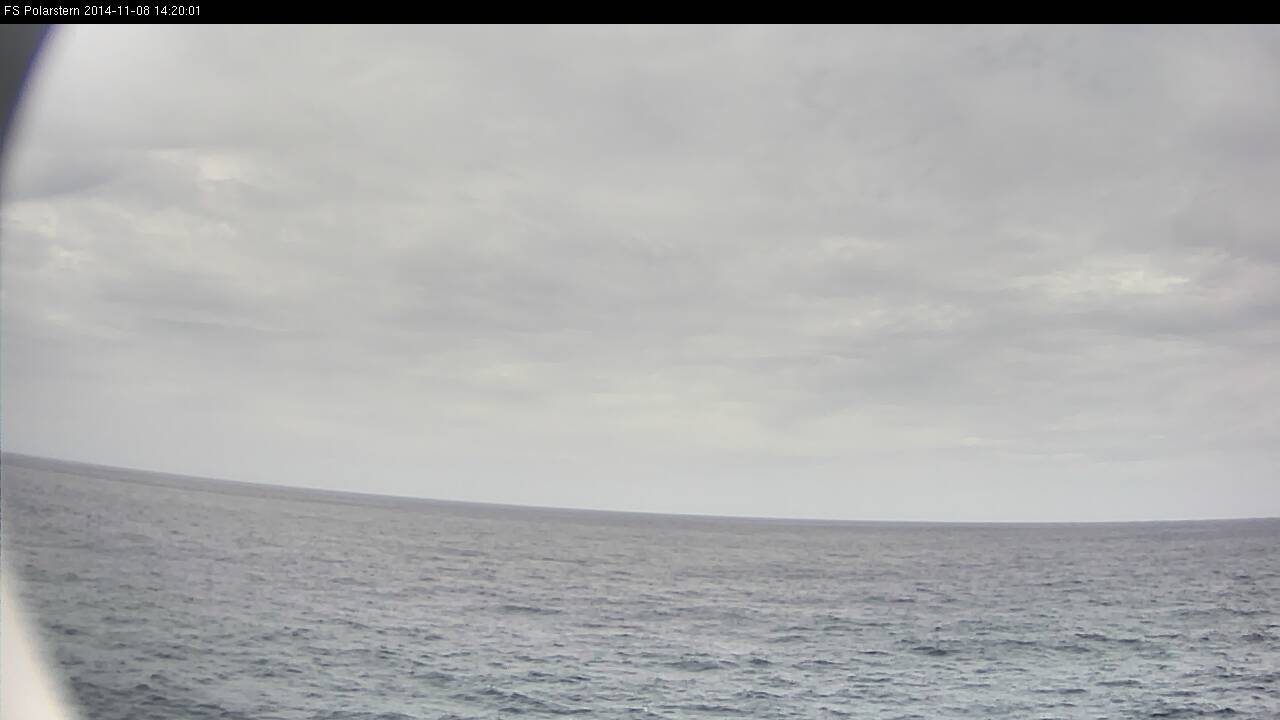
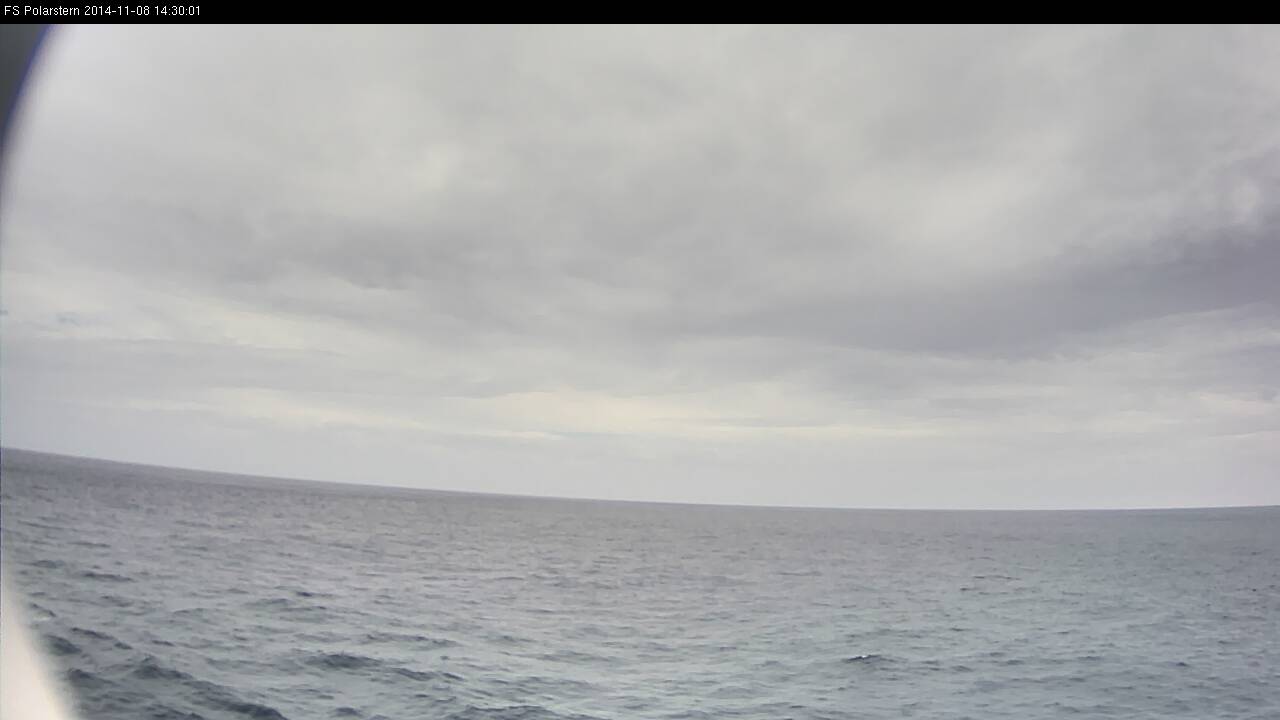
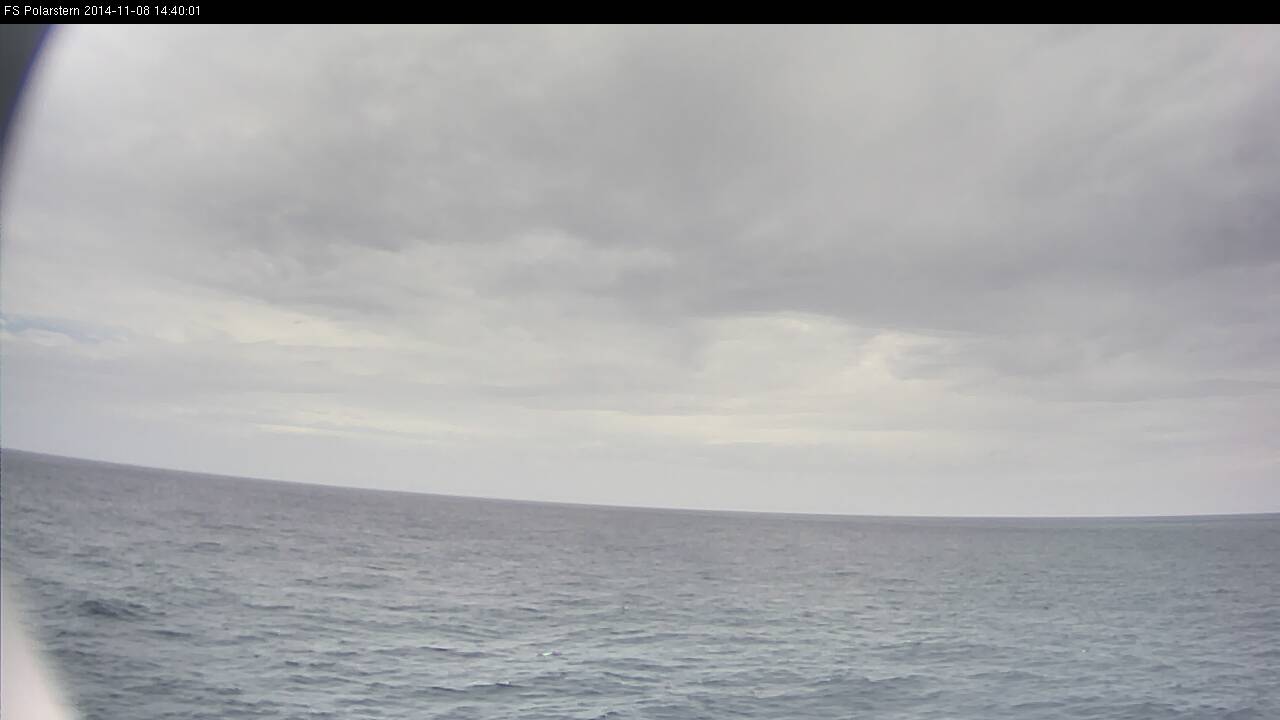
In this loop you will see all images taken by the webcam on 8 Nov 2014 between 06:50 UTC and 19:20 UTC.
Loop 3: Note - click on the loop to go through individual images
On that day it was mostly cloudy with stratiform and cumuliform clouds.
You will find more information in modules from COMET, such as "Tropical Severe Local Storms" and "Tropical Mesoscale Convective Systems", in the list of literature at the end of this section.