Logbook Nr. 2
| Polarstern Satellite Logbook Nr. 2 | |
|---|---|
| Region | Atlantic |
| Conceptual Model | Inter Tropical Convergence Zone (ITCZ) |
| Date/Time | 8 to 12 November 2014 |
| Longitude/Latitude |
10,7°N / 23,0°W (08 Nov, 12:00 UTC) 8,0°N / 23,0°W (09 Nov, 12:00 UTC) 6,0°N / 23,2°W (10 Nov, 12:00 UTC) 4,0°N / 23,0°W (11 Nov, 12:00 UTC) 2,0°N / 23,0°W (12 Nov, 12:00 UTC) |
| Expedition |
PS88 (ANT-XXX/1) 25 Oct - 29 Nov 2014 Bremerhaven - Cape Town |
Figure L2-1 shows the global wind circulation with our focus, the Hadley cells, which cover the trade wind regions between the subtropical high and the intertropical convergenze zone (ITCZ). We will follow the research vessel Polarstern from 8 to 12 November 2014 on its way from the northeast trade winds through the ITCZ to the southeast trade winds.
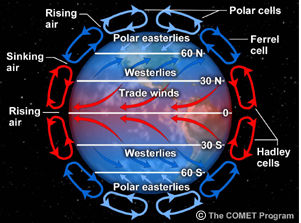
Figure L2-1: Global wind circulation.
Source: COMET, Introduction to Tropical Meteorology, Chapter 3: Global Circulation.
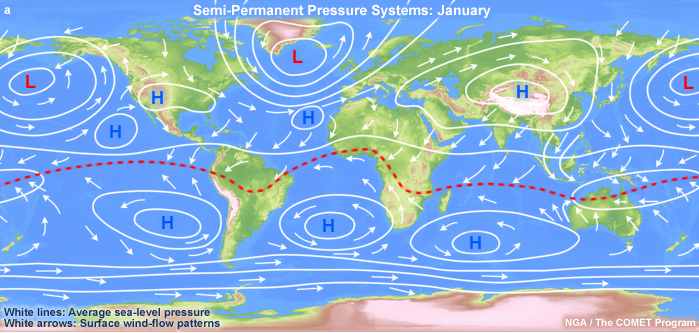
Figure L2-2: Mean pressure systems and corresponding wind vectors at the surface for January. The red dashed lines represent the equatorial trough (and monsoon trough over Asia). Source: COMET, Introduction to Tropical Meteorology, Chapter 3: Global Circulation.
Figure L2-2 depicts mean pressure systems with wind vectors in January. We can make an approximate comparison between this situation and the one on 8-12 November 2014.
In Figure L2-3, the tropics are marked by upward motion and the subtropics by sinking motion, forming the Hadley cell. The patterns are not mirrored across the equator. Note that the zones change from season to season and there are differences between land and the ocean.
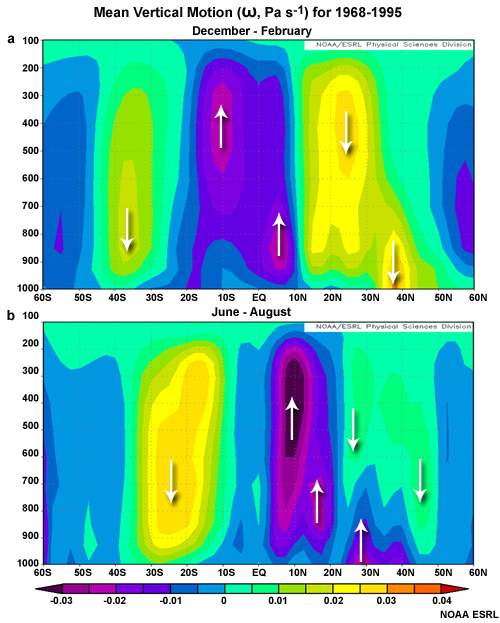
Figure L2-3: Mean vertical motion for December - February (a) and June - August (b), from NCEP Climate Atlas 1968-1995.
Source: COMET, Introduction to Tropical Meteorology, Chapter 3: Global Circulation.
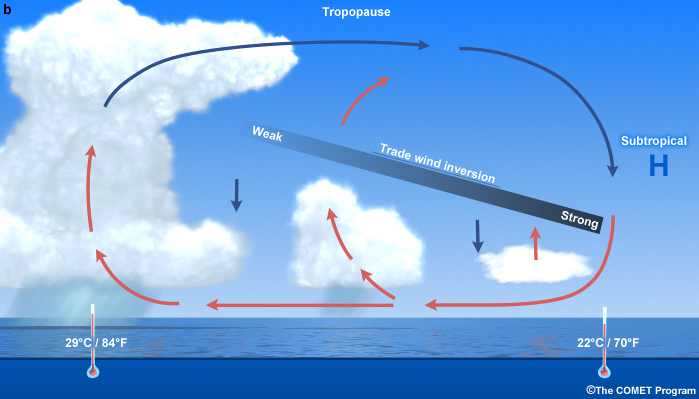
Figure L2-4: Vertical profile of the trade wind inversion from the subtropical high to the ITCZ.
Source: COMET, Introduction to Tropical Meteorology, Chapter 1: Introduction.
In Fig. L2-4 you can see that the influence of the trade wind inversion on the vertical extent of the convective clouds. The ITCZ appears in the following satellite images as a band of cloud clusters with thunderstorms. Between the areas with strong convection there are zones with less weather activity.