Logbook Nr. 1
| Polarstern Satellite Logbook Nr. 1 | |
|---|---|
| Region | South Atlantic, St. Helena |
| Conceptual Model | Southeast Trade Winds Cloud Wakes |
| Date/Time | 20 November 2014, 12 - 18 UTC |
| Longitude/Latitude | 15,2°S / 6,5°W (12:00 UTC) |
| Expedition |
PS88 (ANT-XXX/1) 25 Oct - 29 Nov 2014 Bremerhaven - Cape Town |
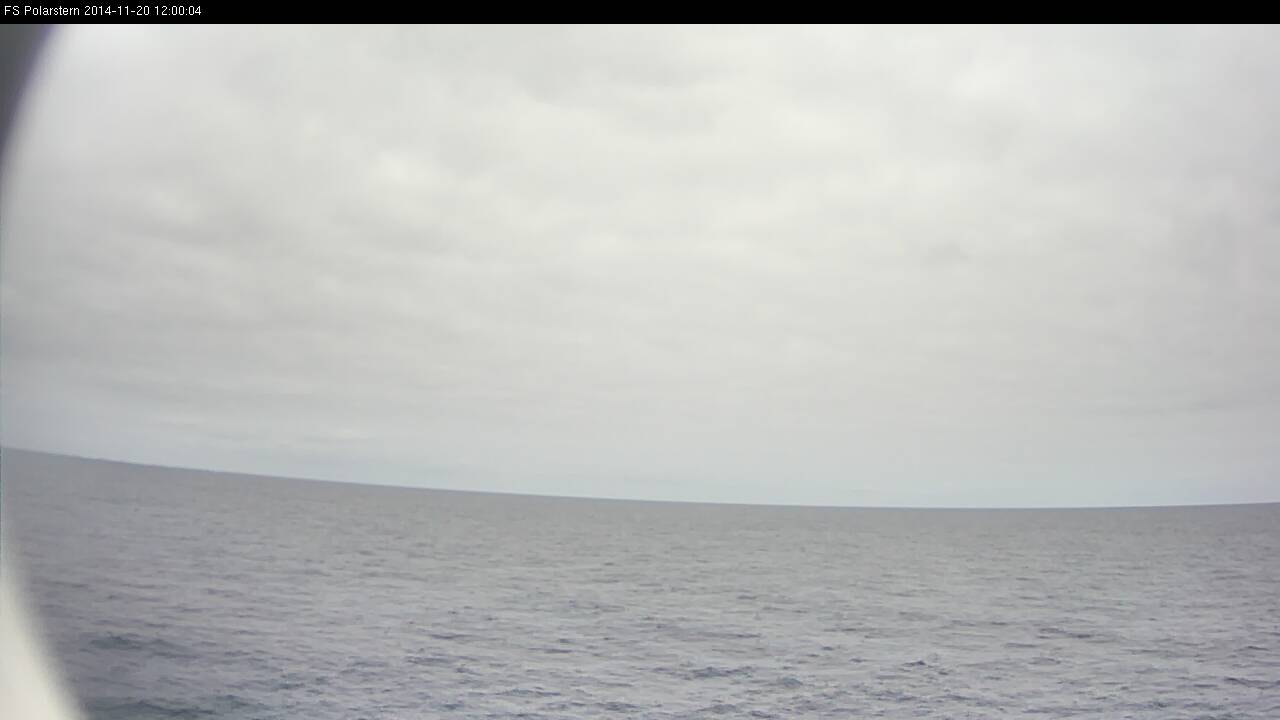
The Polastern is sailing against the southeast trade winds in the southern hemisphere. On the northern flank of the large subtropical high, the pinkish color is dominant in the Dust RGB. This is the color for low level water clouds (Figure L1-1).
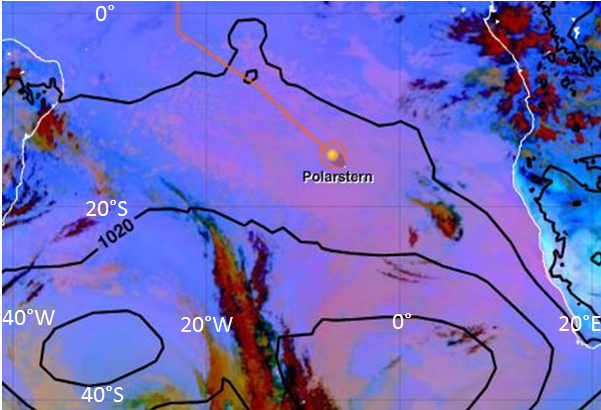
Figure L1-1: 20 Nov 2014, 12:00 UTC, Dust RGB. Source: EUMeTrain.
In the following GFS-model sounding you can see steady east-southeasterly winds of 10 knots under the pronounced inversion around 900 m (Figure L1-2).
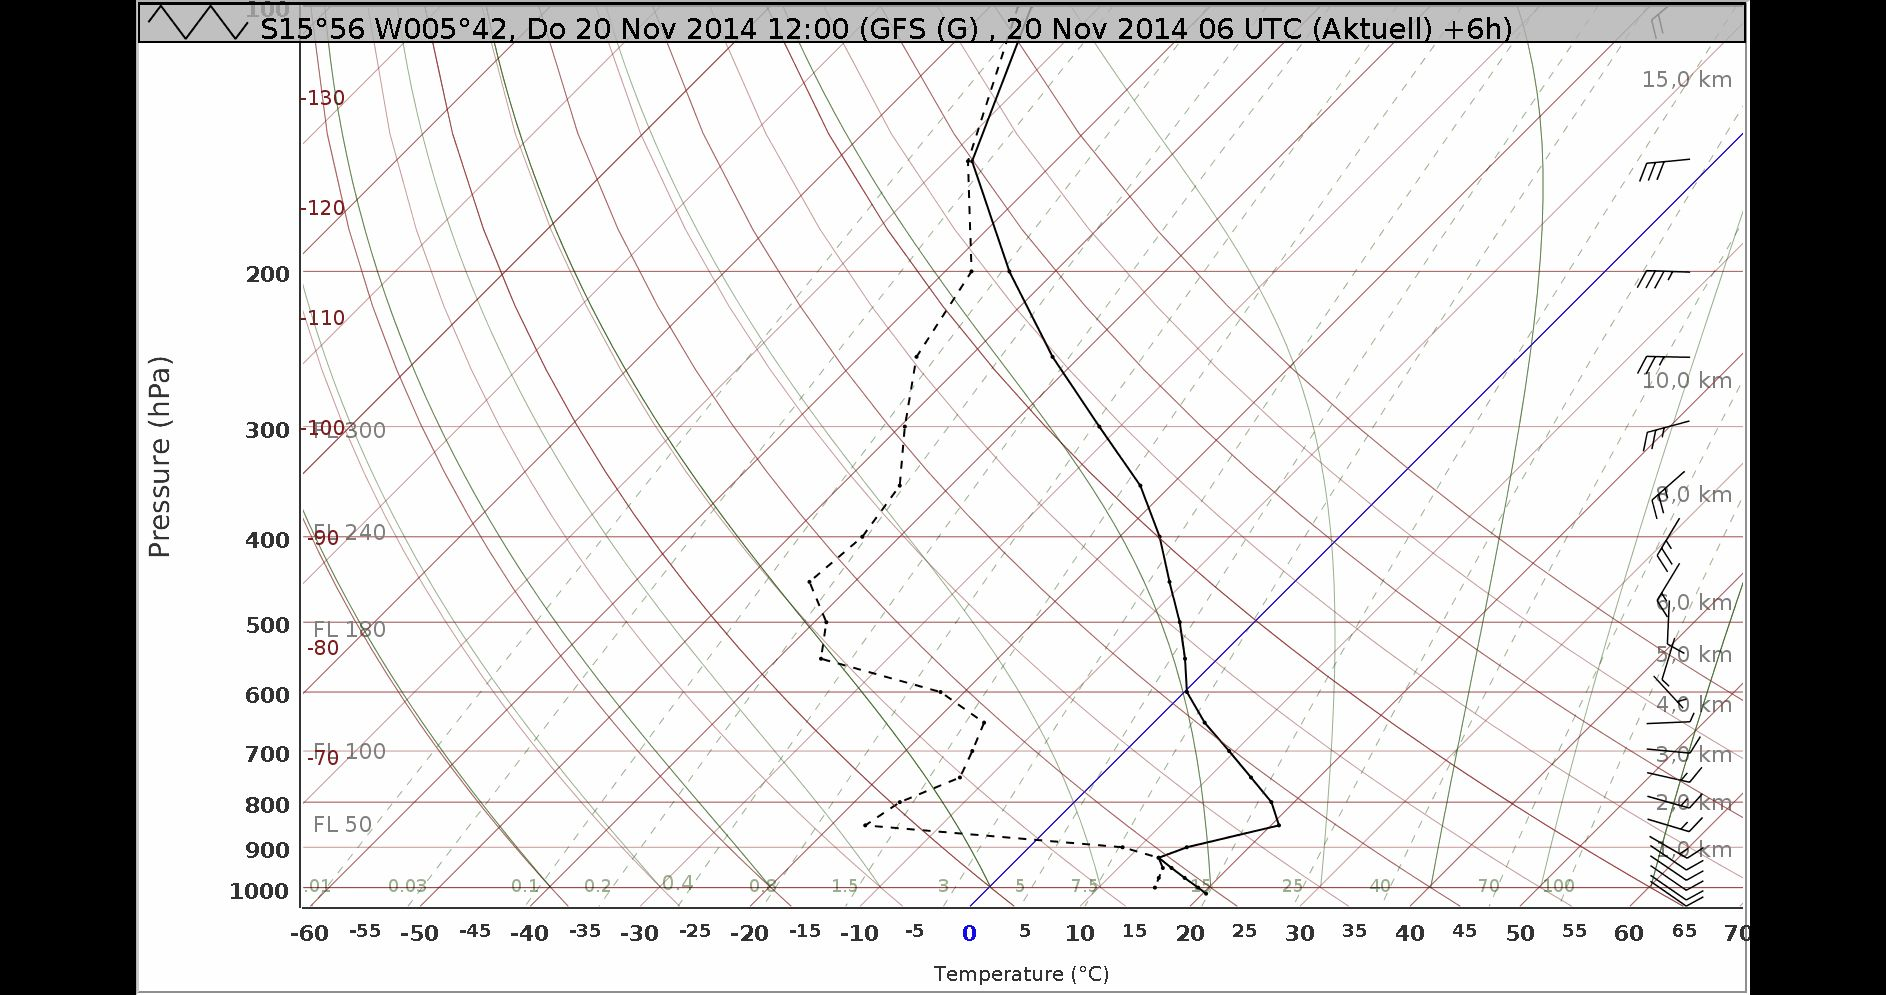
Figure L1-2: 20 Nov 2014, 12:00 UTC, Sounding as a GFS-Forecast from 06:00 UTC, source: DWD
DBLK 20121 99152 50065 11598 71406 10195 20151 40173 58009 6///1 71582 878//
22233 04206 20301 314// 41004 6//// =
DBLK 20151 99156 50061 41599 81205 10199 20153 40155 56018 71422 888//
22233 04208 20301 314// 41004 6//// =
DBLK 20181 99159 50058 11598 71205 10202 20141 40157 53002 6///2 70222 875//
22232 04207 20301 6//// =
Above you see the SYNOP Code FM13 SHIP for 12, 15 and 18 UTC.
At 12 UTC the measured wind was 140° 06 knots, the air temperature 19,5°C, there is precipitation over the sea more than 5 km away, and there is a cloud cover of 7/8 consisting of cumulus and stratocumulus with cloud bases at different heights.
The Polarstern is sailing towards the island of Saint Helena. It is one of the most isolated places in the world, located on the Mid-Atlantic Ridge and more than 2000 km from the nearest major landmass. Saint Helena has a total area of 122 km2 and the highest point of the island is at 818 m.
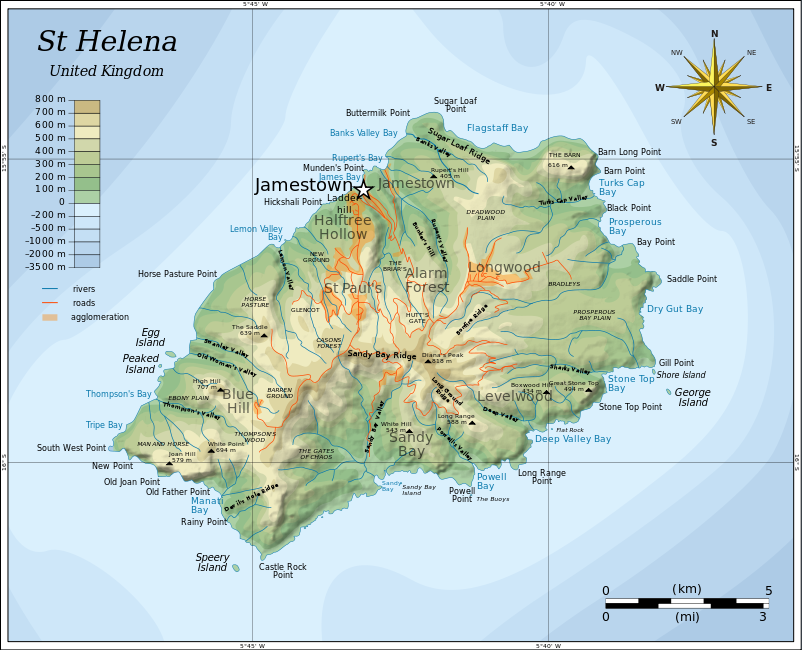
Figure L1-3: Geography of Saint Helena. Source: Wikipedia.
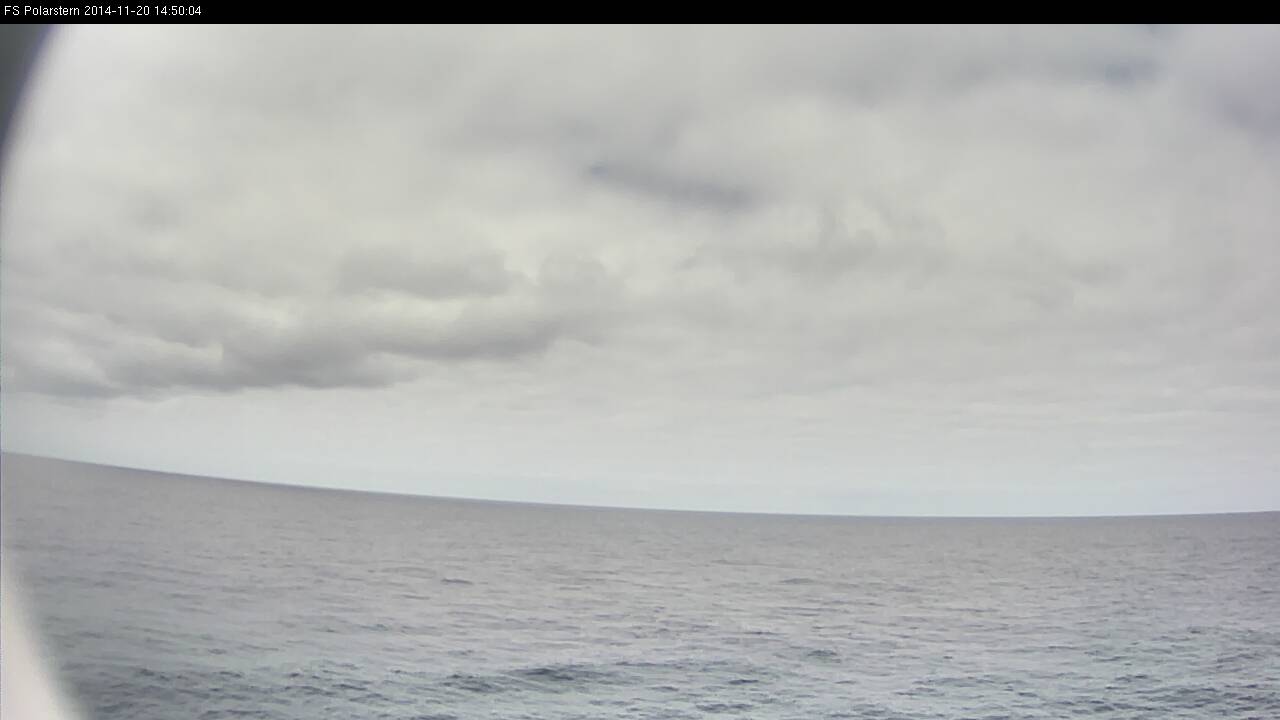
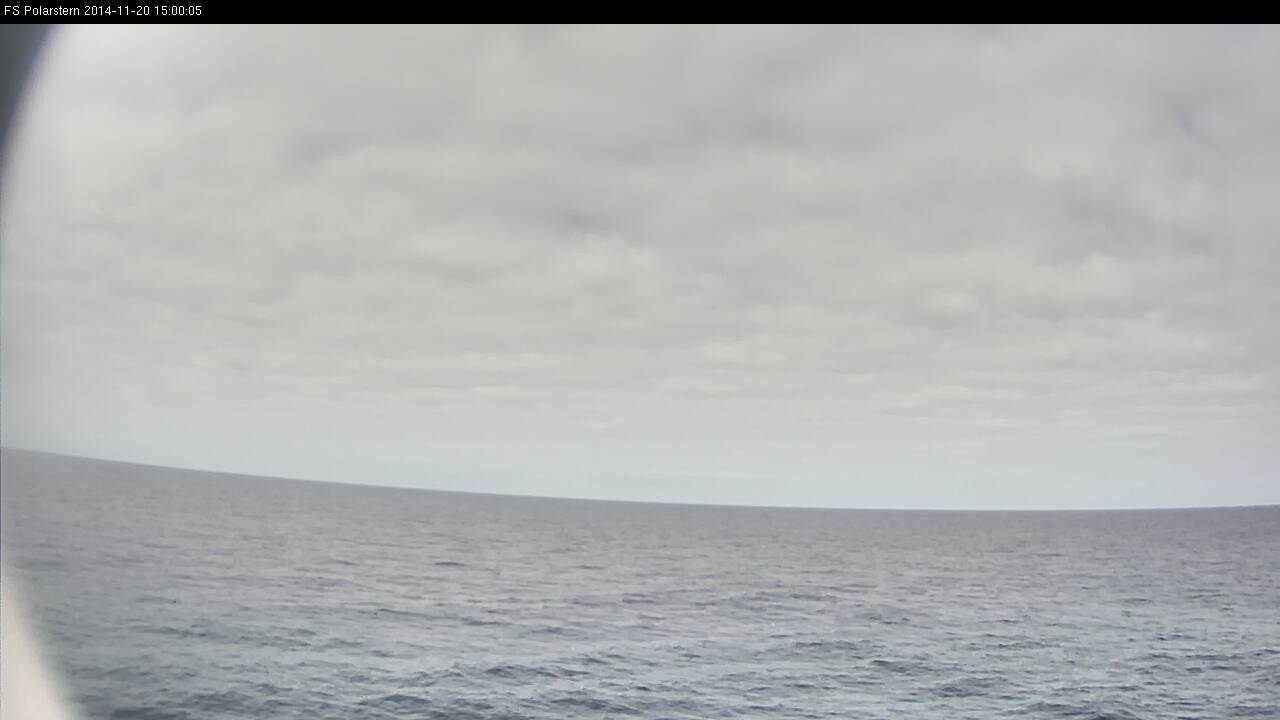
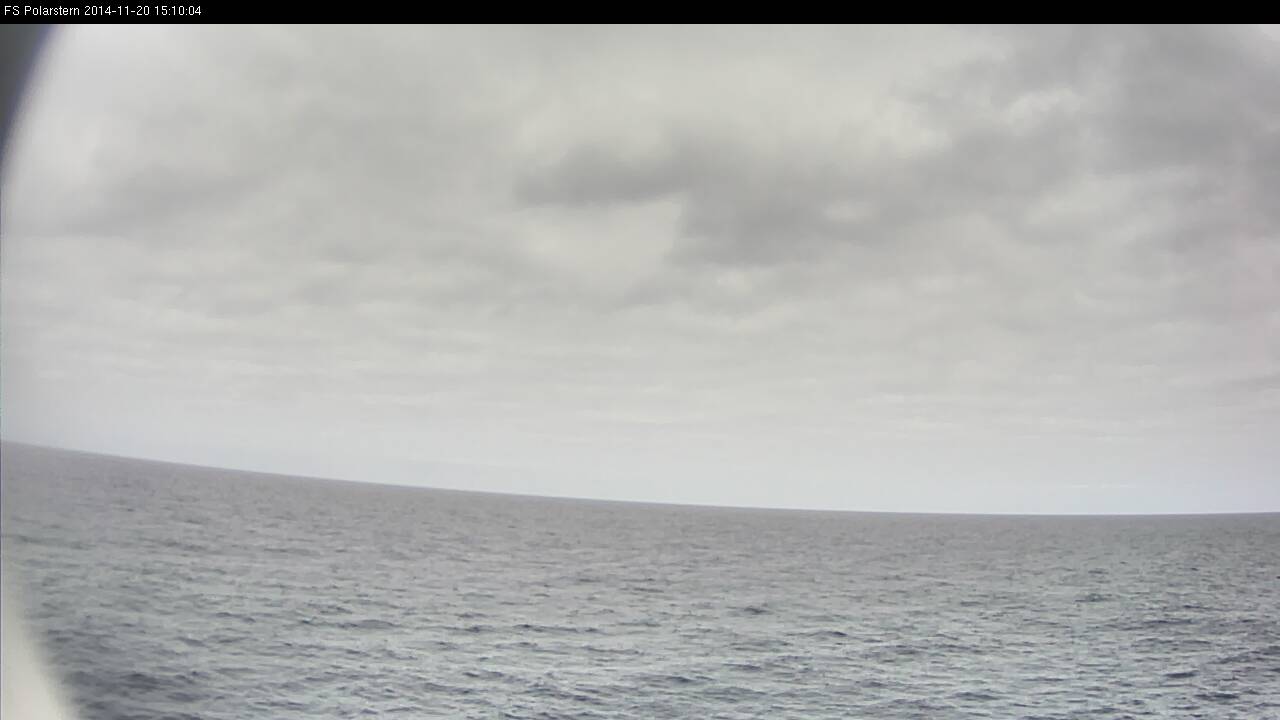
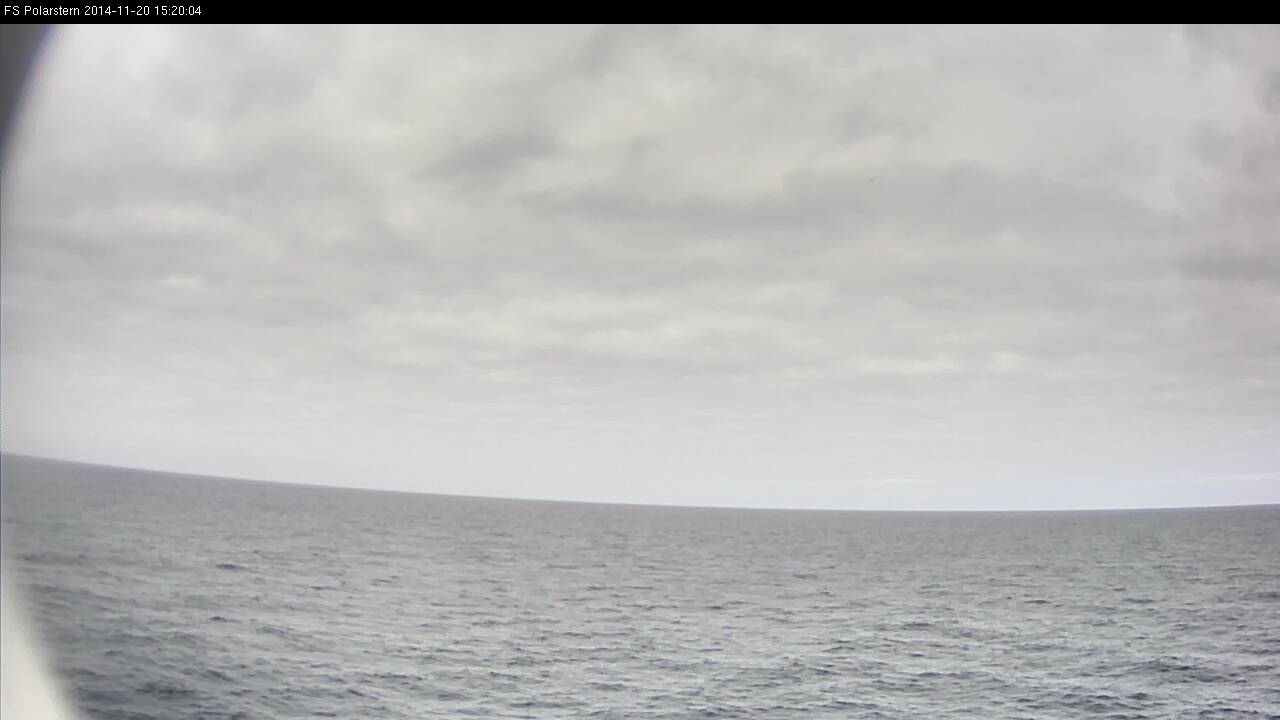
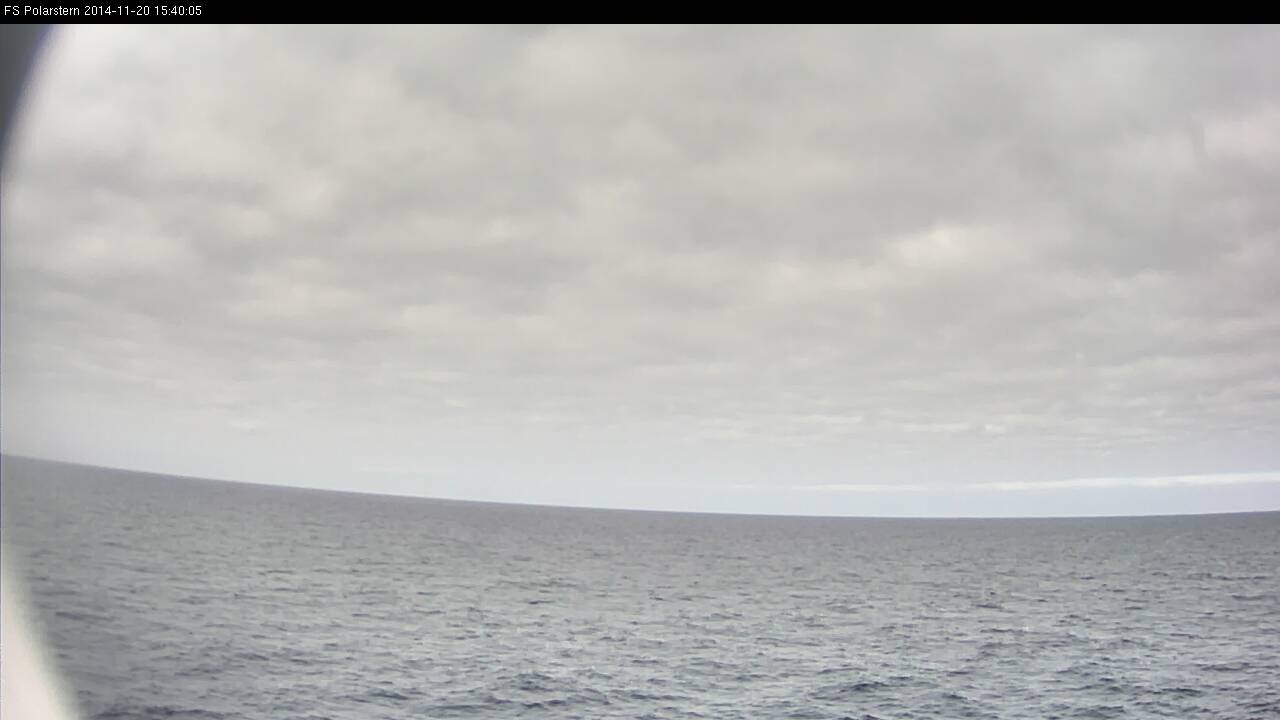
Figures L1-4a to L1-4d are a time step series from 15 to 18 UTC when the Polarstern is approaching St. Helena from the northwest (lee side). The three smaller images up top are, in order of left to right, VIS0.6, IR10.8 and Day Microphysics RGB. The image on the bottom is the view from the webcam on the port (left) side of the vessel. The position of the Polarstern is marked with the call sign "DBLK".
From 15 to 17 UTC the Polarstern sailed in the center of a symmetric V-shaped cloud wake in an area with lifting motion.
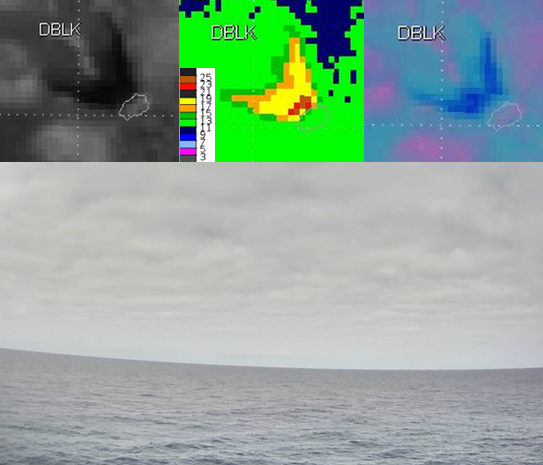
Figure L1-4a: 20 Nov 2014, 15:00 UTC. Source: DWD. Above, from left to right: VIS0.6 / IR10.8 / Day Microphysics RGB.
Below: the view from the webcam at the back of the vessel.
At 15:00 UTC (Figure L1-4a) the Polarstern is sailing under a thick layer of stratocumulus with a high albedo in the VIS0.6 image. An added hint of larger cloud droplets comes from the pinkish color in the Day Microphysics RGB. This is typical for subtropical cloudiness and hints at a tendency of precipitation. The measurements of the SYNOP confirm this theory with the code 14. This means that the observer saw virga, or precipitation in the nearby surroundings which did not reach the ground. In closed cells, the cloud droplets will form only drizzle droplets by coalescence.
The IR10.8 image shows the temperature difference between the cloud tops (11-13°C) and the nearly cloud-free areas (21-23°C) clearly. The exact value for the measured water temperature is 20,8°C (see SYNOP).
SYNOP from Polarstern
DBLK 20151 99156 50061 41599 81205 10199 20153 40155 56018 71422 888//
22233 04208 20301 314// 41004 6//// =
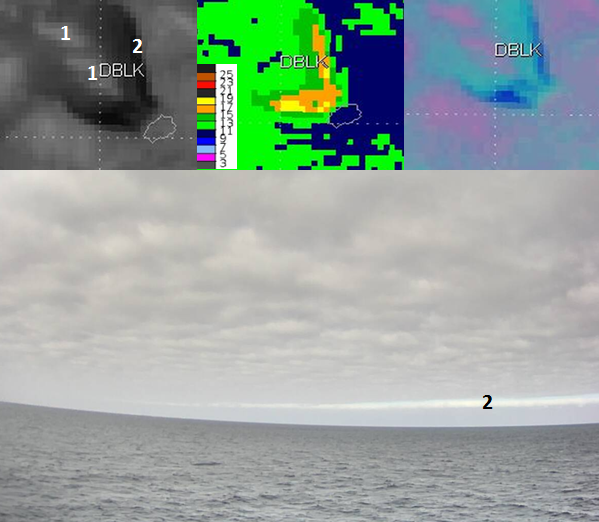
Figure L1-4b: 20 Nov 2014, 16:00 UTC. Source: DWD. Above, from left to right: VIS0.6 / IR10.8 / Day Microphysics RGB.
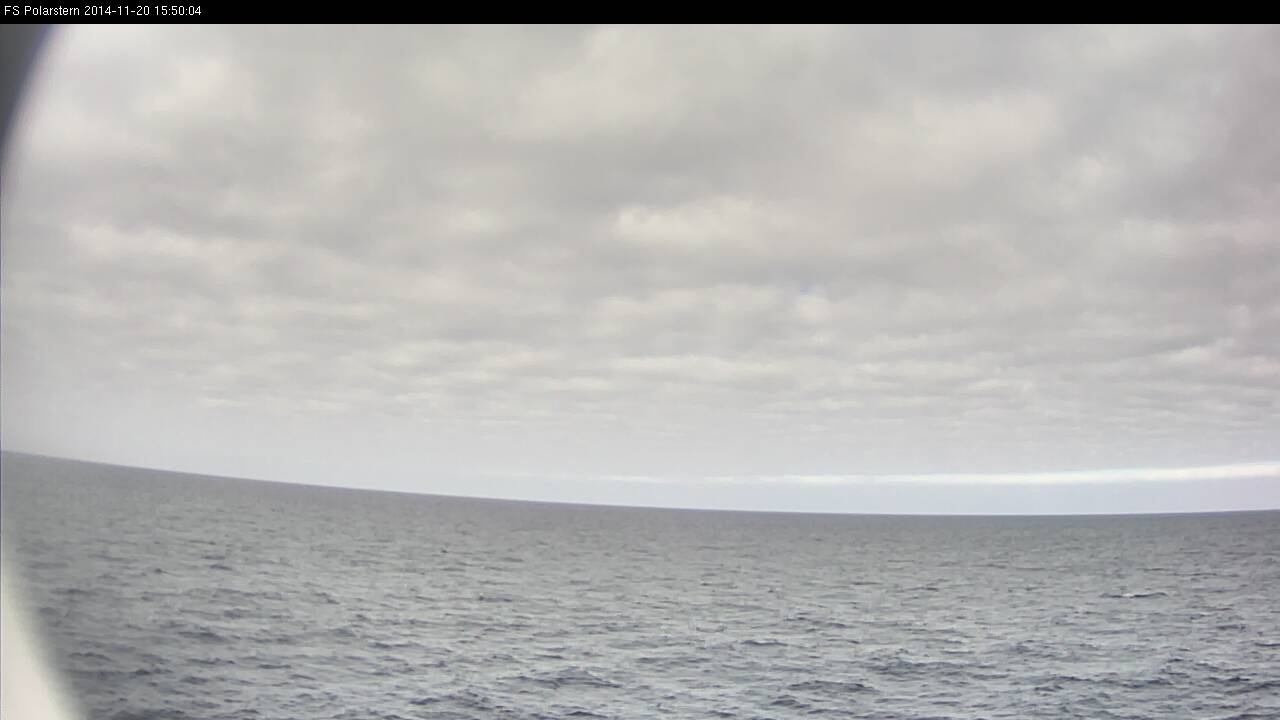
Below: the view from the webcam at the back of the vessel.
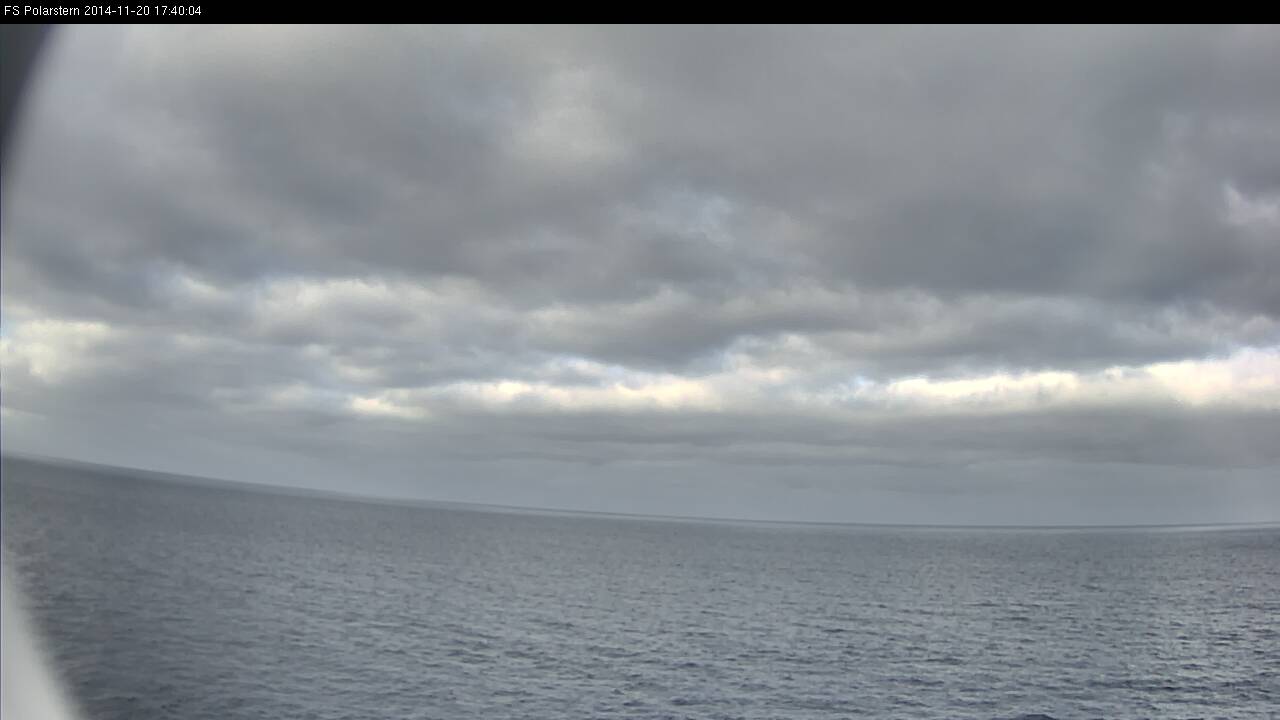
At 16:00 UTC (Figure L1-4b) there is rudimentary wave cloud formation in the center of the cloud wakes (1). In this case the waves are too weak to form typical wave clouds. On the aft side of the Polarstern, the webcam sees the cloud-free area of the V-shape with subsidence (2).
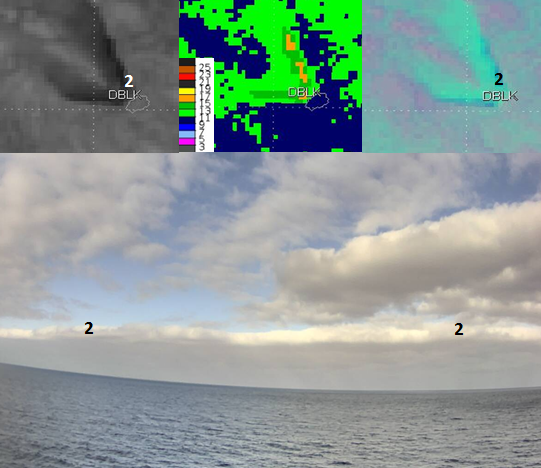
Figure L1-4c: 20 Nov 2014, 17:00 UTC. Source: DWD. Above, from left to right: VIS0.6 / IR10.8 / Day Microphysics RGB.
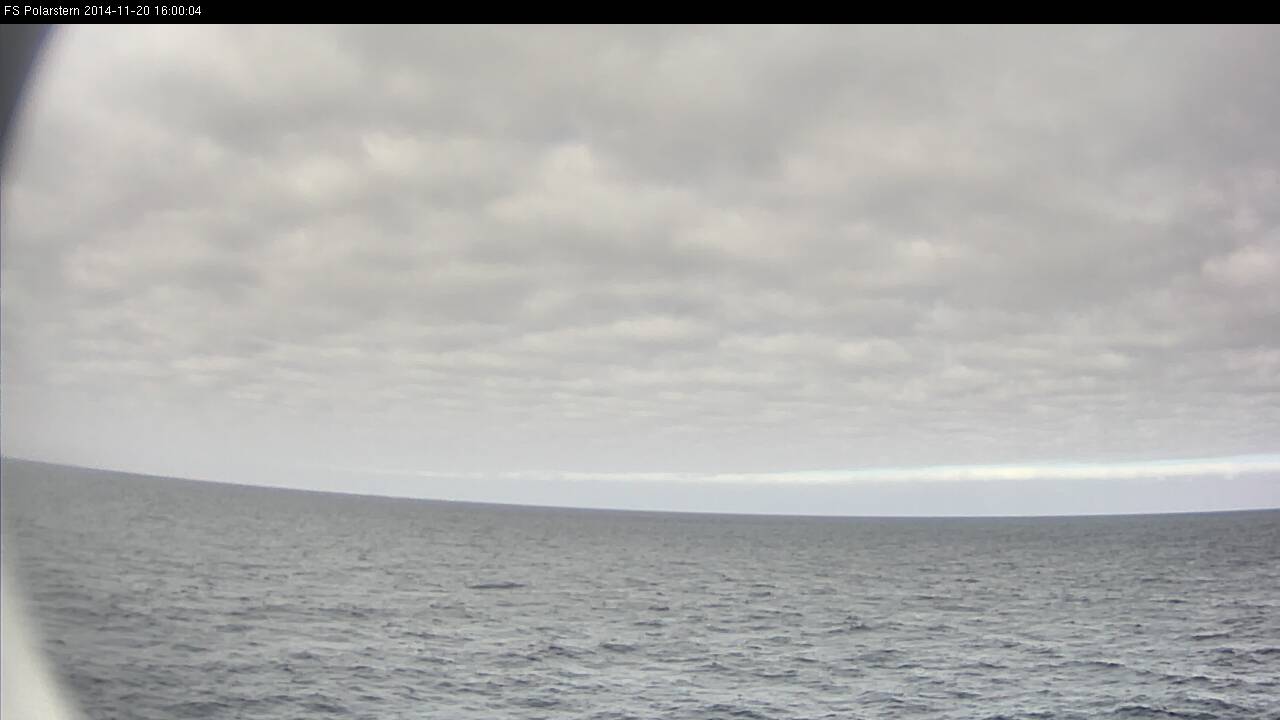
Below: the view from the webcam at the back of the vessel.
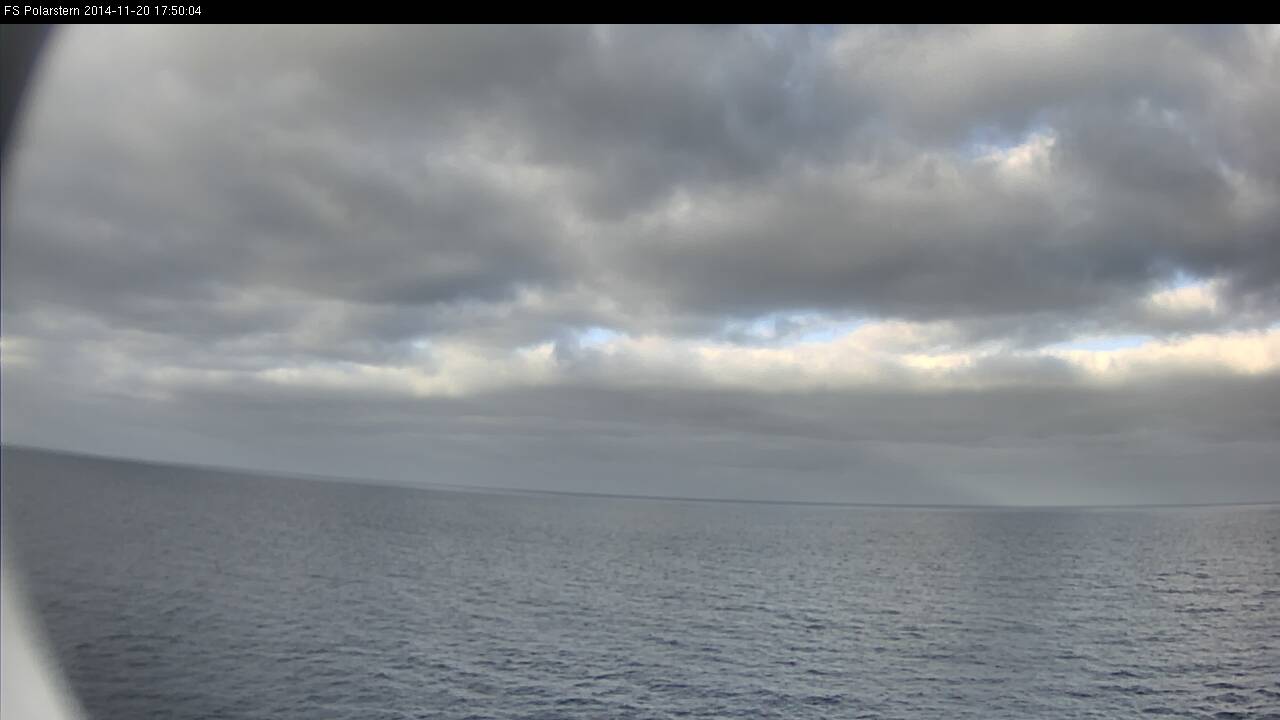
At 17:00 UTC (Figure L1-4c) the vessel is close to the island and at the tip of the V-shape.
The border of the stratocumulus layer is quite distinct (2).
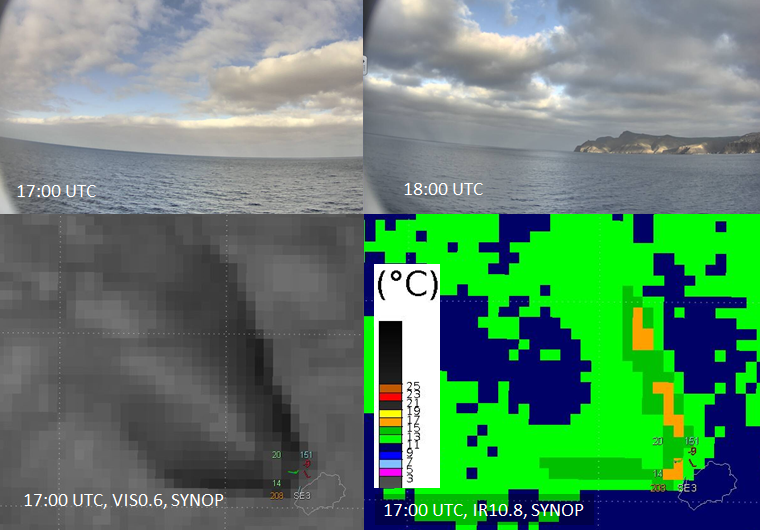
Figure L1-4d: 20 Nov 2014. Above: Webcam at 17:00 and 18:00 UTC.
Below: 17:00 UTC, VIS0.6 and IR10.8, both with measurements from SYNOP. Source: DWD.
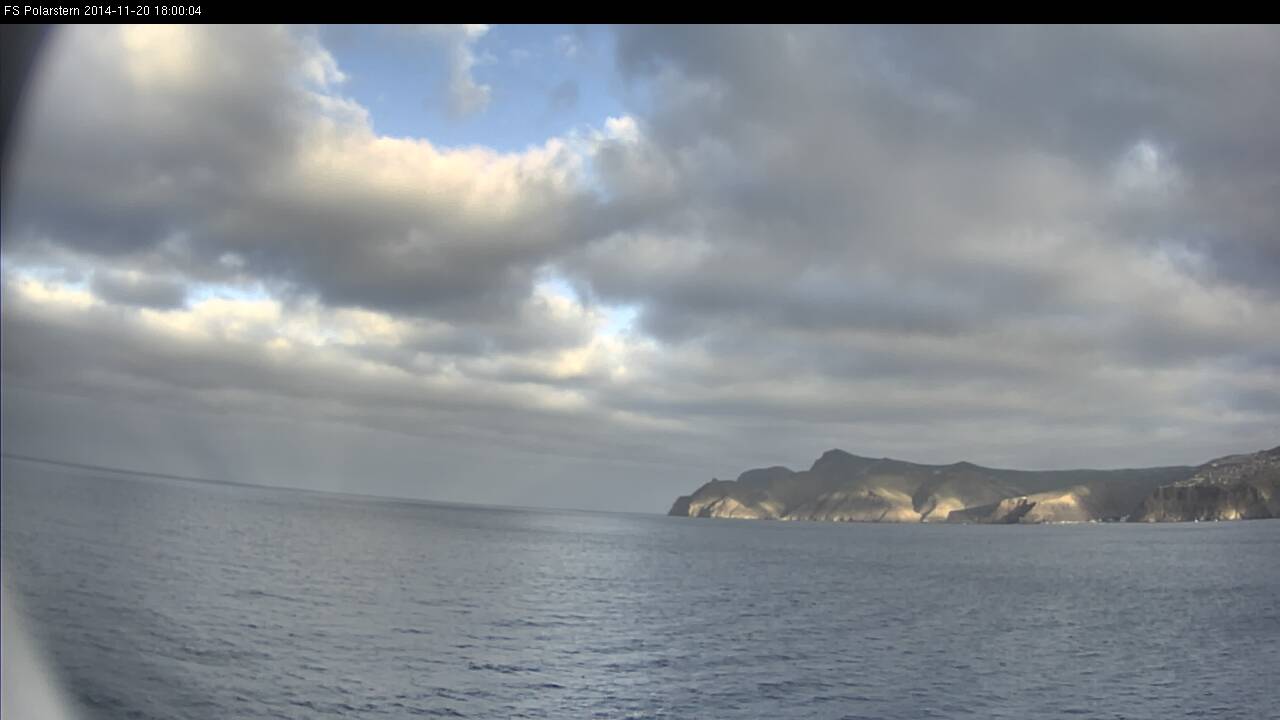
Figure L1-4d shows the ship's arrival at Saint Helena at 18:00 UTC at the head of the V-shape.
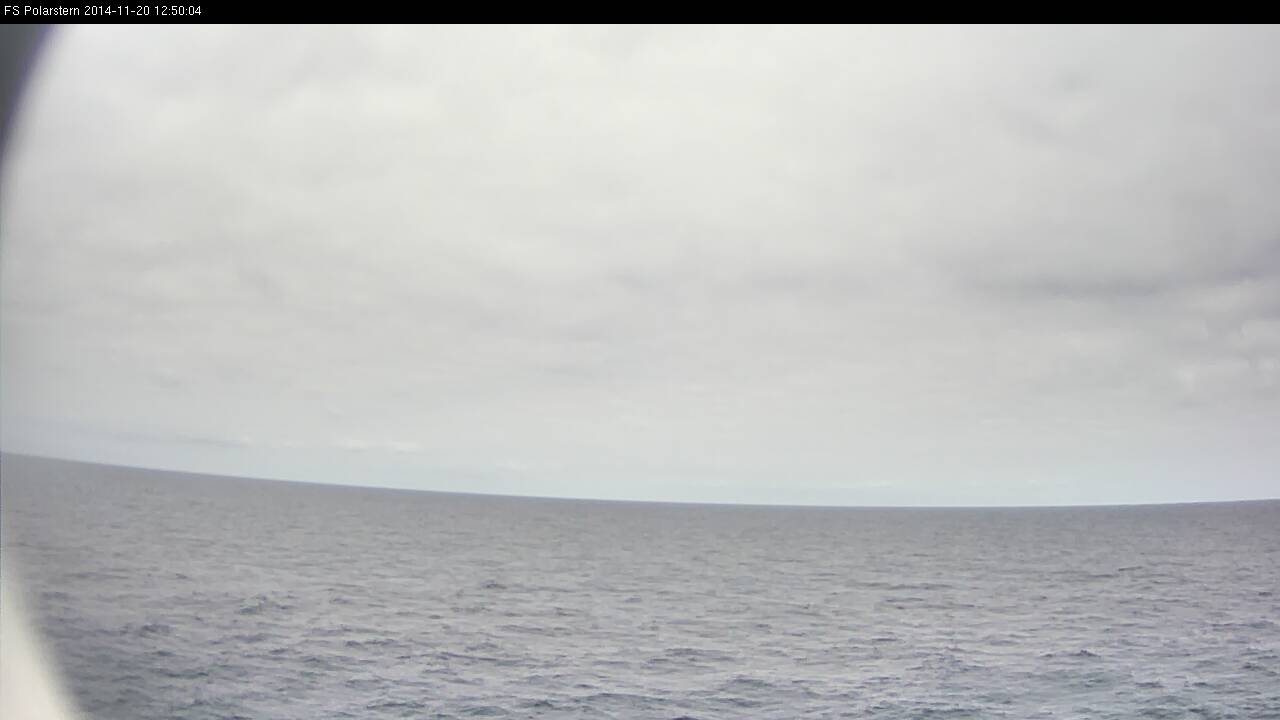
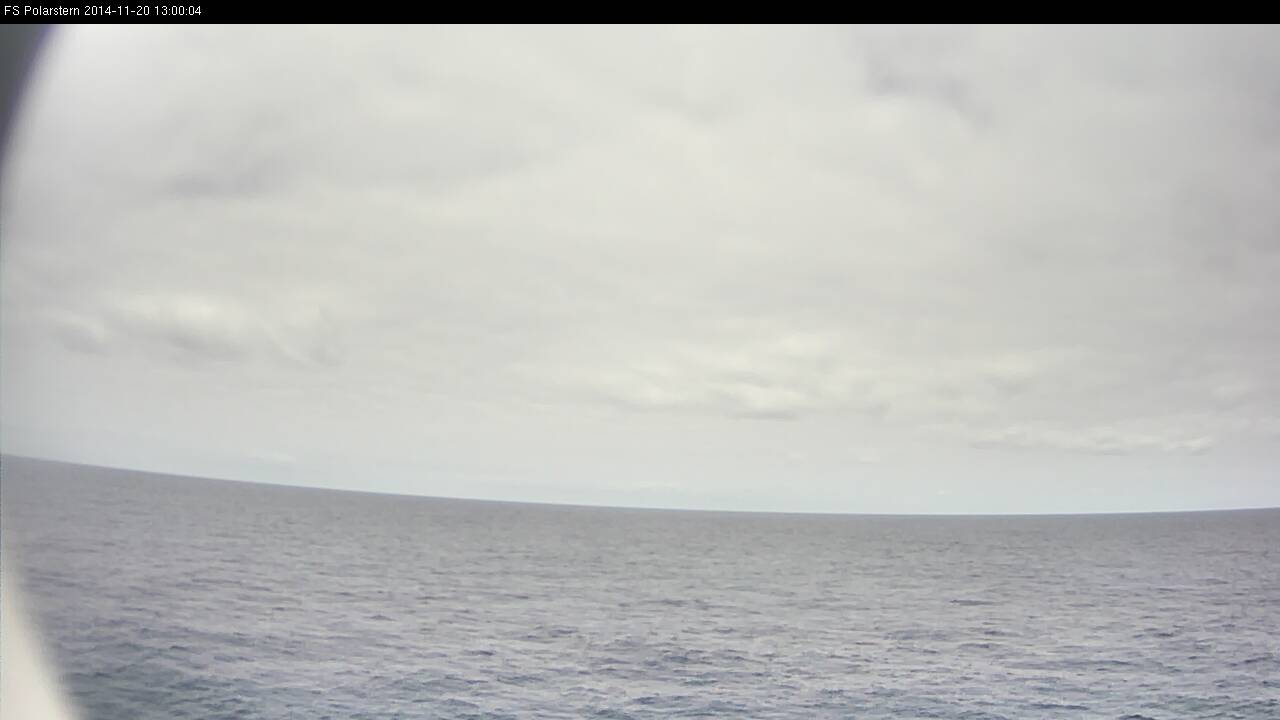
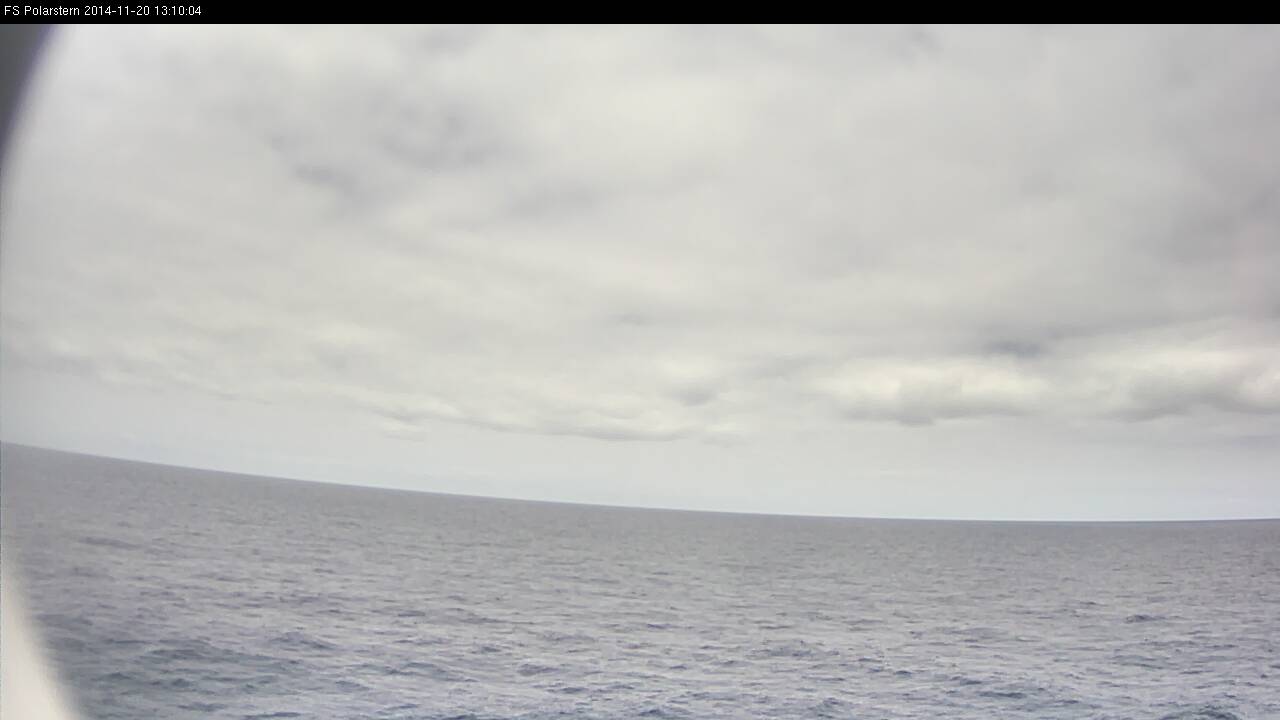
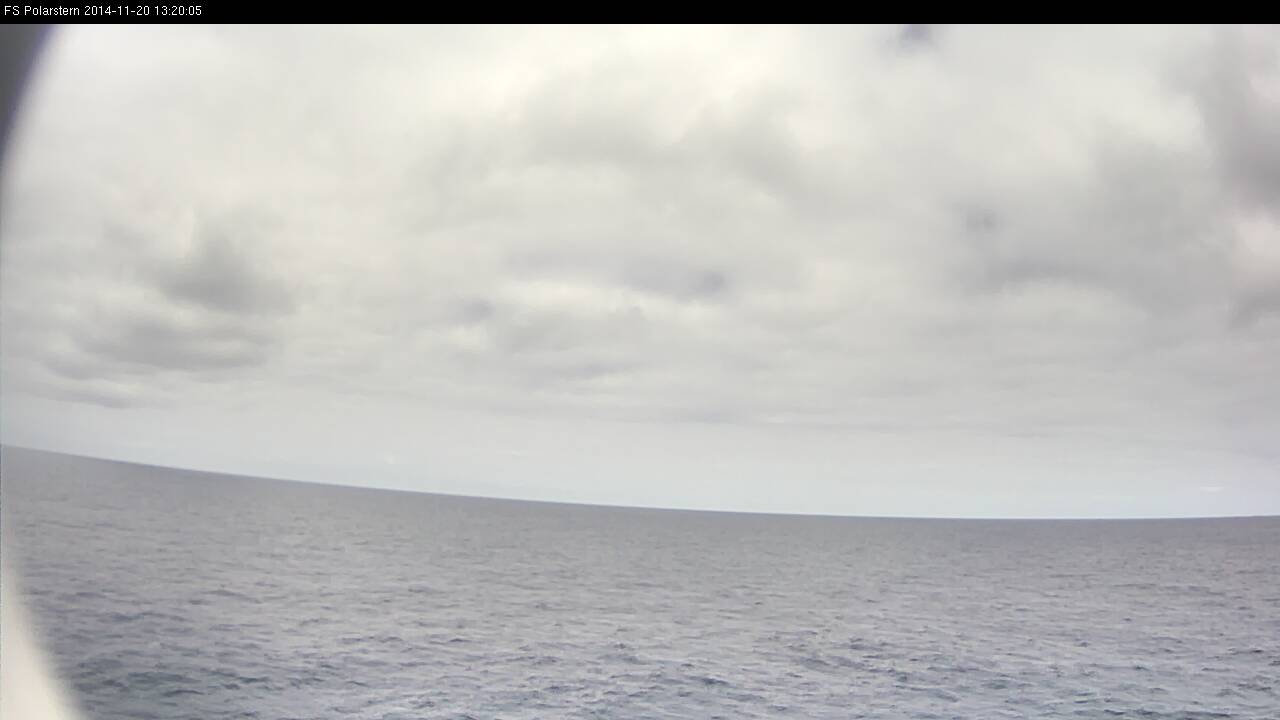
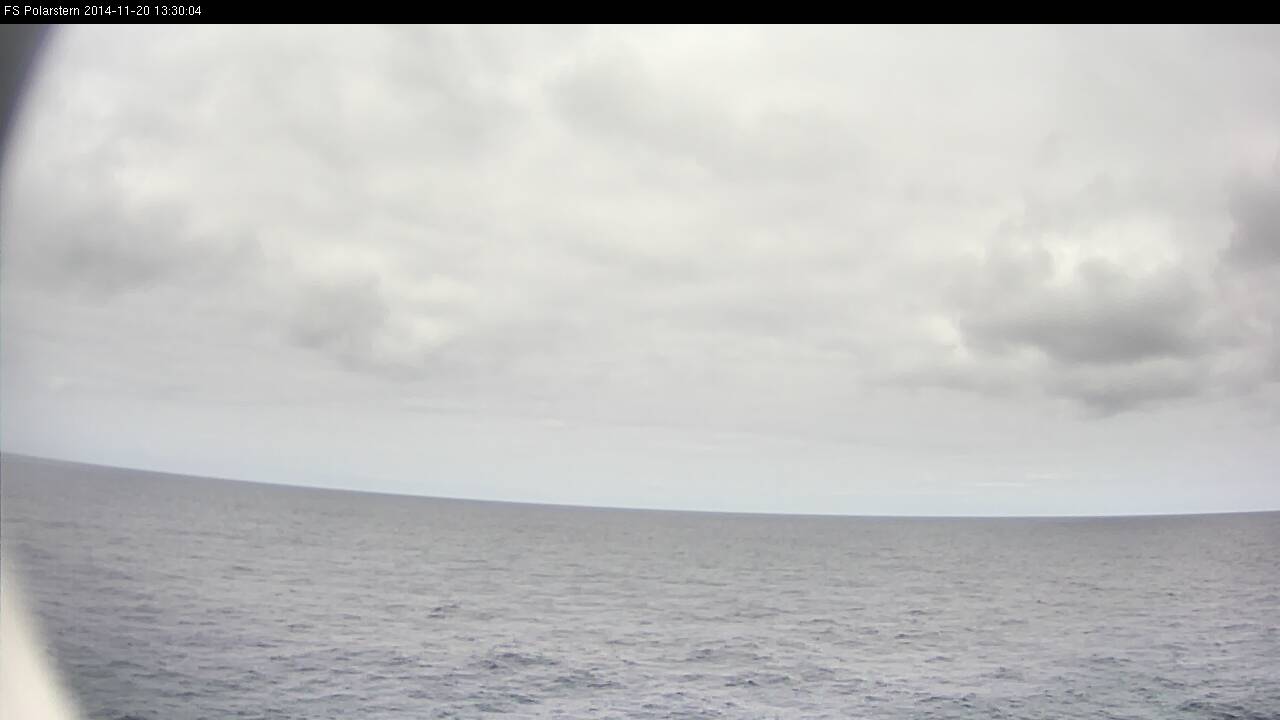
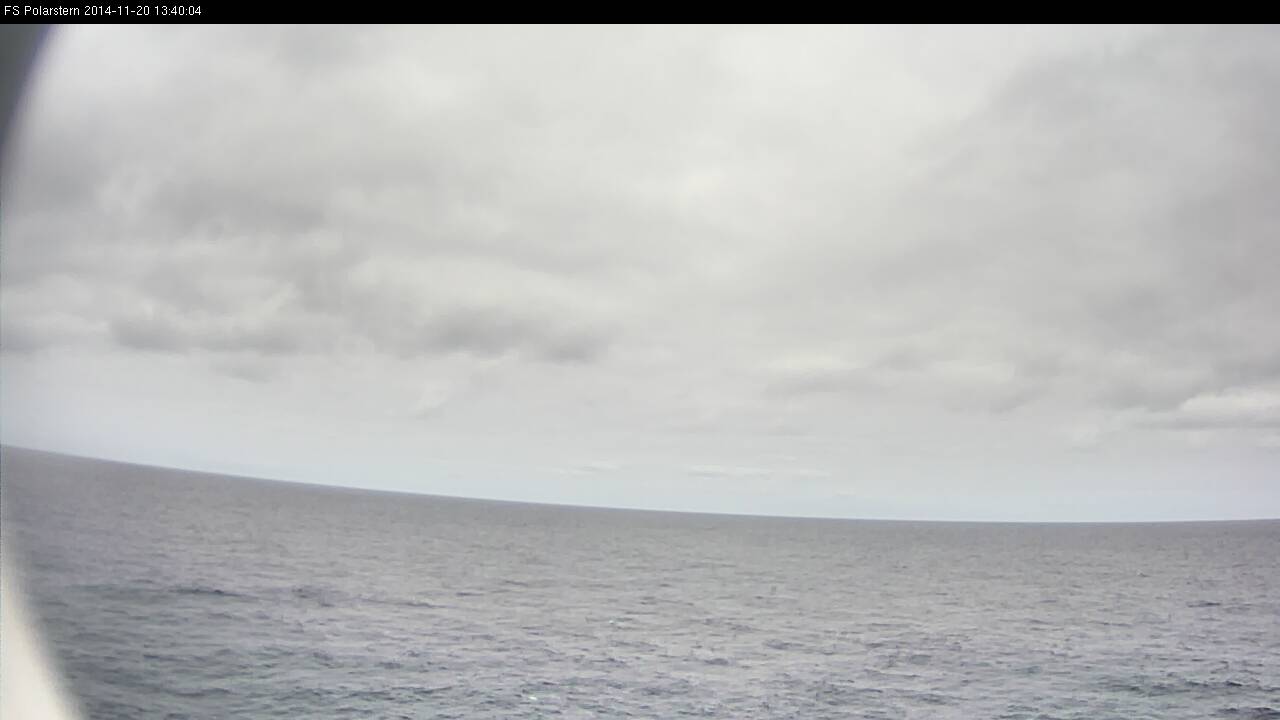
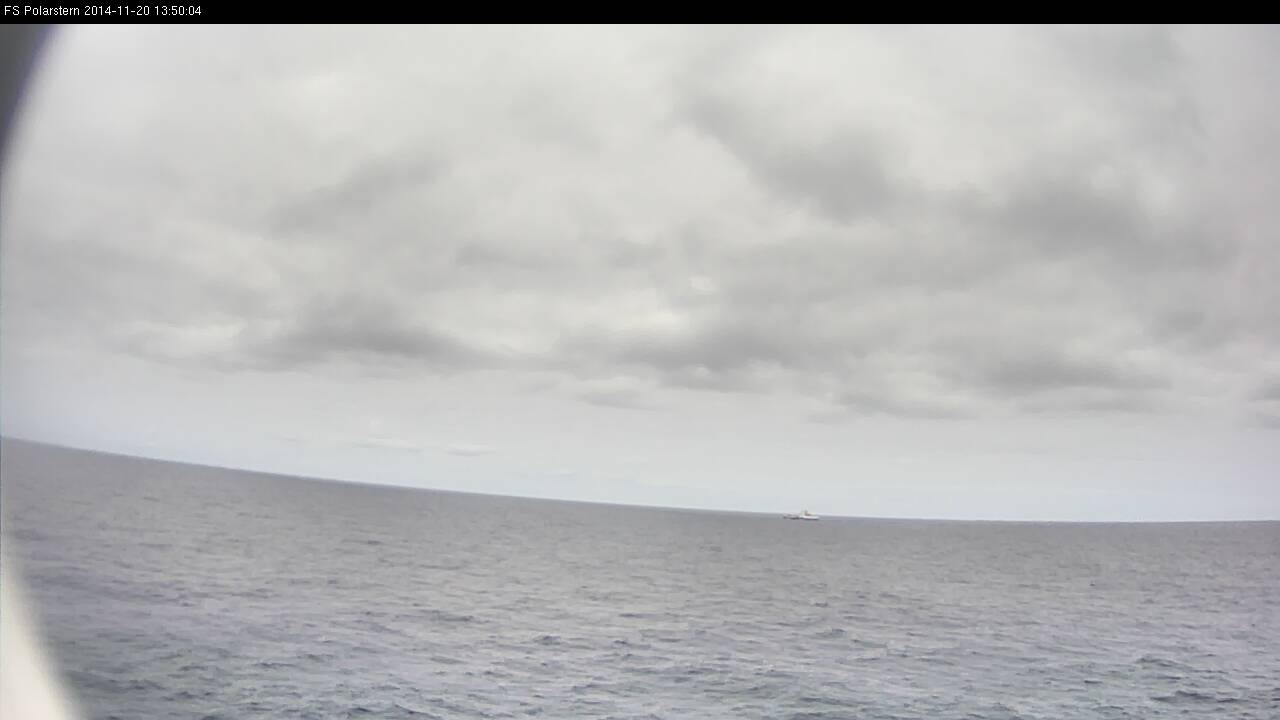
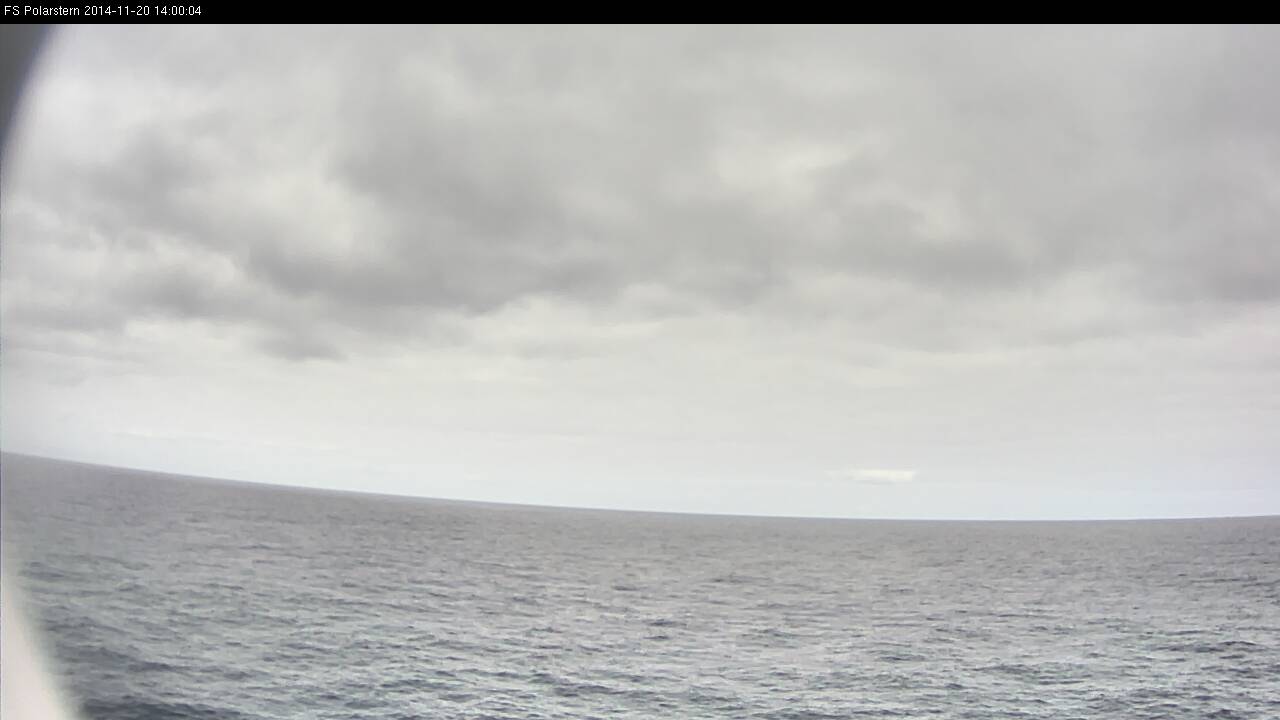
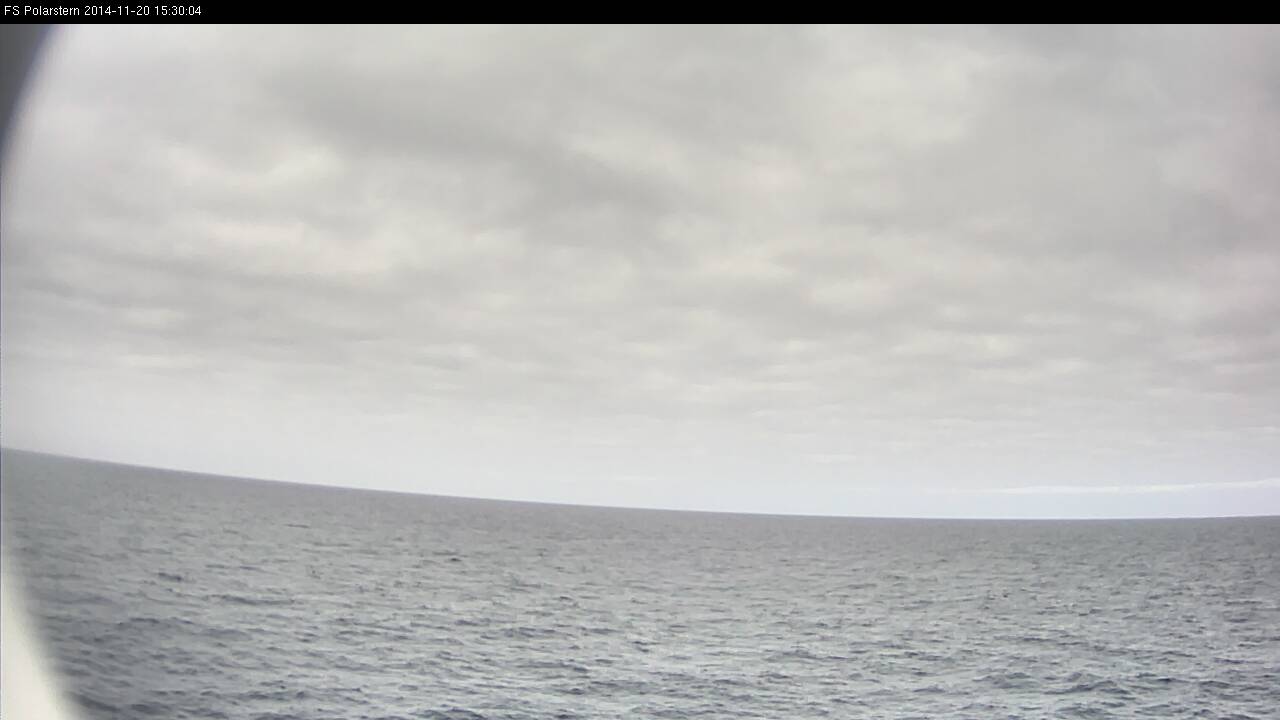
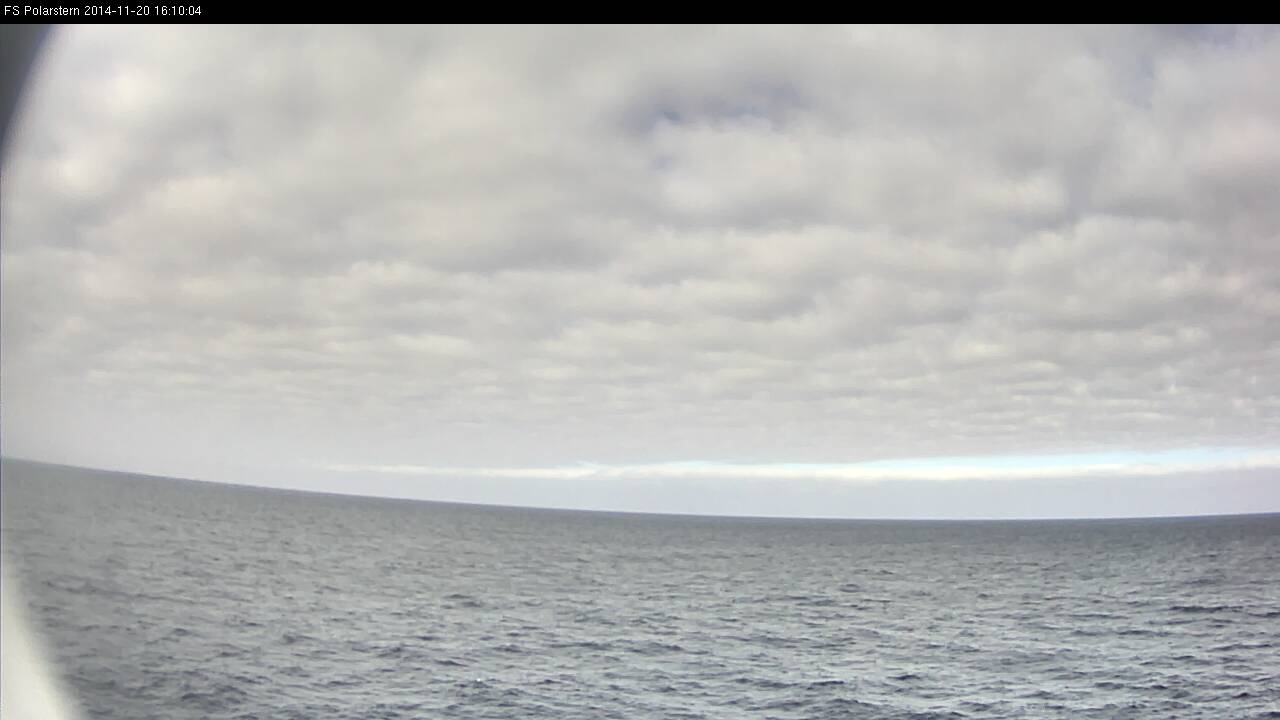
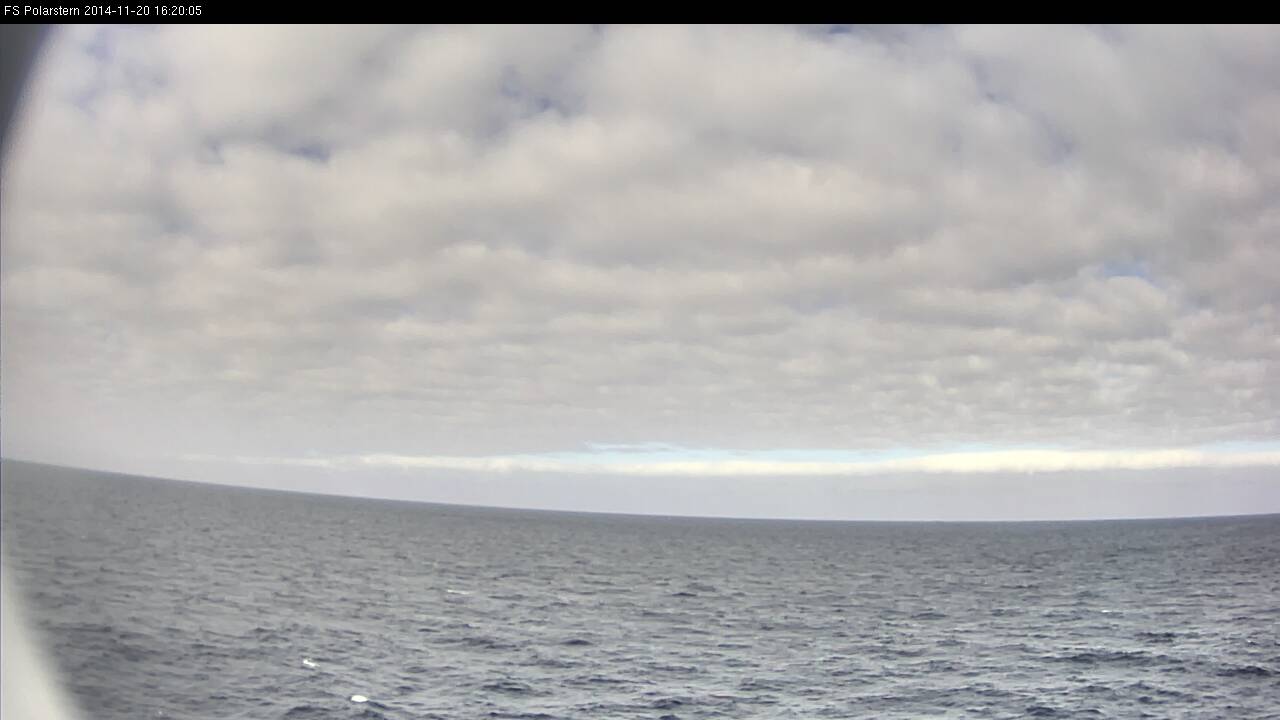
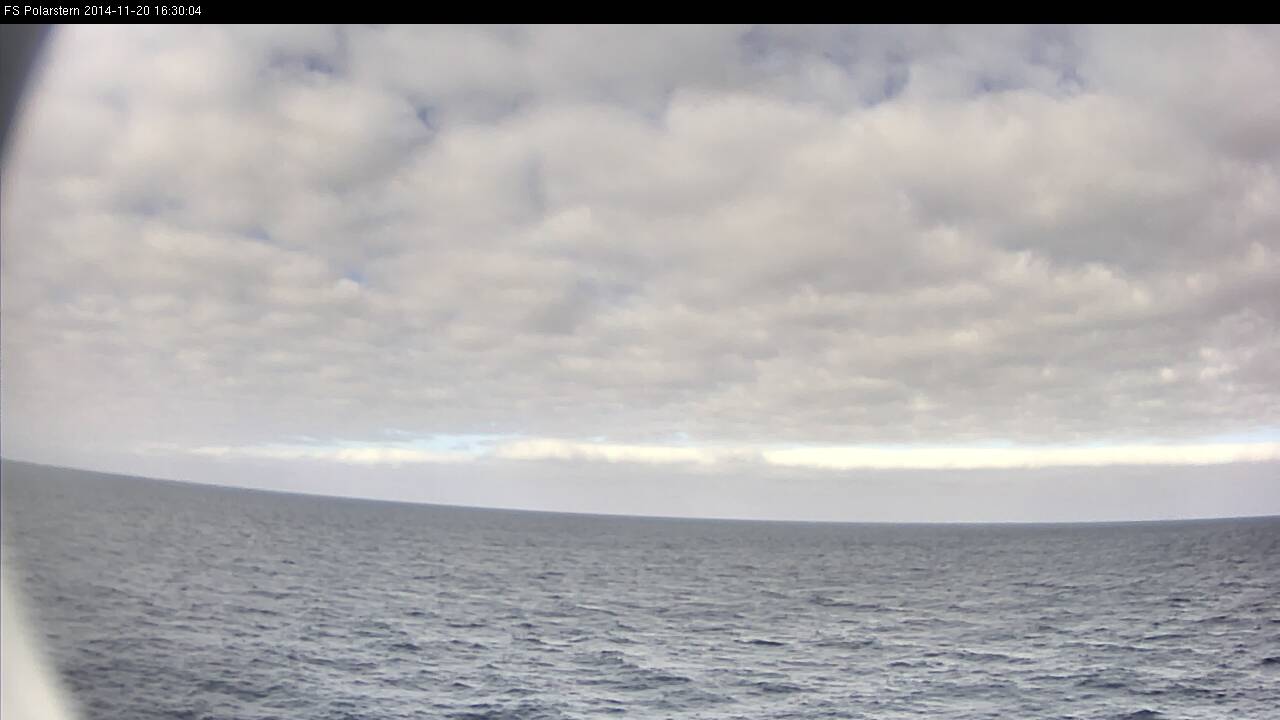
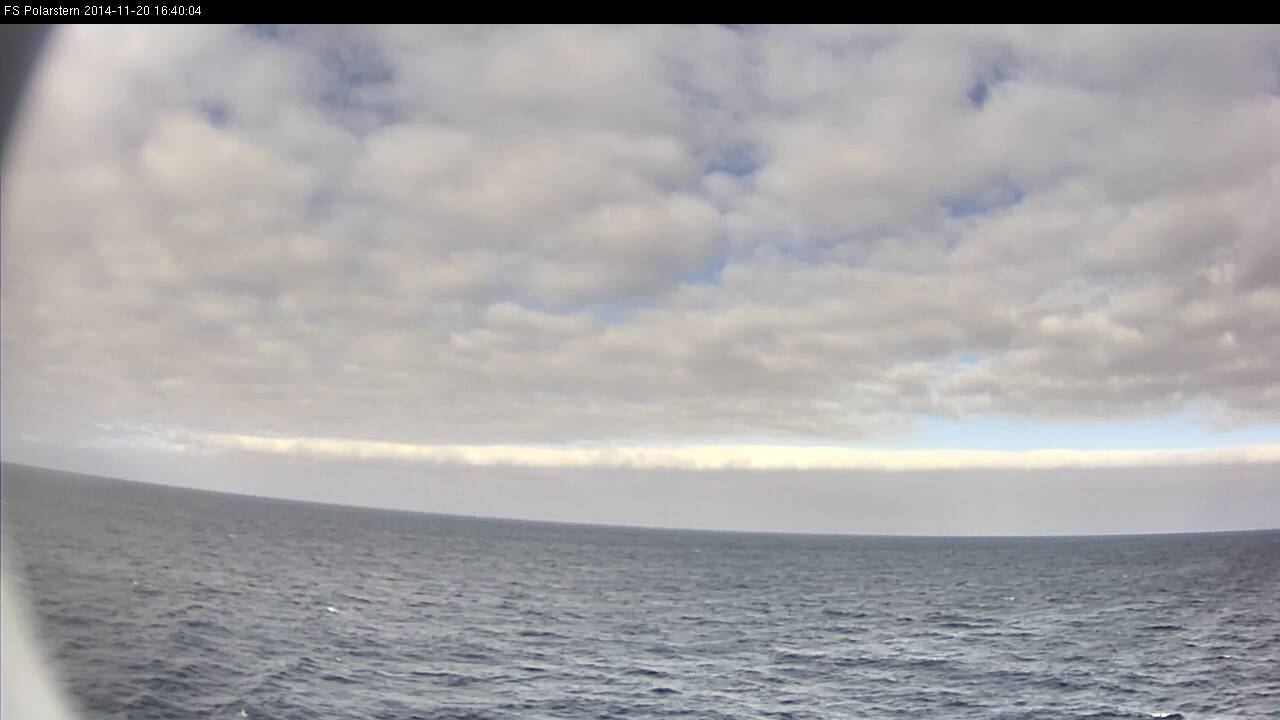
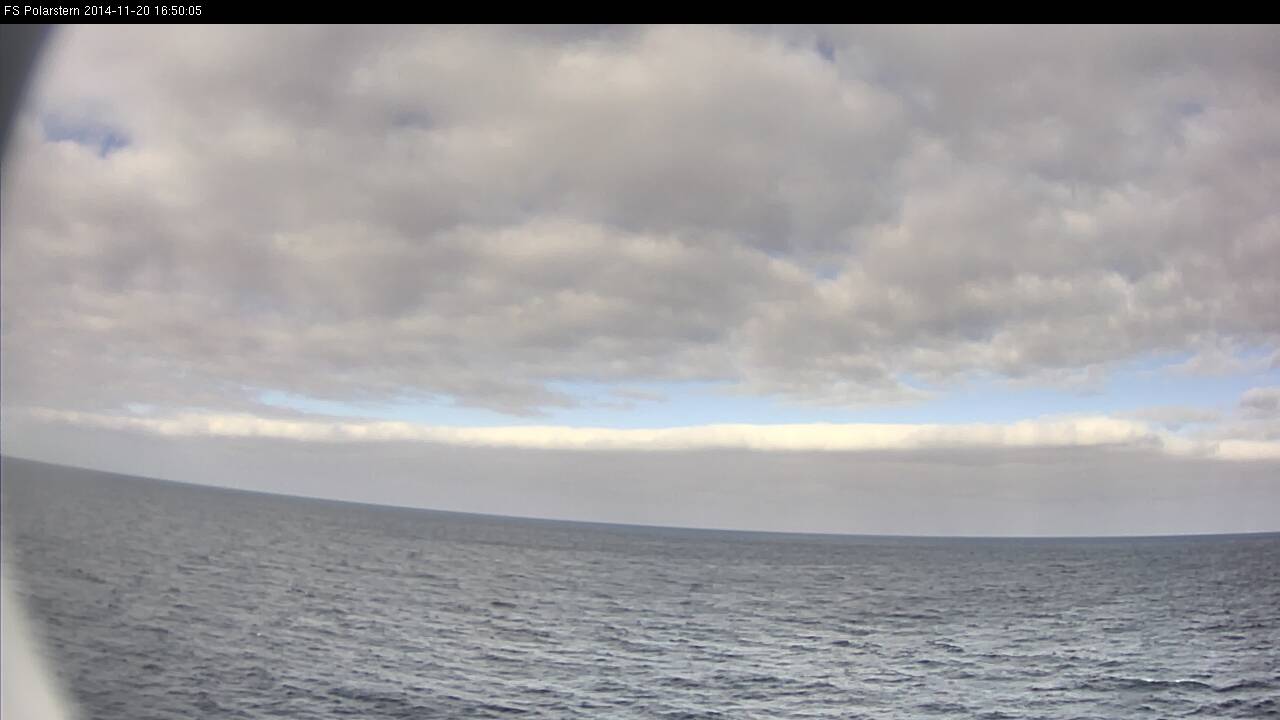
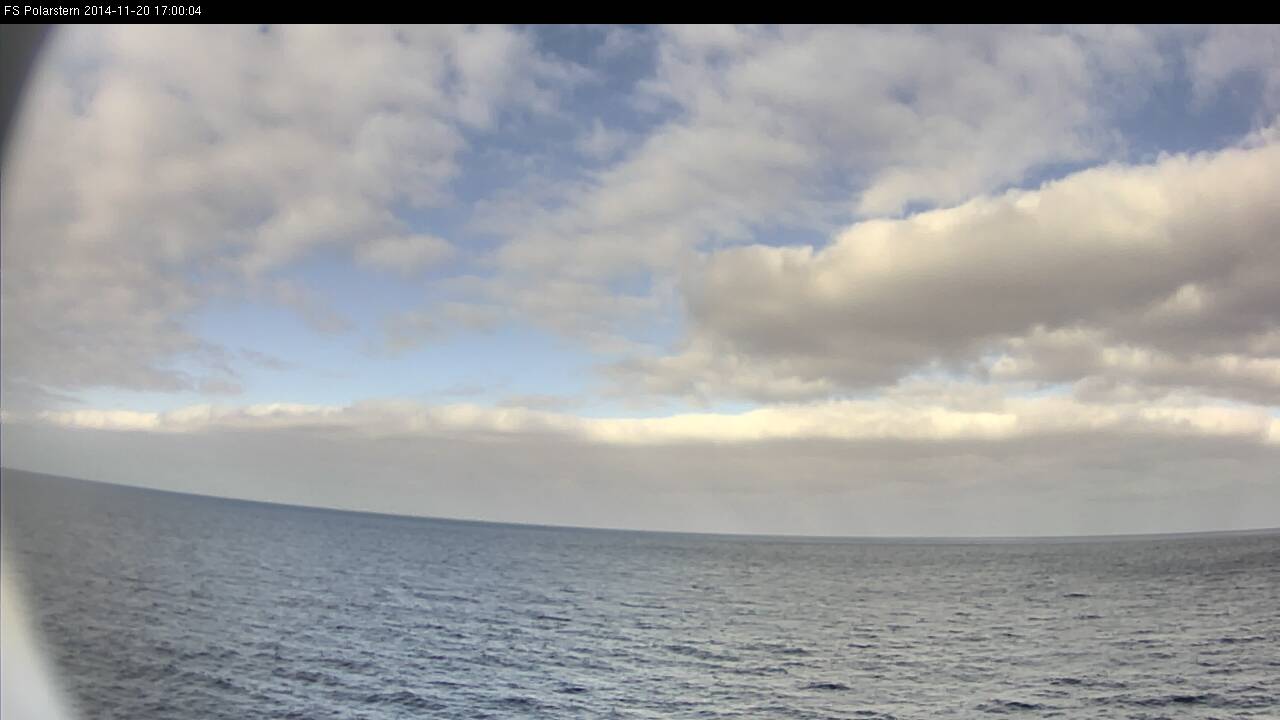
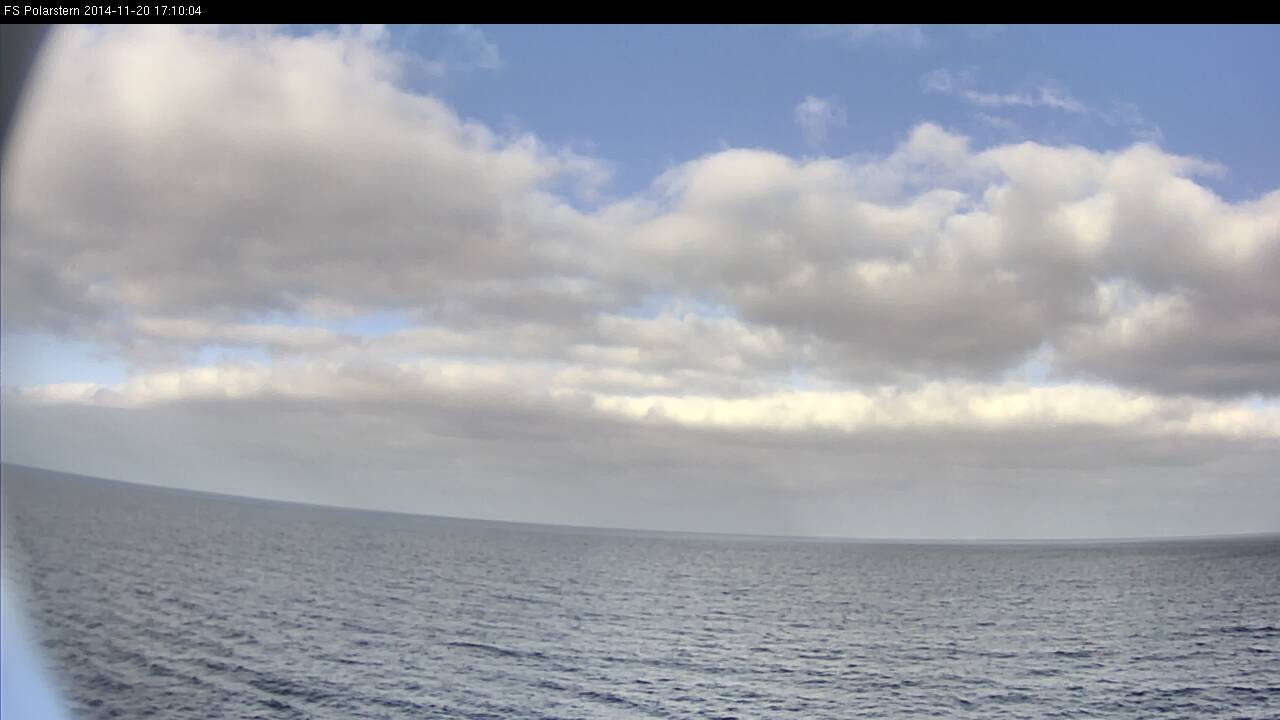
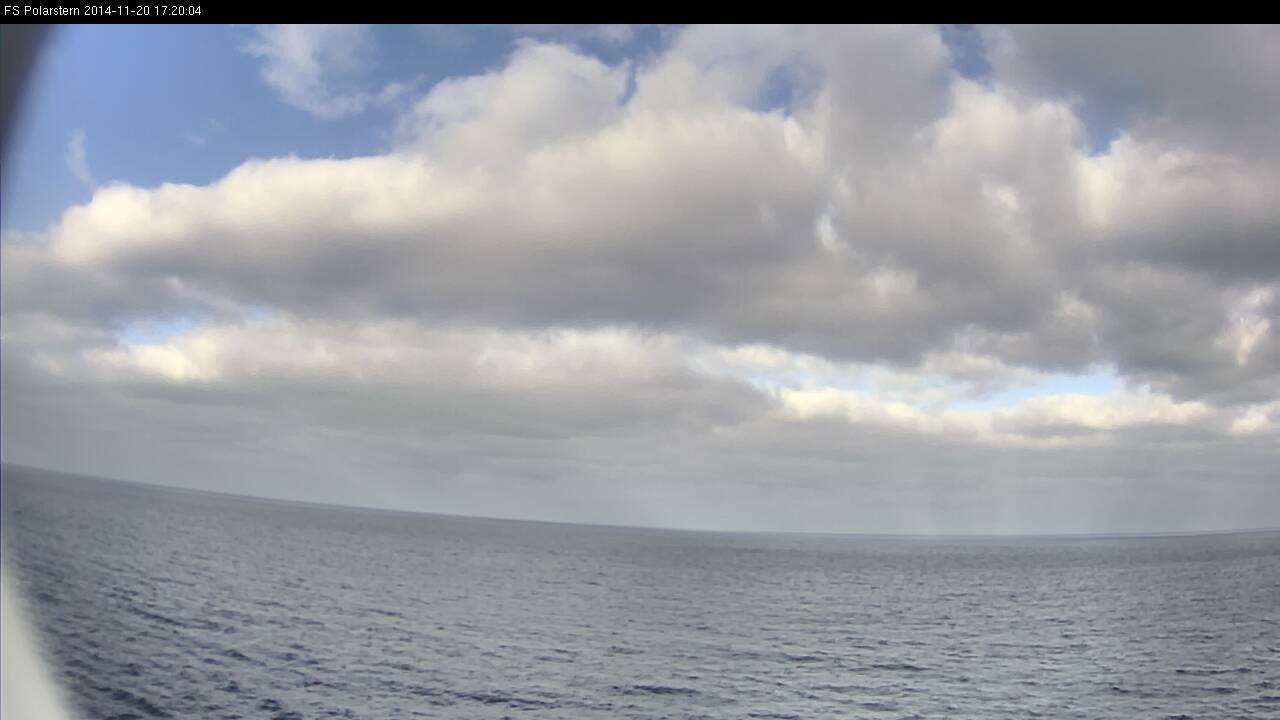
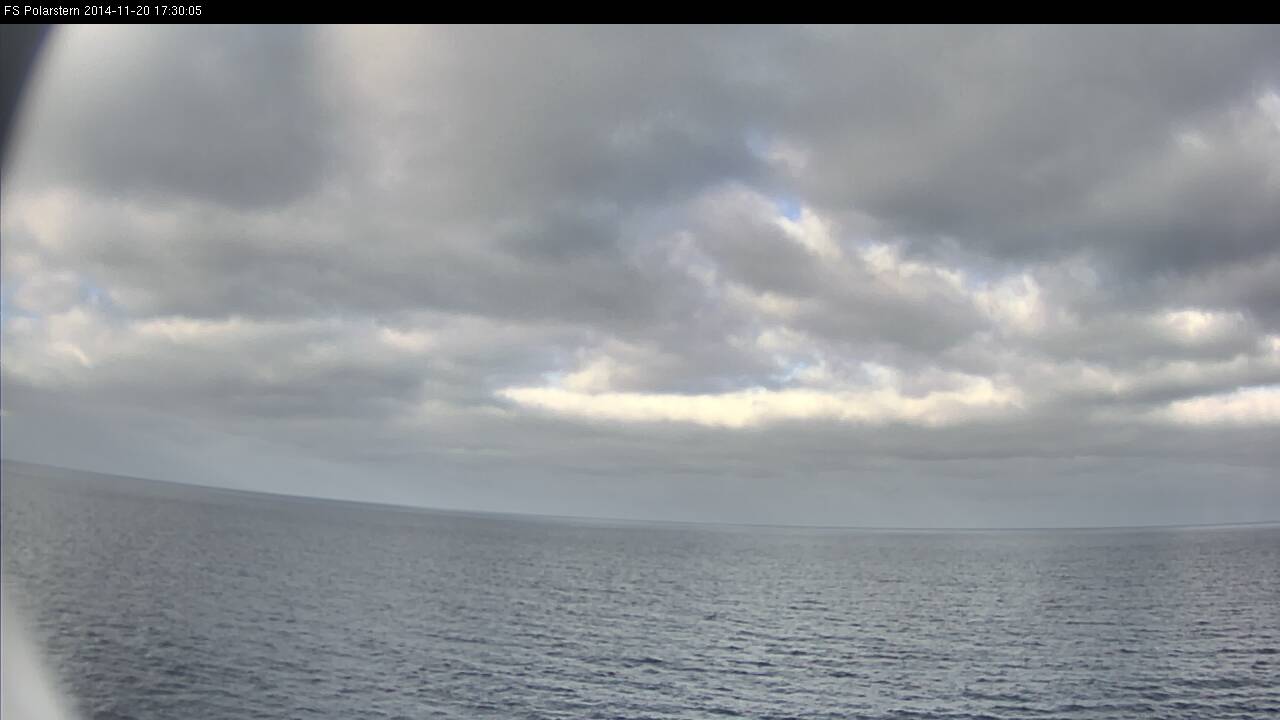
Here you can see a loop of the webcam images from 12:00 UTC - 18:00 UTC in steps of 10 minutes. During the first 2-3 hours virgas are falling from the thick layer of stratocumulus and cumulus, as the observer reported in the SYNOP. From 15:30 UTC the well-marked cloud edge comes nearer and nearer. At 18:00 the island of Saint Helena comes into view.
Loop 1: Note - click on the loop to go through individual images
In Figure L1-5 we see the result of a vertical velocity field downwind of a symmetrical obstacle. A light downward motion is predominant inside the V, which concurs with the observation of reduced cloudiness. In the center behind the island the figure shows a strong change between upward and downward motion with the result of marked transverse waves. In our case we only get to see hints of this.
Similar cloud wakes are produced from two of the Juan Fernandez Islands off the coast of Chile. Both produced a giant V shape of cloud-free air with the island as the base. This V structure's formation depends on the shape and height of the island, the wind conditions, and the ratio of temperature and dew point seen in the radio sounding.
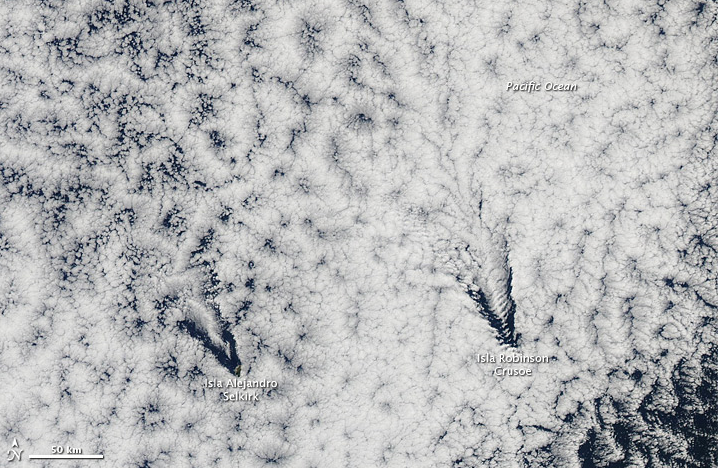
Figure L1-5: Cloud wakes from the Juan Fernández Islands. Source: NASA Visible Earth
The V shape with cloud waves in the lee of the right island in Fig. L1-5 is analogous to the V shape seen from the Polarstern in Fig. L1-6.
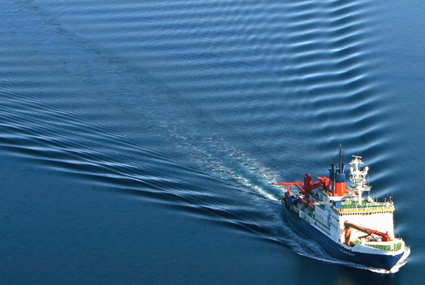
Figure L1-6: Waves in the Polarstern's wake. Source: Alfred Wegener Institute.
Cloud wakes often exist behind small islands and may be accompanied by flow sepatation and turbulence.
In water, wakes are wave patterns on the water's surface downstream of an object in a flow, or produced by a moving ship.