
olive
Tropical airmasses with low upper tropospheric humidity appear olive/orange in the Airmass RGB images.
The olive green/orange colour in the Airmass RGB results from a contribution of the green and the red colour beam.
Primarily responsible for the green contribution is the brightness temperature difference (BTD) of channels IR9.7 and IR10.8 on the green colour beam (see recipe). The smaller the difference between both BTD, the stronger the green contribution. The channel IR9.7 is responsive to ozone gas concentration in the lower stratosphere. Tropical regions are characterised by a high tropopause level and, hand in hand, by a higher altitude of the ozone rich stratospheric air. As the air mass is ozone poor in the levels where IR9.7 has its contribution maximum, the resulting BTD is small.
Due to low mid and upper level tropospheric humidity, the BTD WV6.2-WV7.3, which determines the red colour beam, is small (see WV6.2 image below), the absoption of IR radiation emitted by the earth surface is weak for both WV channels. The scale for the red colour beam is chosen this way, that small BTD lead to high contributions of the red colour.
The contribution from the blue colour beam is rather small, if not zero. The temperature scale for channel WV6.2 is chosen such that warm air masses give little contribution when clouds are not present.
The Airmass image below shows the region of the South-Atlantic. Olive green patches can be seen within a largely green background. These olive areas correspond to dry tropospheric regions as can be seen in the WV6.2 image.

Explanation of the colour of dry tropical airmasses in the Airmass RGB (see also the recipe on the left side):
• Tropical air masses are characterised by their olive/orange colour in the Airmass RGB. The colour results from a high contribution of the green and red colour beam.
• The intense green contribution results from a combination of a high tropopause level (warm airmass) and a low ozone concentration in the level of highest instrument sensitivity.
• The intense red contribution results from a small BTD for both WV channels.
Cloud free land surfaces appear olive green in the HRV Cloud RGB images.
Land, vegetated or bare soil, depicts in olive green colours in the HRV Cloud RGB. Due to rather high temperatures of the ground, the contribution from the blue colour beam does not play an essential role in the HRV Cloud RGB.
The HRV channel, contributing with the red and green colour beam, is responsible for the greenish colour of the soil. In fact, the red and green beam have the same intensity. A mixture of red and green normally results in yellow. In fact when yellow gets darker, i.e. the red and the green colour beam are weak but of same intensity, the human eye sees the mixture of both as a green tone.
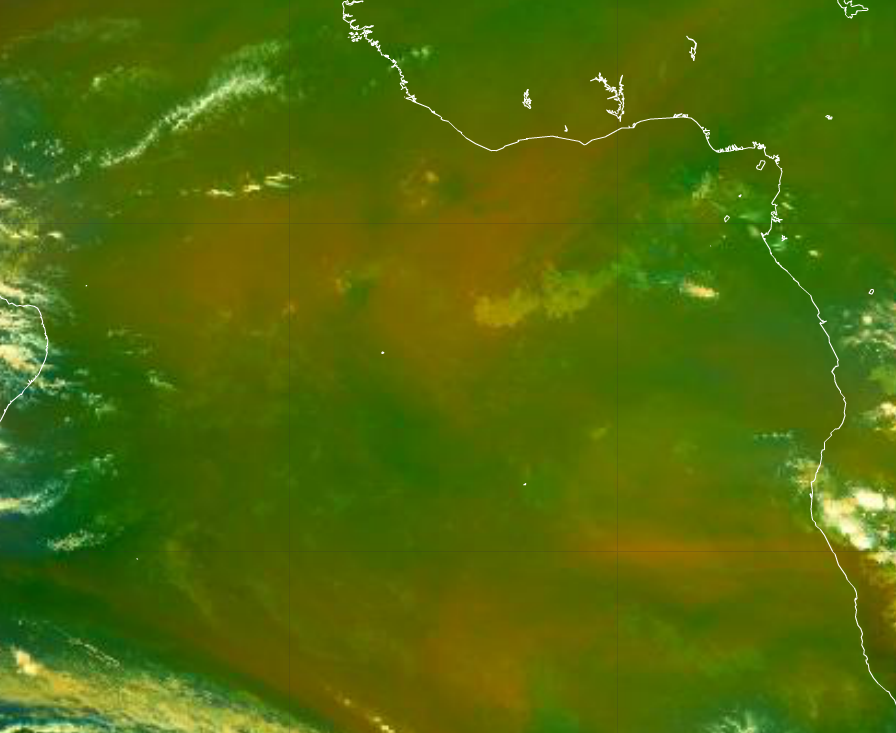
The image below shows the African sand desert in olive green colours. Sand has a relatively high albedo while vegetated land and rocks have a smaller albedo. This can be seen in the image below which shows the sandy Saharian desert and in contrast vegetation covered land near the coast.
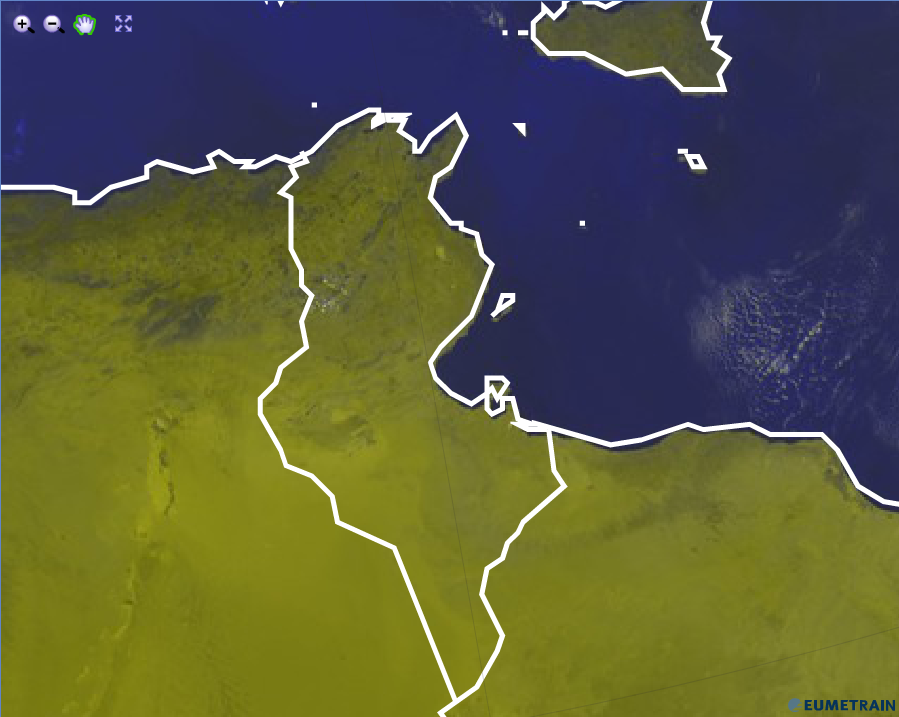
HRV Cloud RGB from 29 July 2015, 12:00 UTC
Explanation of the olive green colour of cloud free land surfaces in the HRV Cloud RGB (see the recipe):
Land surfaces are characterised by their albedo in the HRV Cloud RGB. Moderate red and green contributions combine to an olive green which becomes darker when the albedo reduces (e.g. vegetation).

Tropical airmasses with low upper tropospheric humidity appear olive/orange in the Airmass RGB images.
The olive green/orange colour in the Airmass RGB results from a contribution of the green and the red colour beam.
Primarily responsible for the green contribution is the brightness temperature difference (BTD) of channels IR9.7 and IR10.8 on the green colour beam (see recipe). The smaller the difference between both BTD, the stronger the green contribution. The channel IR9.7 is responsive to ozone gas concentration in the lower stratosphere. Tropical regions are characterised by a high tropopause level and, hand in hand, by a higher altitude of the ozone rich stratospheric air. As the air mass is ozone poor in the levels where IR9.7 has its contribution maximum, the resulting BTD is small.
Due to low mid and upper level tropospheric humidity, the BTD WV6.2-WV7.3, which determines the red colour beam, is small (see WV6.2 image below), the absoption of IR radiation emitted by the earth surface is weak for both WV channels. The scale for the red colour beam is chosen this way, that small BTD lead to high contributions of the red colour.
The contribution from the blue colour beam is rather small, if not zero. The temperature scale for channel WV6.2 is chosen such that warm air masses give little contribution when clouds are not present.
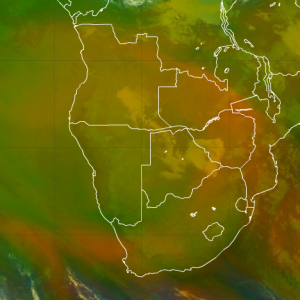
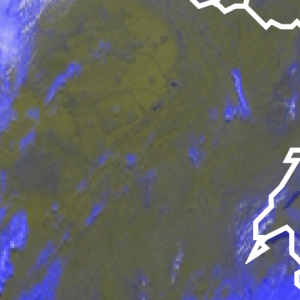
The Airmass image below shows the region of the South-Atlantic. Olive green patches can be seen within a largely green background. These olive areas correspond to dry tropospheric regions as can be seen in the WV6.2 image.

Airmass RGB for 3 February 2016 18:00 UTC
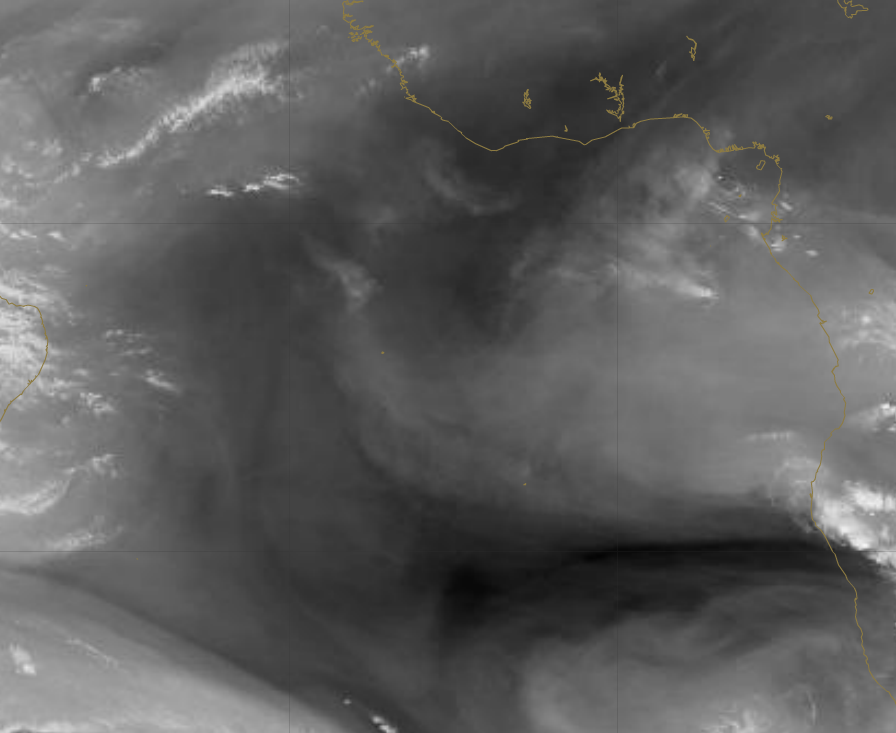
WV6.2 RGB for 3 February 2016 18:00 UTC
Explanation of the colour of dry tropical airmasses in the Airmass RGB (see the recipe):
• Tropical air masses are characterised by their olive/orange colour in the Airmass RGB. The colour results from a high contribution of the green and red colour beam.
• The intense green contribution results from a combination of a high tropopause level (warm airmass) and a low ozone concentration in the level of highest instrument sensitivity.
• The intense red contribution results from a small BTD for both WV channels.