
orange
Semitransparent ice clouds can be shown in several colours in the Snow RGB images: from orange, yellowish to pale blue colours.
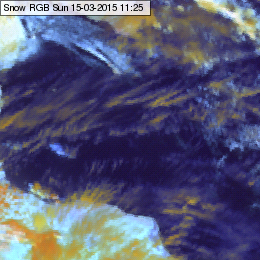
The colour of the thin cirrus is in between the colour of the thick ice cloud (orange) and that of the underlying cloud or surface. Thicker cirrus clouds are orange, thin cirrus clouds can also appear orange (over thick ice clouds or snowy land), light blue (over desert), pale blue (over sea), light yellowish (over water clouds) etc. The image below shows cirrus clouds over sea and desert.
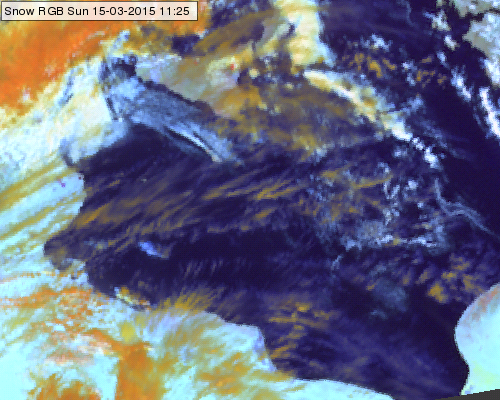
Meteosat, SEVIRI Snow RGB image for 15 March 2015 11:25 UTC
Thin cirrus looks like a yellowish, bluish veil, see the images below. The images below show thin cirrus clouds over snow, water clouds, land and sea.
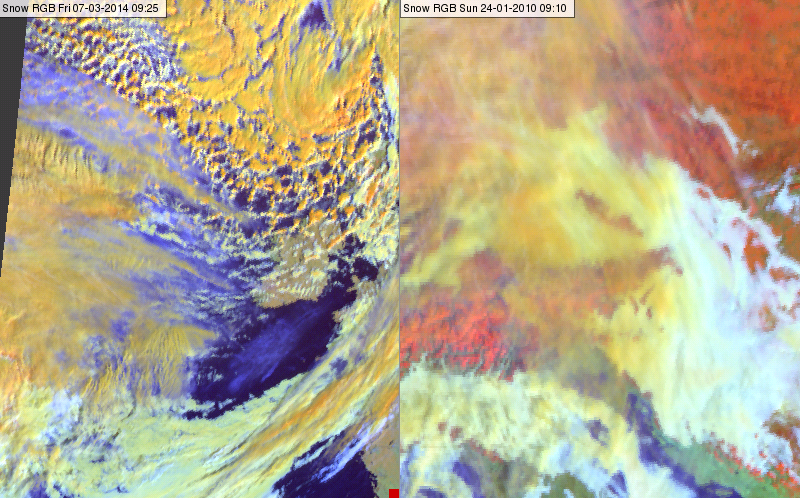
Meteosat, SEVIRI Snow RGB images for 07 March 2014 09:25 UTC (left) and 24 January 2010 09:10 UTC
Explanation of the colours of the semitransparent clouds (see the recipe):
In case of semitransparent clouds the satellite measures mixed radiation consisting of the radiation emitted or reflected by the semitransparent cloud itself and the radiation originated from below and transmitted through it. That is why the colour of a semitransparent cloud depends not only on the characteristics of the cloud itself, but also on the transparency and the colour of the underlying surface.
• The colour of the almost thick semitransparent cloud approximates the colour of the thick ice clouds (orange).
• The colour of the very thin cirrus clouds approximates the colour of the underlying clouds or surface (orange, white, dark blue, red, green, light blue).
• The colour of the thin cirrus is between the colour of the thick ice cloud and that of the underlying cloud or surface.
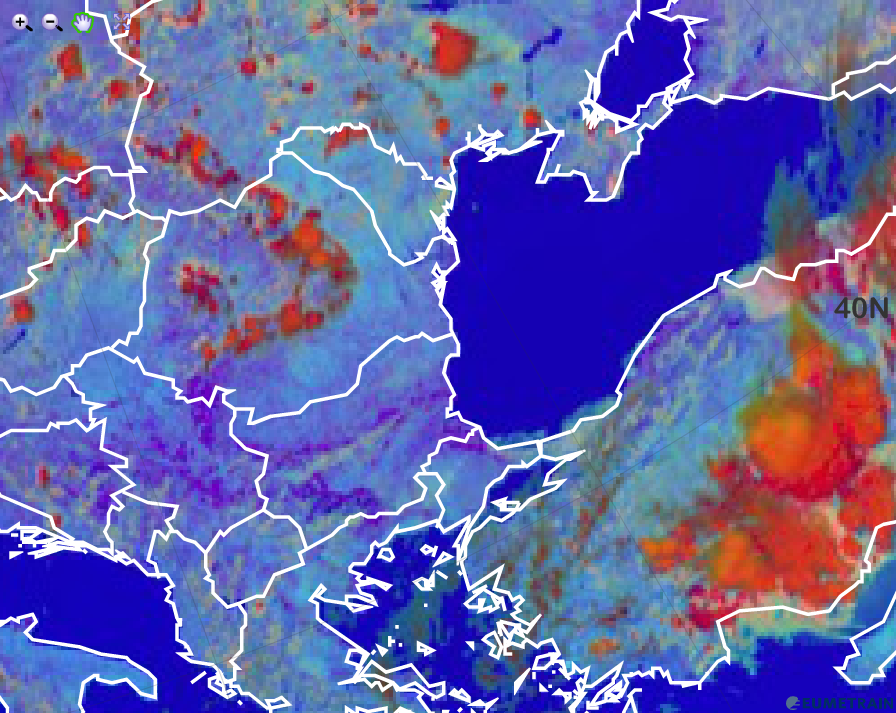
Thick ice clouds usually appear orange in the Snow RGB images. Thick ice clouds with small ice crystals on the top appear light orange, or light yellow.
The left image and the next two images show frontal cloudiness. Snow is seen in the Alps, Carpathian Mountains, Russia, Scandinavia, Iceland and Dinaric Alps.
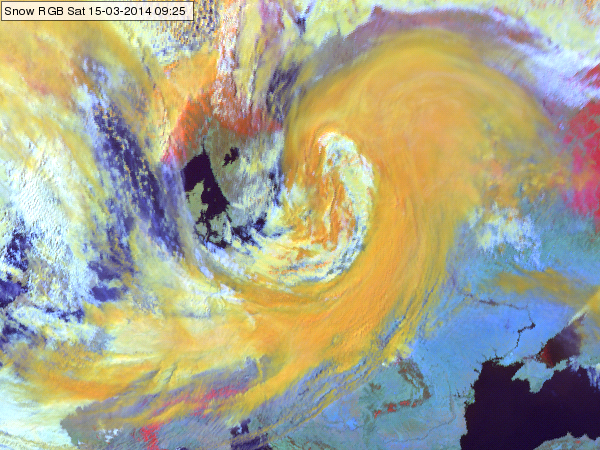
Meteosat, SEVIRI Snow RGB, 15 March 2014 09:25 UTC
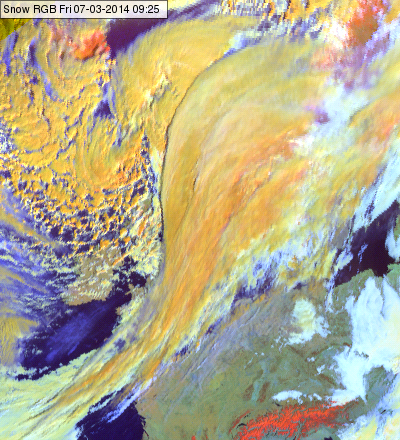
Meteosat, SEVIRI Snow RGB, 07 March 2014 09:25 UTC
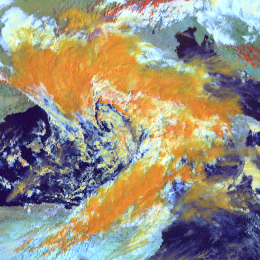
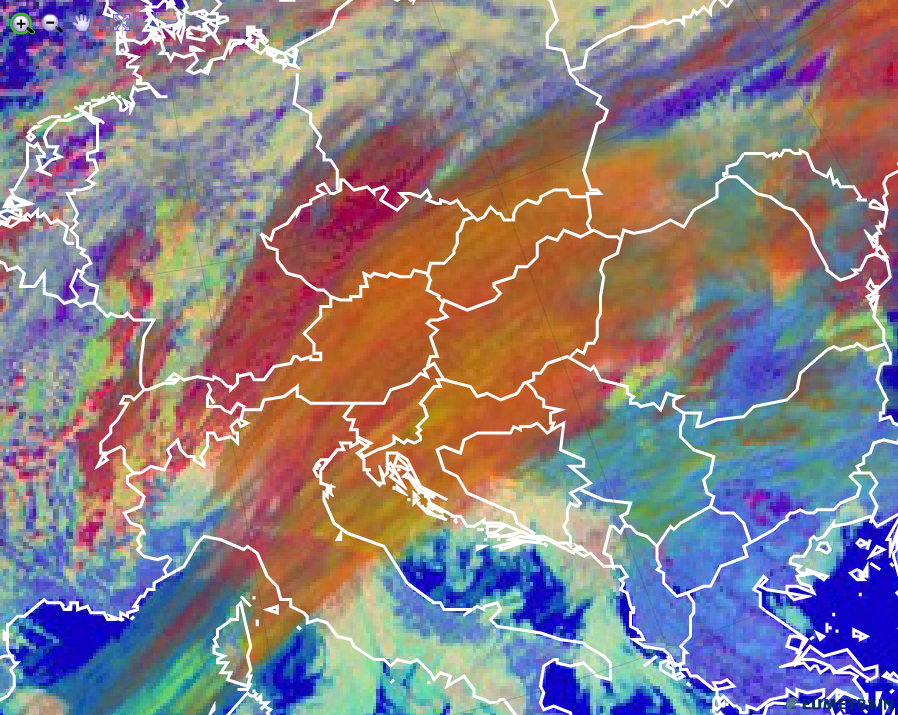
Thick ice clouds usually have large ice crystals on their top appearing orange in the Snow RGB. In case the ice crystals on the cloud top are small the thick ice cloud appears light orange (closer to grey). In case the ice crystals are very small then the cloud is depicted in light yellow occasionally with some greenish tones, see the thicker part of the high level lee clouds south and southwest of the Alps in the image below. High-level lee clouds typically consist of very small ice crystals. (For comparison the Day Microphysics RGB is visualised.)
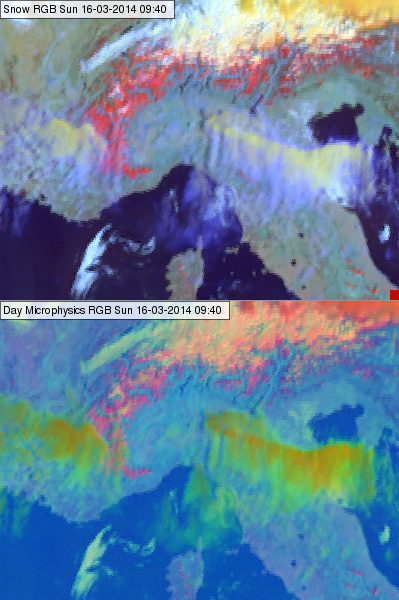
High-level lee clouds with small ice particles in the Snow RGB (up) and Day Microphysics RGB (below) south and southwest of the Alps for 16 March 2014, 09:40 UTC
Explanation of the colours for thick ice clouds (see the recipe):
• The thick ice clouds usually have large ice crystals on their top. The reflectivity of a thick ice cloud is high in the 0.8 micrometer channel, and much lower in the 1.6 and in 3.9 micrometer channels, because ice absorbs the radiation at these wavelengths. The absorption is much stronger at 3.9 than at 1.6 micrometer. Even after the linear stretching and gamma correction the signal is still strongest in the red and weakest in the blue colour beam. As a result the thick ice cloud appears orange.
• If the cloud top ice crystals are small then the green and blue component will be closer to the red component, but still lower. Such a thick ice cloud will appear light orange (closer to grey). In case the crystals are very small than the green component may became equal or even slightly higher than the red component causing light yellow colour occasionally with some green shades.
Small ice particles depict in orange in the Day Microphysics RGB images.
The orange colour of small ice particles in the Day Microphysics RGB images is a mixture of a strong red and a moderate green contribution.
The strongest signal comes from the VIS0.8 channel (red color beam). Ice crystals strongly reflect short wave solar radiation.
The contribution of the solar component of the IR3.9 channel is much weaker. The contribution from channel IR3.9 depends on ice/water phase as well as on drop size. Small ice crystals stronger reflect short wave solar radiation than large ice crystals. Depending on cloud physical processes, we get a range of colours from red to orange according to the intensity of the green colour contribution where orange colour indicates small ice particles.
As the cloud tops are extremely cold, there is almost no contribution from the blue colour beam.
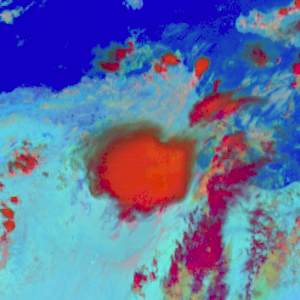
The orange parts of convective cells contain small ice crystals which are a sign for strong updrafts and a rapid developement of the convective cell (see image below). For convective clouds with larger ice crystals (e.g. decaying CBs), the green colour beam is less intense and the orange colour turns into red.
HRV Cloud RGB from 2 June 2015, 12:00 UTC
Cloud tops of warm front are typically composed of small ice crystals. The image below shows such a warm front (orange) over Central Europe.
HRV Cloud RGB from 3 February 2016, 12:00 UTC
Explanation of the orange colour of small ice particles in the Day Microphysics RGB (see the recipe):
• Orange is the mixture of red and green colour. High reflectivity (VIS0.8) combined with moderate contribution from IR3.9 in case of small ice crystals result in orange colour.
Tropical airmasses with low upper tropospheric humidity appear olive/orange in the Airmass RGB images.
The olive green/orange colour in the Airmass RGB results from a contribution of the green and the red colour beam.
Primarily responsible for the green contribution is the brightness temperature difference (BTD) of channels IR9.7 and IR10.8 on the green colour beam (see recipe). The smaller the difference between both BTD, the stronger the green contribution. The channel IR9.7 is responsive to ozone gas concentration in the lower stratosphere. Tropical regions are characterised by a high tropopause level and, hand in hand, by a higher altitude of the ozone rich stratospheric air. As the air mass is ozone poor in the levels where IR9.7 has its contribution maximum, the resulting BTD is small.
Due to low mid and upper level tropospheric humidity, the BTD WV6.2-WV7.3, which determines the red colour beam, is small (see WV6.2 image below), the absoption of IR radiation emitted by the earth surface is weak for both WV channels. The scale for the red colour beam is chosen this way, that small BTD lead to high contributions of the red colour.
The contribution from the blue colour beam is rather small, if not zero. The temperature scale for channel WV6.2 is chosen such that warm air masses give little contribution when clouds are not present.
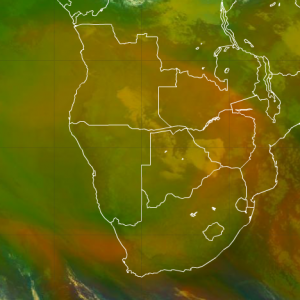
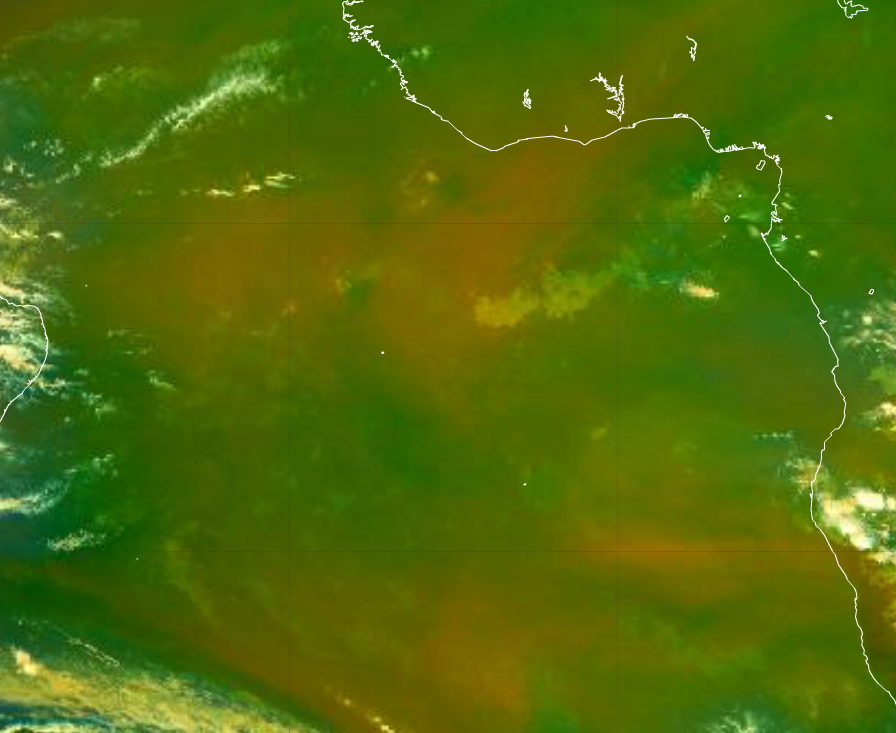
The Airmass image below shows the region of the South-Atlantic. Olive green patches can be seen within a largely green background. These olive areas correspond to dry tropospheric regions as can be seen in the WV6.2 image.
Airmass RGB for 3 February 2016 18:00 UTC
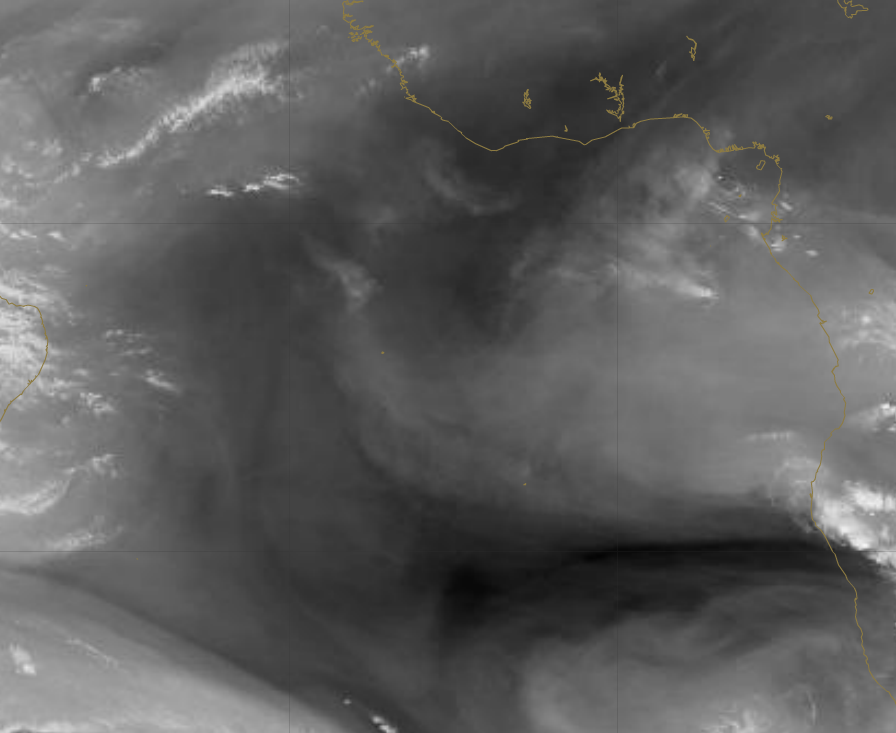
WV6.2 RGB for 3 February 2016 18:00 UTC
Explanation of the colour of dry tropical airmasses in the Airmass RGB (see the recipe):
• Tropical air masses are characterised by their olive/orange colour in the Airmass RGB. The colour results from a high contribution of the green and red colour beam.
• The intense green contribution results from a combination of a high tropopause level (warm airmass) and a low ozone concentration in the level of highest instrument sensitivity.
• The intense red contribution results from a small BTD for both WV channels.