
green
Tropical airmasses with higher upper tropospheric humidity appear green in the Airmass RGB images.
The green colour in the Airmass RGB indicates ozone-poor or more precisely warm/tropical air masses with high upper level tropospheric humidity.
Primarily responsible for the greenish colour is the brightness temperature difference (BTD) of channels IR9.7 and IR10.8 on the green colour beam (see recipe). The smaller the difference between both BTD, the stronger the green contribution. The channel IR9.7 is responsive to ozone gas concentration in the lower stratosphere. Tropical regions are characterised by a high tropopause level and, hand in hand, by a higher altitude of the ozone rich stratospheric air. As the air mass is ozone poor in the levels where IR9.7 has its contribution maximum, the resulting BTD is small.
Due to high upper level tropospheric humidity, the BTD WV6.2-WV7.3, which determines the red colour beam, is large. The scale for the red colour beam is chosen this way, that large BTD lead to small contributions of the red colour. Hence, the red contribution is not 0, but certainly low.
The contribution from the blue colour beam is rather small, if not zero. The temperature scale for channel WV6.2 is chosen such that warm air masses give little contribution when clouds are not present.
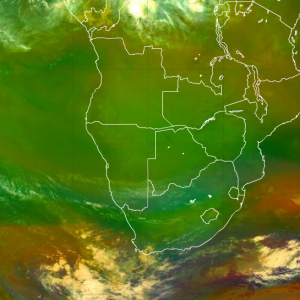
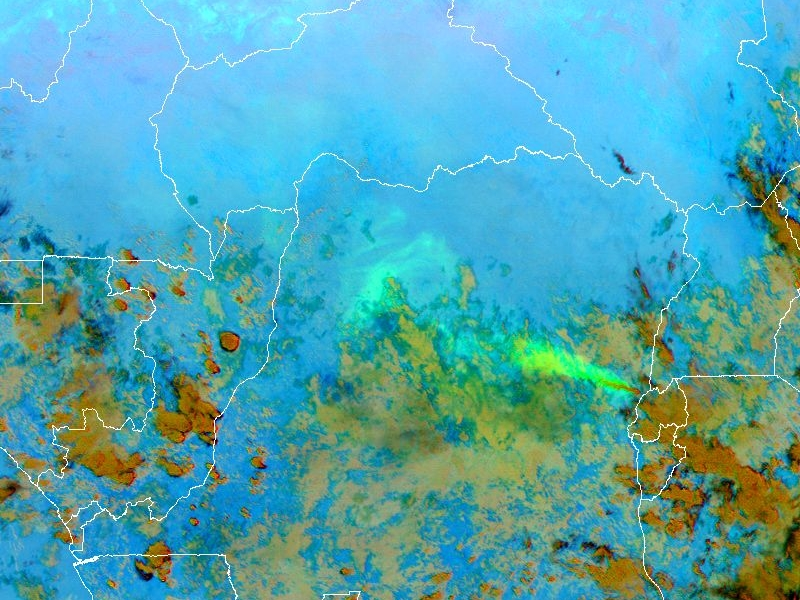
The image below shows an extended tropical airmass over the Saharian region of Africa on a winter day. The ochre boundary in northern Africa as well as the red stripe near the equator and the Arabian peninsula delimit the moist tropical airmass.

Explanation of the colour of moist tropical airmasses in the Airmass RGB (see also the recipe on the left side):
• Tropical air masses are characterised by their green colour in the Airmass RGB. This results from a combination of a high tropopause level (warm airmass) and a low ozone concentration in the level of highest instrument sensitivity.
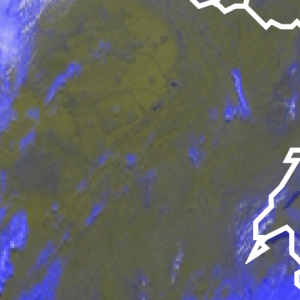
Low land surface temperatures appear greenish in the Airmass RGB images.
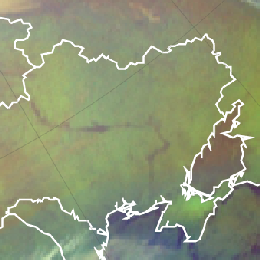
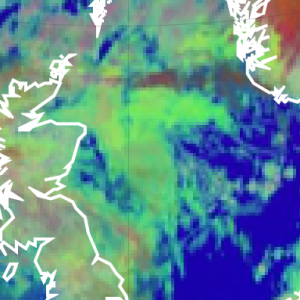
In winter time, large greenish areas appear in the Airmass RGB imagery depicting cloud free areas especially in conjunction with a pronounced high pressure system. This green colour indicates very cold conditions on ground level as can be seen in the image below over the Ukraine and Russia in February 2012.
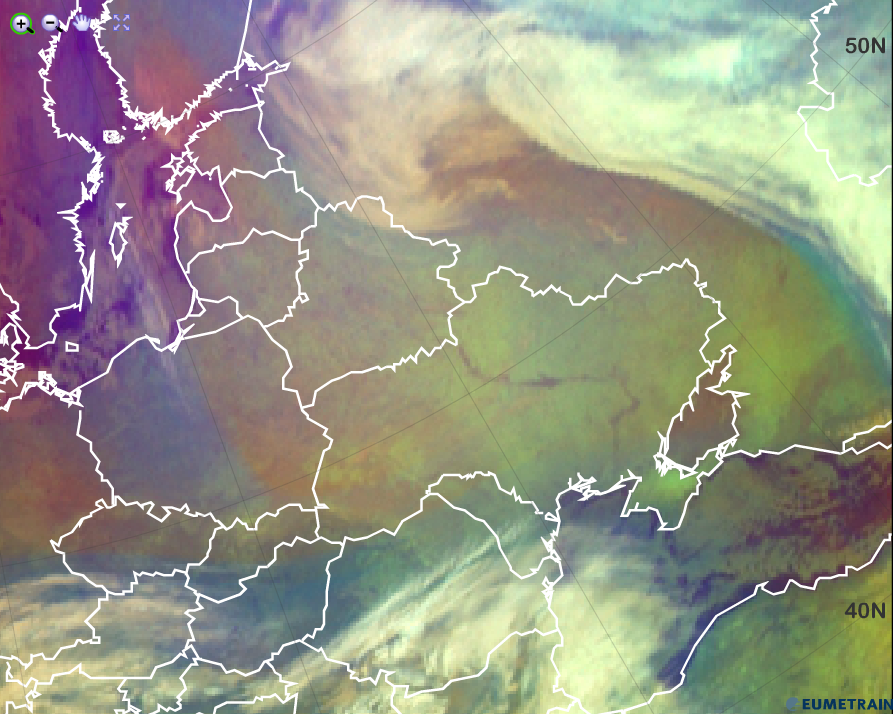
Explanation of the greenish colour of cold land surfaces in the Airmass RGB (see also the recipe on the left side):
In this high pressure zone, the air is relatively dry and subject to sinking. The red colour contribution from the brightness temperature difference (BTD) WV6.2 and WV7.3 is moderately high.
The main contribution comes from the green colour beam, the BTD (IR9.7 – IR10.8), which can take values from -40 to +5 K, where -40 K corresponds to no green contribution and +5 K to a maximum green contribution. As the surface temperature in the window channel IR10.8 is comparable or just a little bit higher than the BT from the ozone channel IR9.7, the brightness temperature difference of those two channels is small, hence the green colour contribution large.
The air in high pressure areas is rather dry due to sinking air masses. Hence the blue colour contribution of the inverted channel WV6.2 to the Airmass RGB is moderately high because it is very cold.
Conclusion: Although the red and the blue colour beam contribute moderately in case of very cold land surfaces, the green colour beam dominates the Airmass RGB.
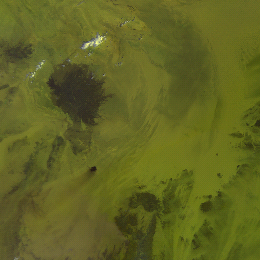
Sandy deserts appear greenish yellow in the AVHRR Cloud RGB images, rocky deserts appear dark green.
The images below show desert areas.
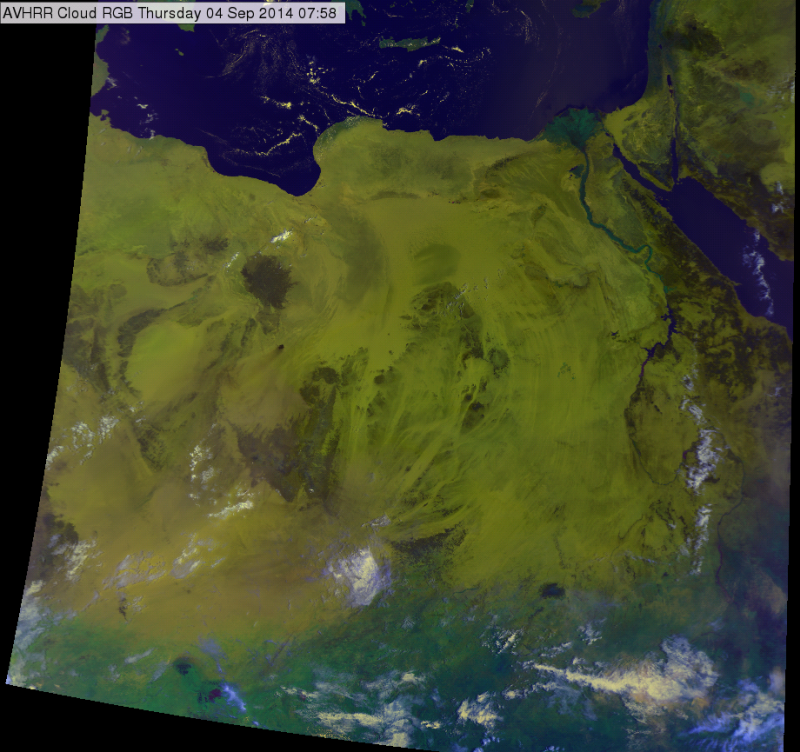
AVHRR Cloud RGB image of Sahara for 04 September 2014 at 07:58 UTC
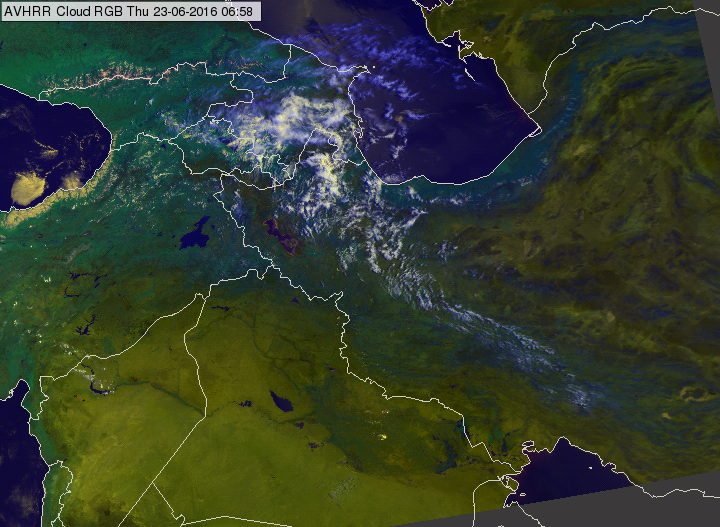
AVHRR Cloud RGB image of Sahara for 23 July 2016 at 06:58 UTC
Explanation of the colours of desert areas (see the recipe):
• For deserted areas the VIS0.63 and NIR0.87 reflectivity values are close to each other; for sandy desert they are medium strong, while for rocky desert weaker, thus the red and green signals are medium strong for sandy desert and weaker for rocky desert.
• The blue signal (IR10.8 brightness temperature) is low during daytime as the land surface temperature is high.
As a consequence, sandy deserts appear greenish yellow (the eye is more sensitive for green than for red), while rocky deserts appear grey with some greenish tones in the AVHRR Cloud RGB images.
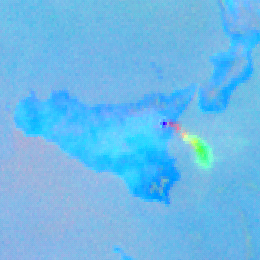
A pure volcanic sulphur dioxide gas plume appears typically (light) green in the Ash RGB images.
Note that it might be yellow at high latitudes and for large viewing angles near the edge of the full Earth disk. The mixture of SO2 gas and ash plume may be also yellow.
The Ash RGB image below shows an eruption of the Mount Etna. One can recognize the hot lava in the crater (dark blue) and a plume released by the Mount Etna, which is magenta close to the crater and green further downstream (with some yellow patches in between). The green colour indicates pure SO2 gas plume, the magenta colour indicates volcanic ash plume; the yellow patches are likely to be a mixture of both.
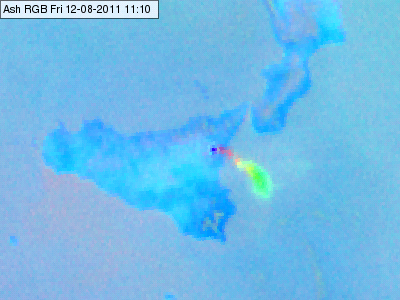
Meteosat, SEVIRI Ash RGB for 12 August 2011 11:10 UTC
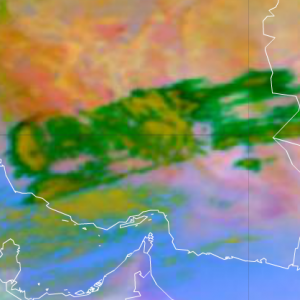
In the image below one can see the eruption of Nyamuragira volcano in Africa at November 2006. It released large amounts of sulphur dioxide. The image shows the sulphur dioxide cloud in green colour. The brown and black colours correspond to clouds, the bluish colours to the surface.
Meteosat, SEVIRI Ash RGB for 29 November 2006 11:10 UTC
Note that the detection of SO2 is more effective if
• the SO2 concentration is higher,
• the SO2 cloud is purer (without ash particles)
• the temperature difference between the underlying surface and the SO2 cloud is higher.
Explanation of the colours of a volcanic sulphur dioxide gas plume (see the recipe):
The key channel combination of sulphur dioxide gas plume detection is the (IR10.8-IR8.7) brightness temperature difference (visualised in the green colour beam).
• The red signal is medium or low in lack of thin ash cloud. (Weak in case of thin ice clouds.)
• For an SO2 gas plume the green component is high, (because the SO2 gas strongly absorbs radiation at around 8.7 micrometer, while it does not absorb the radiation at 10.8 micrometer).
• The blue signal depends on the temperature and the transmittance of the gas plume, and the temperature of the underlying surface or cloud layer.
As a consequence the pure sulphur dioxide gas plume appears (light) green. It appears yellow in case it is mixed with ash.
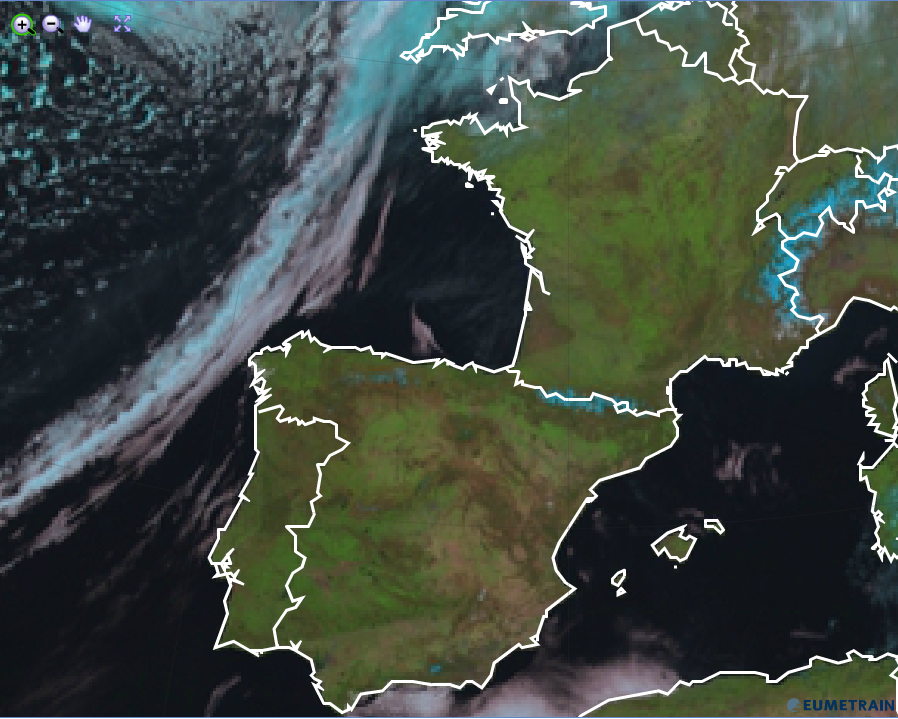
Semitransparent ice clouds depict in green colours in the Day Microphysics RGB images.
Semitransparent clouds, as the name indicates, do not reflect short wave radiation from the sun. They are optically transparent and therefore not visible in the VIS0.8 channel. No contribution from the red colour beam.
Small ice crystals reflect much of the incoming short wave solar radiation at 3.9 micrometer. A strong green signal results from this cloud property.
Semitransparent clouds are very cold, hence no contribution from the IR10.8 channel.
The Day Microphysics RGB below shows thin cirrus clouds which develop at the coastal mountains and spread over the Mediterranean Sea.
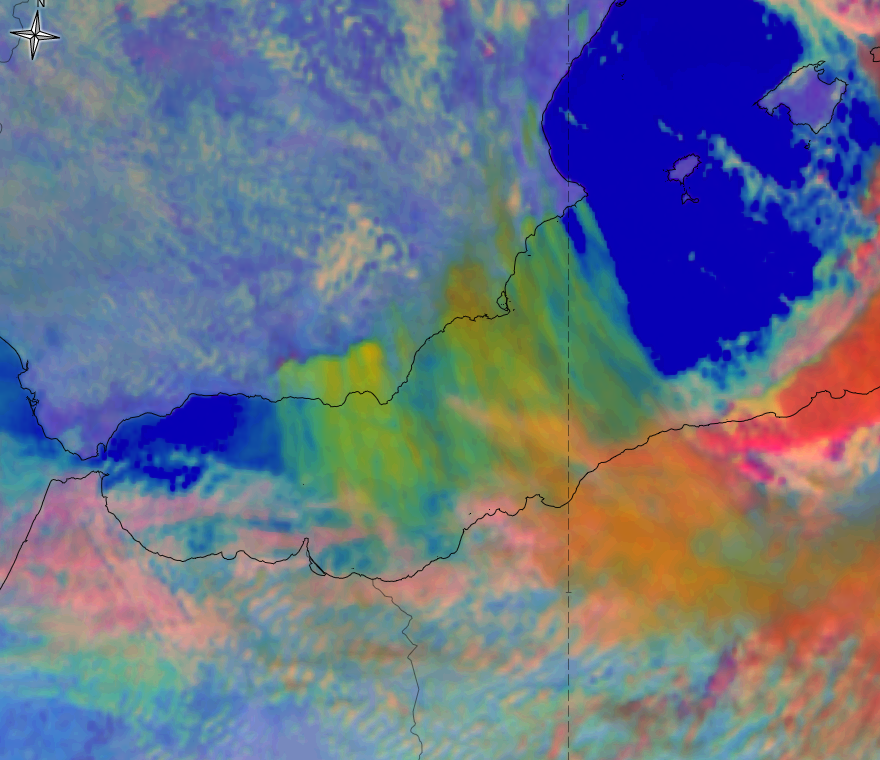
Day Microphysics RGB from 7 February 2016, 12:00 UTC
Explanation of the green colour of semitransparent ice clouds in the Day Microphysics RGB (see the recipe):
Only the green colour beam contributes substantially because small ice crystalls strongly reflect short wave solar radiation at 3.9 micrometer.
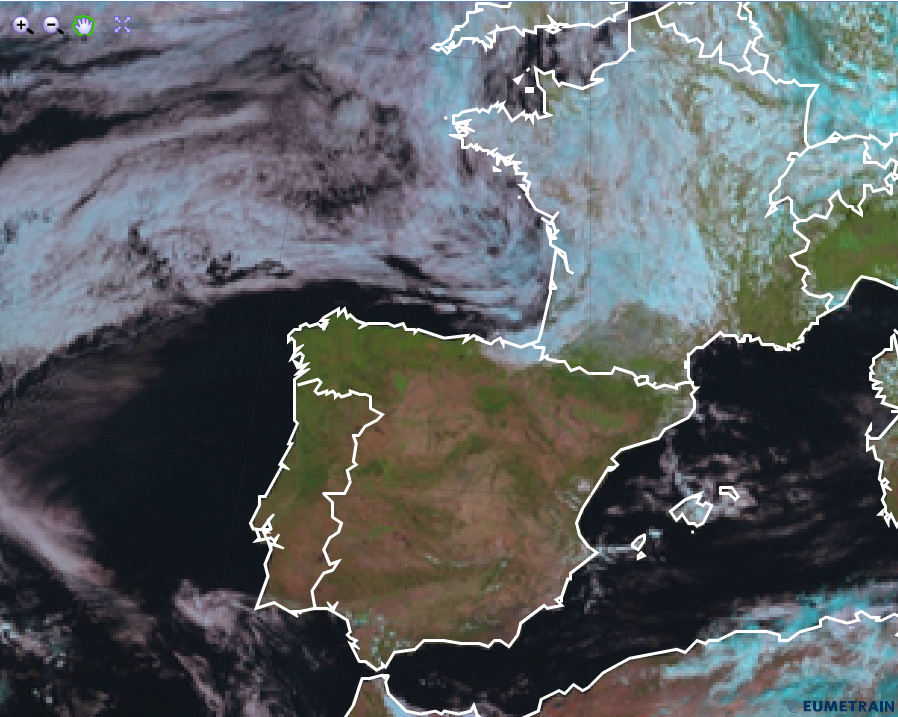
Semitransparent mid-level water clouds depict in green colours in the Dust RGB images. Over deserts, thin ice clouds also appear in green.
The green colour in the Dust RGB generally indicates thin, mid-level semitransparent cloudiness, thin Altostratus or Altocumulus, but can also be thin high-level ice cloud (if the cloud is above sand desert).
The red colour beam contribution is represented by the brightness temperature difference (BTD) IR12.0-IR10.8 in a scale between [-4;+2]. The BTD is low (negative), because the cloud is semitransparent.
The green colour beam is represented by the BTD (IR10.8-IR8.7). It is ~(2-4 K) for water clouds and low (around zero or negative) for ice clouds. A mid level cloud is usually a mixed phase cloud so it has a BTD in between. As the cloud is semitransparent, the IR10.8-IR8.7 difference depends on the transmissivity and the BT of the underlaying surface as well. Be aware that with a strong conribution of surface radiation (e.g. from deserts), the BTD can become positive also for ice clouds. As for the green component a strong gamma correction (with 2.5 gamma) is applied, the green signal becomes medium strong.
The BT of IR10.8 is low, because it is a mid-level cloud. For a semitransprent cloud, BT is higher than the real cloud top temperature, it depends on the transmissivity and the temperature of the underlaying surface as well, but usually it is low in the (261-289) K range. Therefore, the blue colour contribution is low.
The Dust RGB image below shows semitransparent water clouds over the Atlantic.
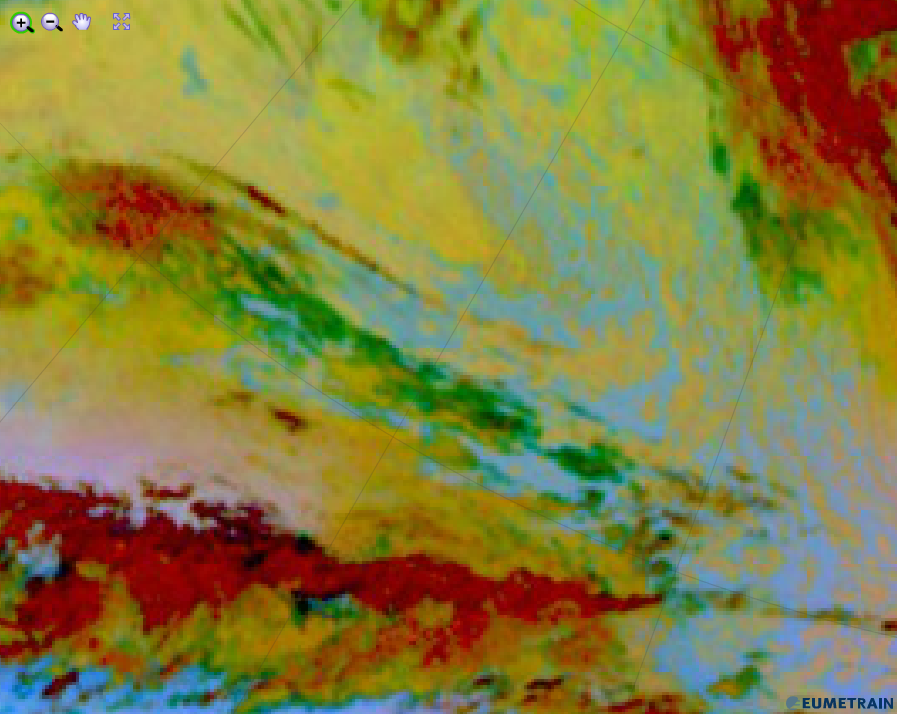
Explanation of the green colour of high opaque clouds in the Dust RGB (see the recipe):
• Only the BTD (IR10.8-IR8.7) contributes to the Dust RGB in case of semitransparent mid-level water clouds. The small positive values are enhanced by a strong gamma correction.
Cloud free land surfaces appear olive green in the HRV Cloud RGB images.
Land, vegetated or bare soil, depicts in olive green colours in the HRV Cloud RGB. Due to rather high temperatures of the ground, the contribution from the blue colour beam does not play an essential role in the HRV Cloud RGB.
The HRV channel, contributing with the red and green colour beam, is responsible for the greenish colour of the soil. In fact, the red and green beam have the same intensity. A mixture of red and green normally results in yellow. In fact when yellow gets darker, i.e. the red and the green colour beam are weak but of same intensity, the human eye sees the mixture of both as a green tone.
The image below shows the African sand desert in olive green colours. Sand has a relatively high albedo while vegetated land and rocks have a smaller albedo. This can be seen in the image below which shows the sandy Saharian desert and in contrast vegetation covered land near the coast.
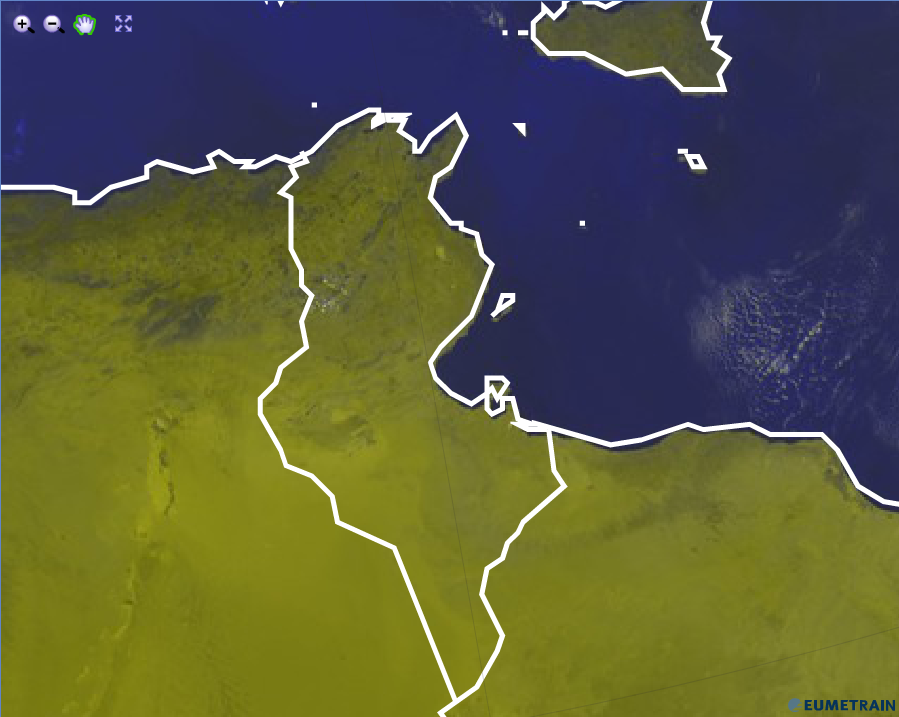
HRV Cloud RGB from 29 July 2015, 12:00 UTC
Explanation of the olive green colour of cloud free land surfaces in the HRV Cloud RGB (see the recipe):
Land surfaces are characterised by their albedo in the HRV Cloud RGB. Moderate red and green contributions combine to an olive green which becomes darker when the albedo reduces (e.g. vegetation).

Tropical airmasses with higher upper tropospheric humidity appear green in the Airmass RGB images.
The green colour in the Airmass RGB indicates ozone-poor or more precisely warm/tropical air masses with high upper level tropospheric humidity.
Primarily responsible for the greenish colour is the brightness temperature difference (BTD) of channels IR9.7 and IR10.8 on the green colour beam (see recipe). The smaller the difference between both BTD, the stronger the green contribution. The channel IR9.7 is responsive to ozone gas concentration in the lower stratosphere. Tropical regions are characterised by a high tropopause level and, hand in hand, by a higher altitude of the ozone rich stratospheric air. As the air mass is ozone poor in the levels where IR9.7 has its contribution maximum, the resulting BTD is small.
Due to high upper level tropospheric humidity, the BTD WV6.2-WV7.3, which determines the red colour beam, is large. The scale for the red colour beam is chosen this way, that large BTD lead to small contributions of the red colour. Hence, the red contribution is not 0, but certainly low.
The contribution from the blue colour beam is rather small, if not zero. The temperature scale for channel WV6.2 is chosen such that warm air masses give little contribution when clouds are not present.
The image below shows an extended tropical airmass over the Saharian region of Africa on a winter day. The ochre boundary in northern Africa as well as the red stripe near the equator and the Arabian peninsula delimit the moist tropical airmass.
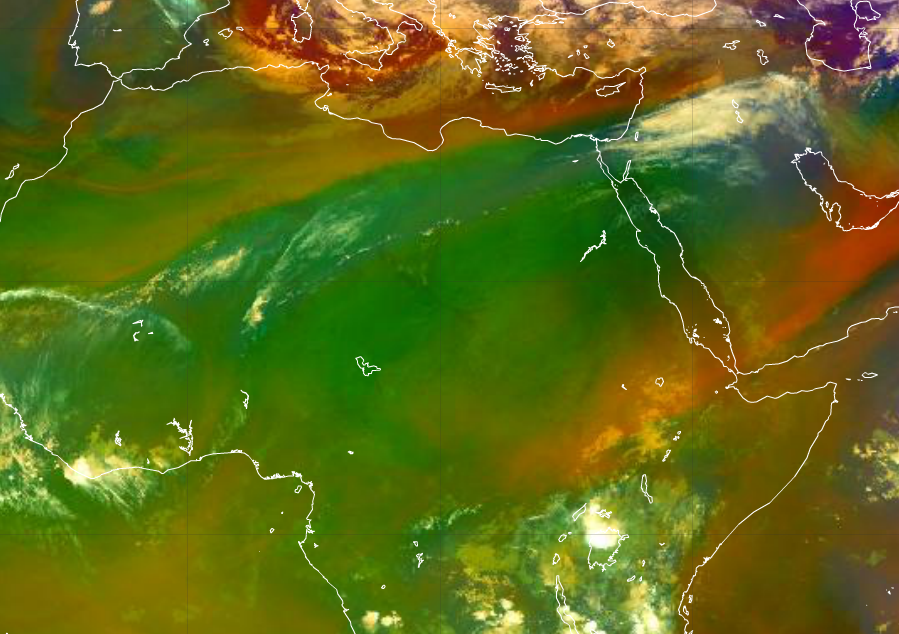
Airmass RGB for 27 November 2015 00:00 UTC
Explanation of the colour of moist tropical airmasses in the Airmass RGB (see the recipe):
• Tropical air masses are characterised by their green colour in the Airmass RGB. This results from a combination of a high tropopause level (warm airmass) and a low ozone concentration in the level of highest instrument sensitivity.
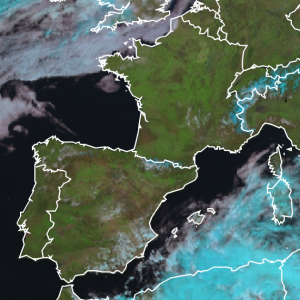
Vegetation covered land appears green in the Natural Colour RGB images.
Vegetation cover over land is depicted in green in the Natural Colour RGB. The intense green colour stems from the strong response of the VIS 0.8 micron channel. Vegetated surfaces much stronger reflect solar radiation at 0.8 than at 0.6 microns. This is one of the reasons, this channels combination is called "Natural Colour RGB".
Natural Colour RGB for 17 April 2013, 12:00 UTC
When the vegetation cover is affected by longer drought periods, the former green areas in the RGB image transform to brownish tones. The picture above shows the Iberian peninsula and France in strong green shades in mid April 2013, while the image below shows the Iberian peninsula in mid September 2013. The same transformation can be seen when vegetation is under hibernating conditions and leaves are not photosynthetically active.
Natural Colour RGB for 12 September 2013, 12:00 UTC
A sharp contrast between vegetation and desert is visible in the Nile delta (see image below). The Nile delta with its abundant vegetation appears green in the Natural Colour RGB while the surrounding deserts are red.
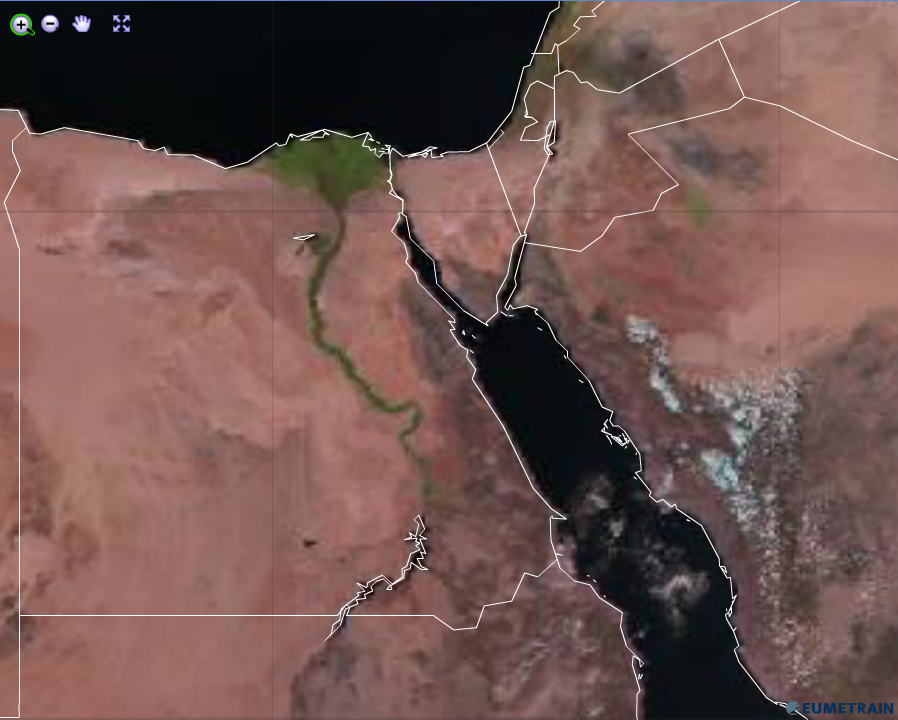
Natural Colour RGB for 12 September 2013, 12:00 UTC
Explanation of the colours of vegetated land in the Natural Colour RGB (see the recipe):
Radiation mesured by the SEVIRI instrument of MSG in channel 2 (0.8 micron) is much more intense than radiation measured at 0.6 or 1.6 micrometer. Therefore the green colour beam outbalances the other colour beams for vegetated land surfaces.

Low land surface temperatures appear greenish in the Airmass RGB images.
In winter time, large greenish areas appear in the Airmass RGB imagery depicting cloud free areas especially in conjunction with a pronounced high pressure system. This green colour indicates very cold conditions on ground level as can be seen in the image below over the Ukraine and Russia in February 2012.

Explanation of the greenish colour of cold land surfaces in the Airmass RGB (see the recipe):
In this high pressure zone, the air is relatively dry and subject to sinking. The red colour contribution from the brightness temperature difference (BTD) WV6.2 and WV7.3 is moderately high.
The main contribution comes from the green colour beam, the BTD (IR9.7 – IR10.8), which can take values from -40 to +5 K, where -40 K corresponds to no green contribution and +5 K to a maximum green contribution. As the surface temperature in the window channel IR10.8 is comparable or just a little bit higher than the BT from the ozone channel IR9.7, the brightness temperature difference of those two channels is small, hence the green colour contribution large.
The air in high pressure areas is rather dry due to sinking air masses. Hence the blue colour contribution of the inverted channel WV6.2 to the Airmass RGB is moderately high because it is very cold.
Conclusion: Although the red and the blue colour beam contribute moderately in case of very cold land surfaces, the green colour beam dominates the Airmass RGB.