
Satellite skills and knowledge for operational meteorologist
Listed here are other resources related to Satellite skills and knowledge for operational meteorologist tag:
Note: click on an image to open the Resource
Giulia Panegrossi presents precipitation products and applications of the Hydrology SAF.
Length: 64 minutes
Within the EUMETSAT Satellite Application Facility on support to Operational Hydrology and Water Management (H-SAF), different precipitation products have been developed. The products exploit either measurements from passive microwave (PMW) radiometers on board polar orbiting satellites, or combination of Meteosat Second Generation (MSG) IR observations with the available PMW precipitation estimates. Some of the products are currently operational (http://hsaf.meteoam.it), and are available for near-real time precipitation monitoring and hydrological applications. Others are being improved and extended to satellites that have become recently operational [i.e., the polar orbiting Core Observatory of the Global Precipitation Measurement mission, (GPM), or the NPP Advanced Technology Microwave Sounder, ATMS)] or that will be operational in the near future (i.e, Meteosat Third Generation. MTG). The H-SAF precipitation products will be presented, focusing on the strengths, weaknesses, and potentials of the current products, and future perspectives offered by the products in development will be outlined.
In this presentation some applications of H-SAF precipitation products will be shown.
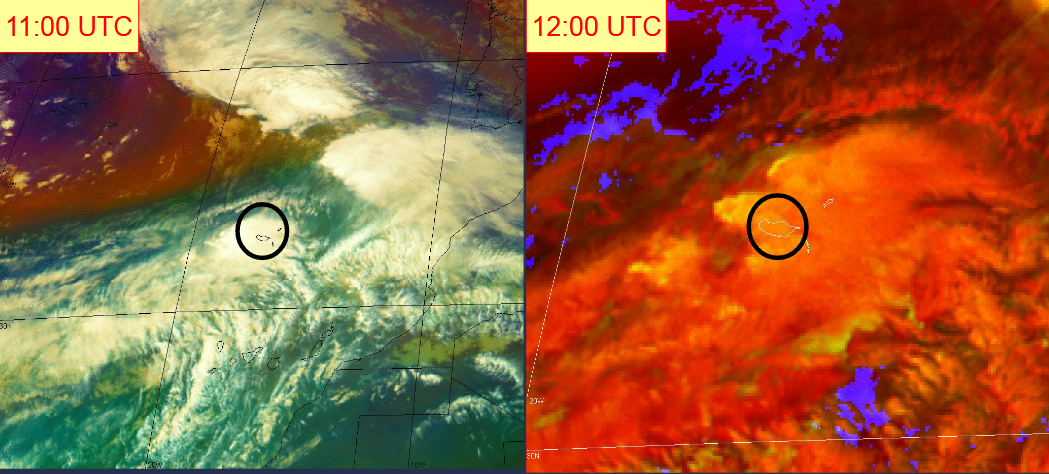
Nuno Moreira reports on a flash flood event on Madeira in 2010.
Length: 36 minutes.
During early morning and morning on 20th February 2010 an extreme and rare flash flood event has occurred in the Portuguese island of Madeira in the North Atlantic, causing 42 casualties, 600 homeless and an estimated loss of around 1000 millions euros. In this presentation, the synoptic environment will be presented and the precipitation producing systems affecting the island will be discussed. The analysis will be mainly performed using satellite imagery from Meteosat 9, both from singles channels and RGB images, as well as from objective estimates of rain and water vapor content. Results from following studies on the precipitation regime of this mountainous island will also be presented.
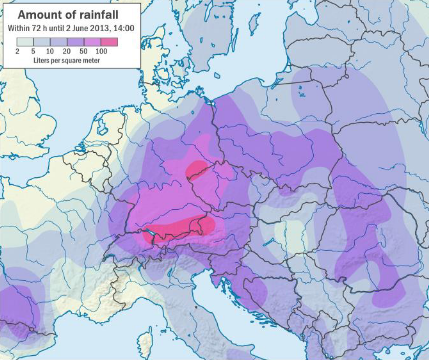
Natasa Strelec Mahovic reports on the precipitation event in spring 2014 which lead to inundations in SE Europe.
Length: 35 minutes.
From the beginning, spring 2014 was very rainy in large parts of central and south-eastern Europe. The soil was already saturated with water in the beginning of May, when mid-May a huge cyclone, persisting over Bosnia and Herzegovina, Serbia and Croatia for 3 days, caused extreme precipitation. The amounts measured in Serbia and Bosnia and along Sava river in Croatia were in some areas larger than ever measured before. Catastrophic flooding left thousands of people homeless and the consequences will be visible for a long time.
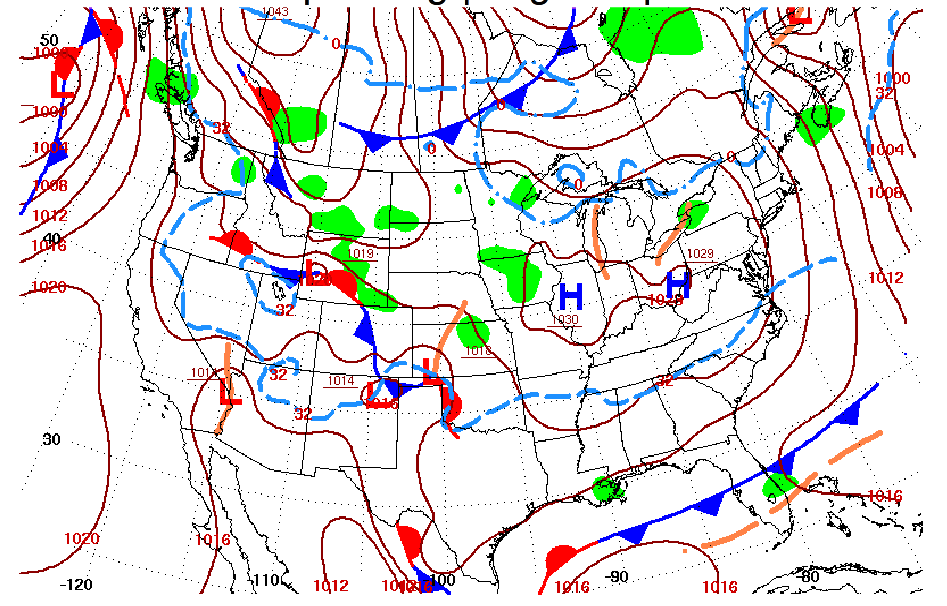
Gregory Carbin gives a presentation on the weather extremes of the winter 2014 in the US.
Length: 25 minutes.
The cool season months of 2014 (JFM) over the U.S. mainland can best be described as much colder than normal across portions of the Great Lakes, Northeast, and Midwest, and much drier and warmer than normal over the west coast, especially California. This talk offered a review of three aspects of the winter/early spring seasons. The first was a review of 12 UTC temperatures for every day in January across the continental U.S. and the relationship of some of the colder mornings with the longer-term record of January mornings back to 1979. The second event of note was the onset of exceptional drought in California. The third event, coming at the end of March, was a look at significant cyclogenesis off the U.S. eastern seaboard on March 25-26.
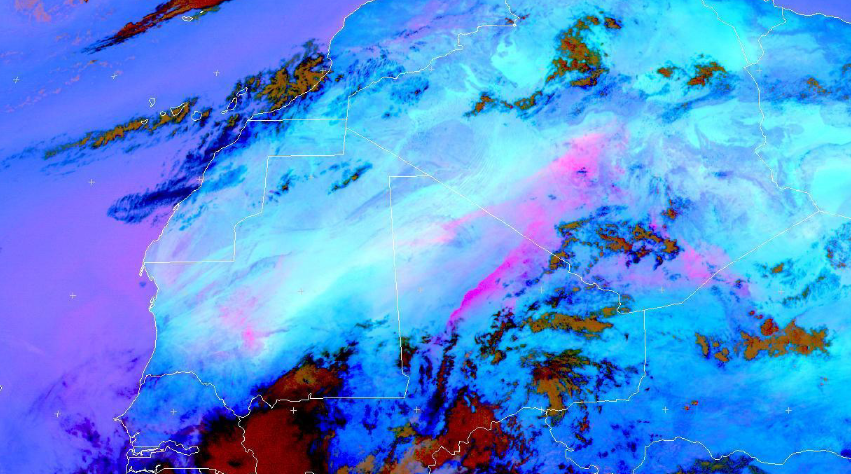
Hamidou Hama highlights the major socio-economic and environmental impacts of dust, focuses on the meteorological processes at various scales that are responsible for raising dust/sand storms in the arid Sahara Desert and the semi arid Sahel at its fringes.
Length: 40 minutes.
This presentation, after highlighting the major socio-economic and environmental impacts of dust, focuses on the meteorological processes at various scales that are responsible for raising dust/sand storms in the arid Sahara Desert and the semi arid Sahel at its fringes. The challenges facing the weather forecaster in forecasting such high impact weather phenomena and the importance of satellite remote sensing in their monitoring were also addressed here.
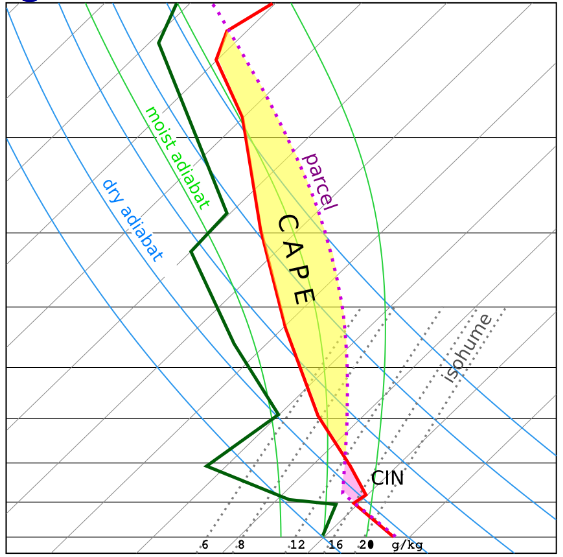
Helge Tuschy's talk offered an insight into the ingredients-based forecasting method, which assists an operational forecaster in preparing well ahead of an active thunderstorm day.
Length: 60 minutes.
This talk offered an insight into the ingredients-based forecasting method, which assists an operational forecaster in preparing well ahead of an active thunderstorm day. Mr. Tuschy also gave an overview about certain ingredients which could result in heavy rainfall and flash flooding (due to deep moist convection). He ended his talk with a short overview about ESTOFEX, the European Storm Forecast Experiment.
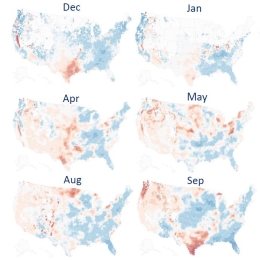
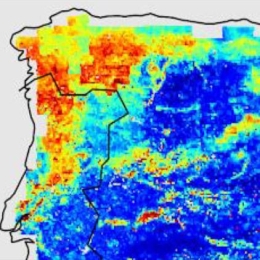
Hamidreza Mosaffa presents a study that aims 1) to develop the long-term climatological SM2RAIN datasets for the period of 1998–2020 by merging two rainfall SM2RAIN products including SM2RAIN-CCI and SM2RAIN-ASCAT, and 2) to the analysis of drought based on standardized precipitation index over the USA.
Investigation of drought variability requires long term rainfall dataset with high spatial and temporal resolution. The goal of this study are as follow: 1) to develop the long-term climatological SM2RAIN datasets for the period of 1998–2020 at 0.25° spatial and monthly temporal resolution by merging two rainfall SM2RAIN products including SM2RAIN-CCI and SM2RAIN-ASCAT, and 2) to the analysis of drought based on standardized precipitation index over the USA. Results indicated that the most significant decreases in the monthly rainfall trends appear in November. In addition, drought occurred during 2003, 2007, and 2012 over most parts of the USA.
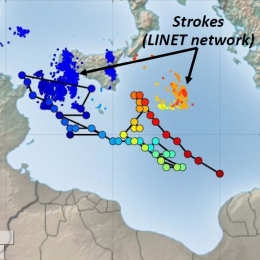
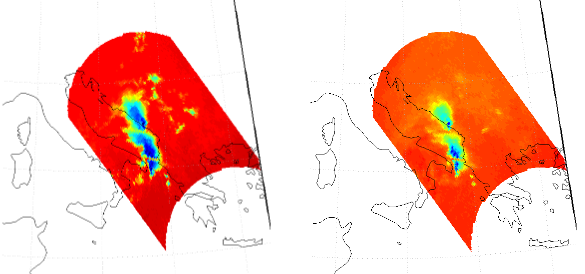
Leo Pio D'Adderio analyses the performances of the H SAF precipitation products during the Mediterranean cyclone Apollo.
This work analyses the performances of the H SAF precipitation products during the Mediterranean cyclone Apollo. The cyclone Apollo occurred between October 25th and October 29th, 2021 with its maximum on October 28th and 29th when it approached the coasts of Sicily causing floods and damages to civil structures. The present work aims to describe the cyclone evolution by exploiting the satellite-based Level 2 and Level 3 H SAF precipitation products. The analysis focuses on the reconstruction of the precipitation pattern and of the quantitative amount thanks a direct comparison with ground-based measurements.
Emanuel Dutra presents an overview of the LSA SAF ET products with particular focus on the use of HSAF soil moisture in operations (H14 and future H26) and in the production of the climate data record (H141).
Evapotranspiration (ET) is a key component of the Earth System coupling land-atmosphere exchanges of water, energy and carbon. Due to the complex nature of the processes involved (radiation, boundary layer turbulence, vegetation status, soil moisture) it is very challenging to observe (locally and from Satellite) and to model. LSA SAF evapotranspiration product takes advantage of satellite radiation and soil moisture estimates to diagnose ET using a surface energy balance approach. This talk will present an overview of the LSA SAF ET products with particular focus on the use of HSAF soil moisture in operations (H14 and future H26) and in the production of the climate data record (H141).
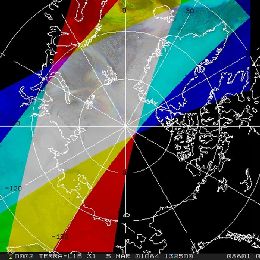
Regis Borde from Eumetsat explains in his presentation how winds are derived from polar orbiting satellites in the Arctic and Antarctic region.
Atmospheric Motion Vectors (AMVs) have been derived from geostationary satellites since late seventies. In 2001, an experimental polar wind product has been developed at the University of Wisconsin-Madison’s (CIMSS) using imagery from MODIS instrument on NASA’s Terra satellite. Filling the lack of observational data over Polar Regions this product demonstrated a global positive impact on the forecast not only over polar areas. Following the initial CIMSS developments, EUMETSAT recently started to extract polar winds from METOP AVHRR instrument. Regis Borde´s session will provide some general information about the current status of polar winds product and about its extraction. The general methodology to derive polar winds from satellite images is mainly based on the heritage used for geostationary satellites, but some specific problems had to be considered due to larger timeliness between consecutive images, to characteristics of the instruments and to specificities of polar areas atmosphere.
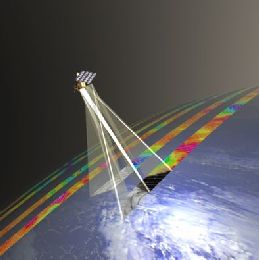
Joseph Sienkiewicz provides an overview of the measuring principles of scatterometers on polar orbiters. The presentation concludes on practical examples showing also attenuation effect by rain droplets.
Ocean surface vector winds derived from polar satellite based scatterometers (radars) allow marine forecasters to view high resolution wind fields over the global ocean. Operational forecasters first access to near real time ocean vector winds began in the early 1990s with the launch of ERS-1 and followed by ERS-2, NASA's NSCAT and QuikSCAT. Of these instruments QuikSCAT, during its ten year life span, provided a wide swath capability allowing forecasters to see entire storms in a single swath. Today, ASCAT on Metop-A, OSCAT on Indian Space Research Organisation (ISRO) OceanSat-2 satellite and in the near future ASCAT-B on Metop-B will continue to provide global coverage. Scatterometer winds provide forecasters a high resolution "sea" truth, give an enhanced situational awareness, the ability to assess the validity of numerical model initial conditions and short term forecasts, and the location and intensity of warning criteria winds. This talk will discuss the above issues by giving examples and also discuss how to interpret remotely sensed ocean winds.
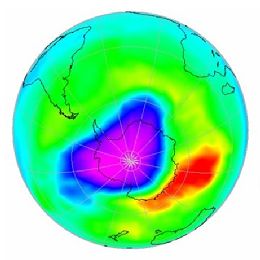
Nan Hao from DLR gives an overview on ozone and other trace gases products from the O3M SAF. The presentation is completed by numerous examples.
This lecture focuses on the ozone and other minor trace gas products, such as NO2 and SO2, from the GOME-2 and IASI instruments on MetOp. These products are developed in the framework of EUMETSAT’s Satellite Application Facility on Ozone and Atmospheric Chemistry Monitoring (O3M-SAF), as part of EUMETSAT’s Polar System (EPS) Ground Segment. The O3M-SAF is responsible for the algorithm development, the operational processing, dissemination and archiving of the products, as well as providing User Services. The ozone and minor trace gas products from GOME-2 and IASI are used in research of atmospheric composition, like ozone loss, dynamics, anthropogenic effects, and in applications of environmental security, like monitoring of volcanic eruptions and pollution.