
Satellite skills and knowledge for operational meteorologist
Listed here are other resources related to Satellite skills and knowledge for operational meteorologist tag:
Note: click on an image to open the Resource
Lecture by Andreas Wirth on data aquisition and data processing to obtain rich and useful satellite images.
For the correct assessment of satellite images, the processes involved in data processing should be known very well. Data processing and applied algorithms have essential impact on the satellite images, such as for example gamma correction. This lecture leads from single counts to radiances and brightness temperatures. Finally a well chosen selection of applications will be shown.
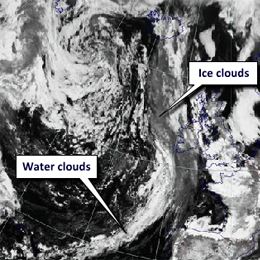
Satellite instruments measure at various wavelenghts. Since atmospheric gases reveal different proporties when being measured at different wavelengths, this information can be essential to filter information.
Satellite instruments measure at various wavelengths. Since atmospheric gases reveal different properties when being measured at different wavelengths, this information can be essential to filter information. This lecture guides you the basic characteristics of the various SEVIRI channels to their applications.
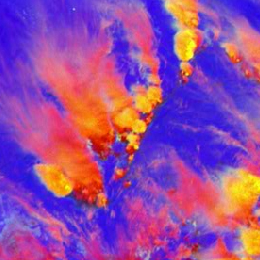
Geostationary satellites enable to closely monitor the weather development at selected locations. This is particularly important for nowcasting convection and high impact weather. This lecture leads from general advantages of geostationary satellites to specific applications.
Geostationary satellites enable to closely monitor the weather development at selected locations. This is particularly important for nowcasting convection and high impact weather. This lecture leads from general advantages of geostationary satellites to specific applications.
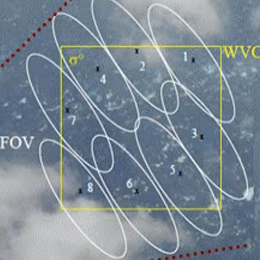
The Advanced Scatterometer (ASCAT) is one of the new-generation European instruments carried on MetOp and will be used to determine information about the wind for use primarily in weather forecasting and climate research.
The Advanced Scatterometer (ASCAT) is one of the new-generation European instruments carried on MetOp and will be used to determine information about the wind for use primarily in weather forecasting and climate research. Data from ASCAT will also find applications in a number of other areas such as the monitoring of land- and sea-ice, snow cover and soil moisture.
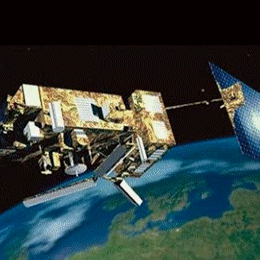
A low altitude polar orbit is widely used for monitoring the Earth because each day, as the Earth rotates below it, the entire surface is covered. Typically, a satellite in such an orbit moves in a near-circle about 800 km.
Polar orbiting satellites fly at relatively low altitudes of about 800 km above Earth. Therefore they can provide satellite images at high horizontal resolution. When only one polar satellite is employed, the same spot on Earth is visited only twice per day. Therefore more than one polar satellite with different equatorial crossing times is required in order to attain more frequent observations. This lecture introduces you with the different instruments onboard of MetOp A and gives insight into the application of the retrieved information.
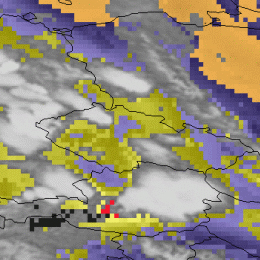
The Global Instability Index (GII) product is one of the MSG meteorological products and describes the instability of the clear atmosphere by a number of airmass parameters.
The European geostationary Meteosat Second Generation satellite (MSG) offers a variety of channels to use for various purposes, including nowcasting of convection. A number of applications have also been developed to make use of these new capabilities for nowcasting, especially for the detection and prediction of severe weather. The MSG infrared channel selection makes it possible to assess the air stability in pre-convective, i.e. still cloud free, conditions. Instability indices are traditionally derived from radiosonde profiles. Such indices typically combine measures of the thermal and the moisture properties and often only use a small quantity of vertical profile parameters. MSG based temperature and moisture retrievals are used for the derivation of stability indices, which are a part of the MSG meteorological products derived centrally at EUMETSAT. Such indices are of highly empirical nature and are often only applicable to certain geographic regions, but they can assess the likelihood of convection within the next few hours. Numerous test cases and the more quantitative verification process that was initiated by the South African Weather Service show the generally good warning potential of the derived instability fields. The added capability of a continuous monitoring of the instability fields that is guaranteed by MSG’s 15 minute repeat cycle is most valuable, since it provides nowcasters with new information much more regularly than the twice-a-day soundings at only limited number of stations. The current EUMETSAT instability product is aimed at helping a forecaster to focus his attention to a certain region, which he can then monitor more closely with other means like satellite imagery and radar data over the next hours.
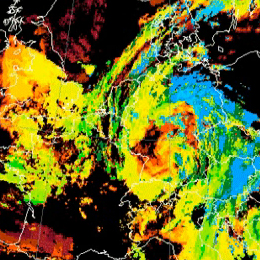
The NWC SAF provides the tools and the software that deliver tailored satellite information to support forecasting up to 12 hours ahead, known as Very Short Range Forecasting.
The general objective of the Nowcasting Satellite Application Facility (NWC-SAF) is to provide operational services to ensure the optimum use of meteorological satellite data in Nowcasting and Very Short Range Forecasting by targeted users. This is applicable to the MSG and the PPS satellite systems. To achieve this goal, the SAFNWC is responsible for the development and maintenance of appropriate SW Packages, as well as of all related tasks for user\'s support. Moreover, the SAFNWC intends to be a Centre of Excellence for Nowcasting in EUMETSAT.
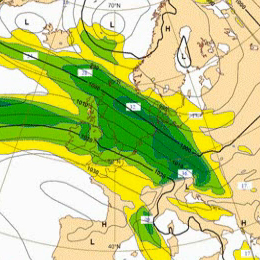
SAFs are dedicated centres of excellence for processing satellite data, achieved by utilising specialist expertise from the Member States
SAFs are dedicated centres of excellence for processing satellite data, achieved by utilising specialist expertise from the Member States. SAFs generate and disseminate operational EUMETSAT products and services and are an integral part of the distributed EUMETSAT Application Ground Segment.
Each SAF is led by the National Meteorological Service (NMS) of a EUMETSAT Member State, in association with a consortium of EUMETSAT Member States and Cooperating States, government bodies and research institutes. The lead NMS is responsible for the management of each complete SAF project. The research, data and services provided by the SAFs complement the standard meteorological products delivered by EUMETSAT’s central facilities in Darmstadt, Germany.
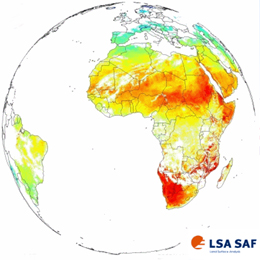
The scope of LSA-SAF is to increase benefit from Satellite (MSG and EPS) data related to land, land-atmosphere interactions and biospherical applications.
The main purpose of the Land SAF is to increase the benefits from MSG and EPS data related to land, land-atmosphere interactions and biophysical applications, namely by developing techniques, products and algorithms that will allow a more effective use of data from the two planned EUMETSAT satellites.
Although directly designed to improve the observation of meteorological systems, the spectral characteristics, time resolution and global coverage offered by MSG and EPS allow for their use in a broad spectrum of other applications, namely within the scope of land biophysical applications.
Activities to be performed within the framework of the Land SAF shall involve the development of products that are especially relevant in the following fields of application:
» Weather forecasting and climate modelling, which require detailed information on the nature and properties of land. Highest Land SAF priority should be towards the meteorological community and, within that community, NWP has been already identified as the one that has the greatest potential of fully exploit the products;
» Environmental management and land use, which require information on land cover type and land cover changes (e.g. provided by biophysical parameters or thermal characteristics);
» Natural hazards management, which requires frequent observations of terrestrial surfaces in both the solar and thermal bands;
» Climatological applications and climate change detection.
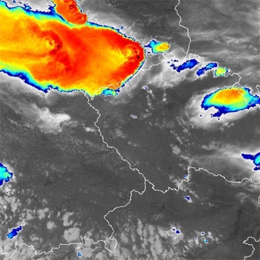
Although may considered as the answer to all problems, satellite also come with some limitations. In this lecture one such limitation "Parallax Shift" is explained.
Although may considered as the answer to all problems, satellite also come with some limitations. In this lecture one such limitation, Parallax Shift is explained, and how you have to take this into account. Fortunately there are some solutions available to overcome this problem, which are also explained by Martin Setvak (CHMI).
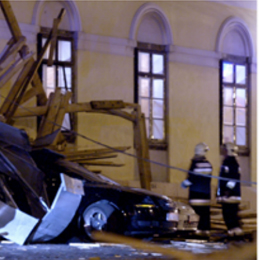
Presentation on some of the typical convective scenarios with the focus on the usage of the background NWP fields and convective parameters in combination with satellite imagery.
Zoltan Polyanszky from the Hungarian Meteorological Institute, presents some of the typical convective scenarios with the focus on the usage of the background NWP fields and convective parameters. The role of the operational work of the forecaster who is responsible for issuing warnings is highlighted and concluding a reflection is discussed on what has been learned from the situations over the recent years.
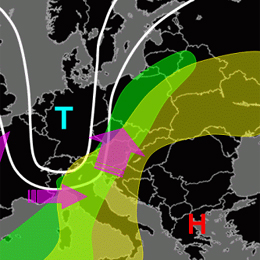
Presentation during the event week on Convection in June 2011 by Helge Tuschy on the European Forecasting Experiment (ESTOFEX).
Presentation by Helge Tuschy from Deutscher Wetterdienst (DWD). He is one of the forecasters producing the valuable ESTOFEX forecasts and this lecture is on the basics of convection and how the convective outlooks in ESTOFEX are prepared.