
red

Dry sinking air masses appear red in the Airmass RGB images.
The reddish color is an indication for a day air mass, mostly resulting from sinking processes. This phenomenon can often be observed at or near ongoing cyclogenesis. Potential Vorticity (PV) is a good indicator for this dynaic process. So called "PV anomalies", i.e. a local height minimum of the 1.5 PV-value surface indicate the downward motion of dry stratospheric air. The 1.5 PV-value surface is often considered as the "dynamical tropopause".
As the air is getting dryer when sinking compared to the surrounding air masses, both the WV6.2 and the WV7.3 channels exhibit rather high values of the brightness temperature (BT). Still the BT of channel WV7.3 is a little bit higher than from channel WV6.2 as the latter is more affected by water vapour absorption. The BT difference (BTD) WV6.2-WV7.3 is smaller within dry areas than outside, and hence the contribution of the red colour beam is large.
The stratospheric air is ozone rich, hence the BT of IR9.7 low, the BTD IR9.7-IR10.8 strongly negative. Therefore, the impact of the green colour beam is low.
The contribution from the blue colour beam is rather small, if not zero. The temperature scale for channel WV6.2 is chosen such that high BT give only little contribution to the blue colour beam.
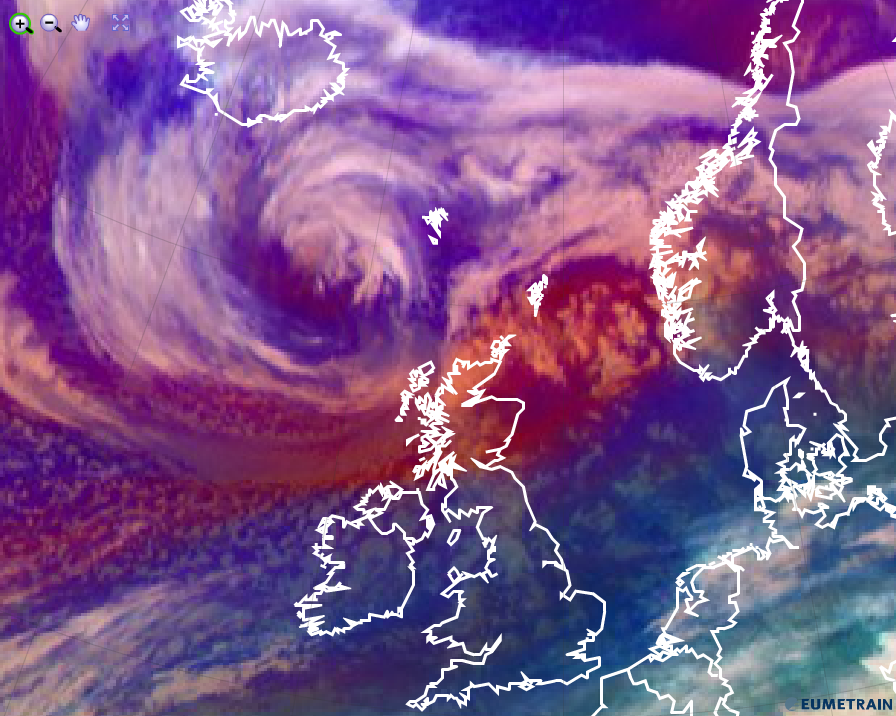
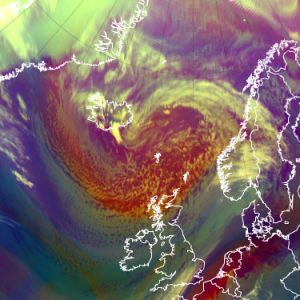
The Airmass RGB image below shows a reddish area over Scotland and the North Sea. A cyclogenetic process is ongoing.
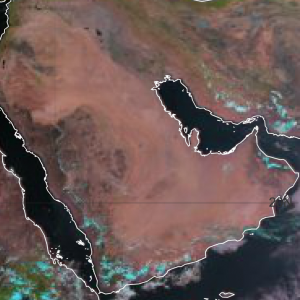
The Airmass image below shows a red zone over the Arabian peninsula (10th May 2012 at 06:00 UTC). In tropical and subtropical regions the Airmass RGB depicts hot and dry air masses in red-orange tones. The dryness of the air is due to missing moisture supply from the desert and not because of dynamic effects.

Explanation of the red colour of dry air masses in the Airmass RGB (see also the recipe on the left side):
• Dry air masses are characterised by their reddish colour in the Airmass RGB. This results from a combination of a low tropopause level (cold airmass) and high ozone concentration in the level of highest instrument sensitivity in combination with strong radiances in both WV channels.
• In warm air masses, red/orange areas depict dry and hot air.
Large ice particles depict in red in the Day Microphysics RGB images.
The red colour of large ice particles in the Day Microphysics RGB images stems from a strong red contribution of the 0.8 micrometer channel. Large ice crystals strongly reflect short wave solar radiation.
The contribution of the solar component of the IR3.9 channel is very weak. The contribution from channel IR3.9 depends on ice/water phase as well as on drop size. Small ice crystals stronger reflect short wave solar radiation than large ice crystals. Large ice crystals absorb solar radiation at 3.9 micrometer nearly completely, hence the green colour contribution is very weak.
As the cloud tops are extremely cold, there is almost no contribution from the blue colour beam.
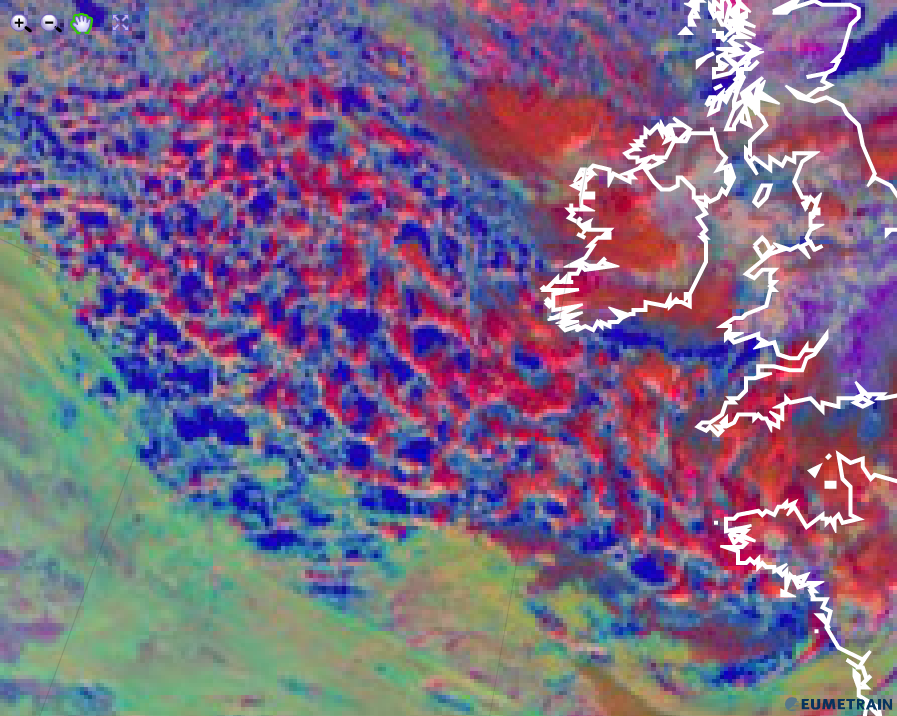
The red parts of convective cells contain large ice crystals which are a sign for slowly developing convective cells or for cells which came to the end of their life cycle (e.g. decaying CBs). The image below shows capped convection over the Atlantic within cold air.
HRV Cloud RGB from 9 February 2016, 12:00 UTC
As far as convection is concerned, the Day Microphysics RGB helps discerning active from less active parts of the convective cell. The larger the ice cristals on top of the cloud, the longer they have been up in the air and the absence of small ice particles generally indicates the decaying stage of the cell.
Day Microphysics RGB from 2 June 2015, 12:00 UTC
Explanation of the red colour of large ice particles in the Day Microphysics RGB (see the recipe):
The red signal for large ice crystals comes from the VIS0.8 channel only. Large ice crystals absorb short wave solar radiation at 3.9 micrometer.
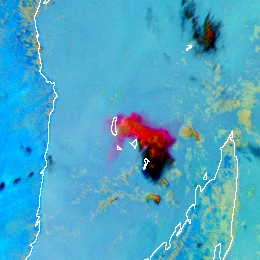
Thin, pure volcanic ash clouds appear typically red or magenta in the Ash RGB images.
The thick volcanic ash cloud is not separable from other thick clouds. However, the ash plume becomes rapidly thinner with increasing distance from the source, and the semitransparent ash cloud is already detectable.
The image below shows one of the eruptions of Karthala volcano on the Grande Comore Island (near Madagascar). The volcano released significant amounts of volcanic ash.
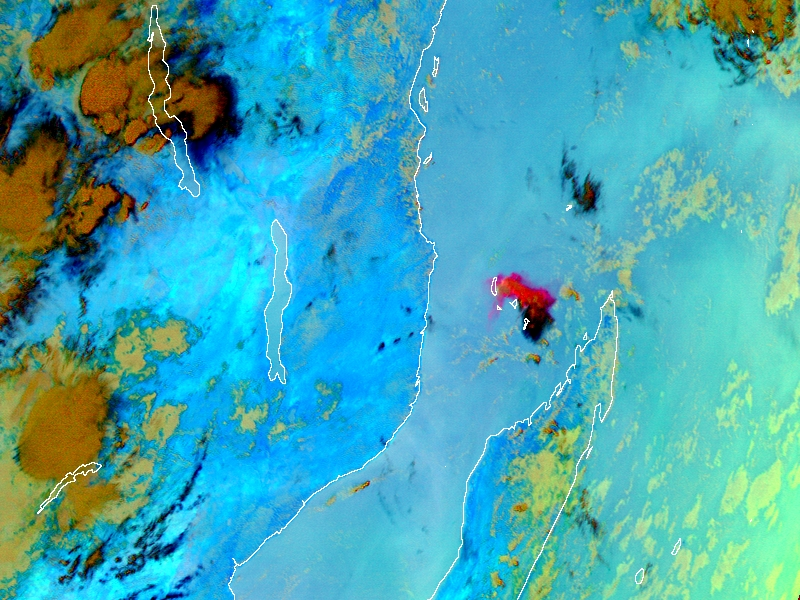
Meteosat, SEVIRI Ash RGB for 25 November 2005 08:00 UTC
The image below shows an eruption of Mount Etna ejecting ash.
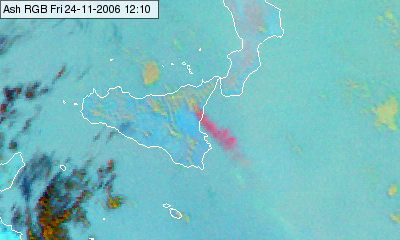
Meteosat, SEVIRI Ash RGB for 24 November 2006, 12:00 UTC
Ash clouds released by the Eyjafjallajökull volcano on Iceland are shown in the next image in reddish colours.
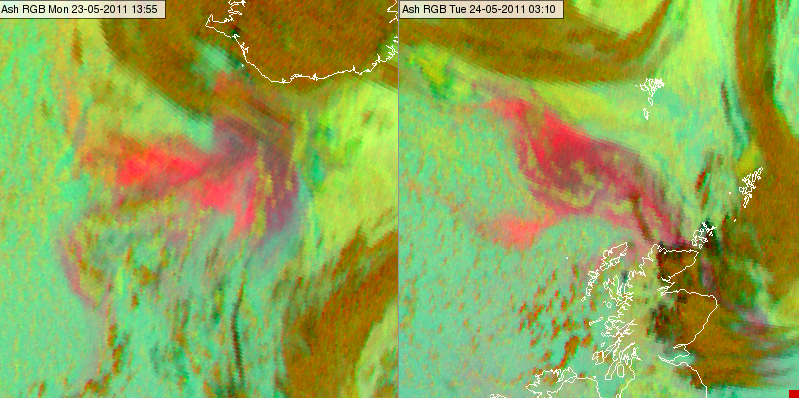
Meteosat, SEVIRI Ash RGB for 23 May 2011, 13:55 UTC (left) and 24 May 2011, 03:10 UTC (right)
The detection of thin ash cloud is particularly effective if the ash plumes
• reach high altitudes where the temperature difference between the ash cloud and the underlying surface is typically larger,
• does not contain significant number of ice particles,
• contain small ash particles.
Note that ash clouds with very mall ash particles at high viewing angles may appear yellow.
Explanation of the colours of thin, pure volcanic ash cloud (see the recipe):
The key channel combination of thin ash cloud detection is the (IR12.0-IR10.8) brightness temperature difference (visualised in the red colour beam). A thin ash cloud is more transparent in the 12.0 micrometer channel than in the 10.8 micrometer channel.
• For thin ash clouds the red component is high, (except the ash plume is mixed with a significant number of ice particles). For thin ice clouds the red signal is low; for thick clouds and cloud free land and sea it is medium strong.
• The green signal is week or medium strong, (except the ash is mixed with SO2 gas or it consists of very small particles and the viewing angles are high).
• The blue signal depends on the temperature and the transmittance of the ash plume, and the temperature of the underlying surface or cloud layer. For colder and denser ash clouds it is low, for warmer ash clouds it is high.
As a consequence the thin, pure ash cloud appears red or magenta (depending on the IR10.8 brightness temperature). It may appear yellow in case the ash particles are very small and the viewing angle is high. If the ash plume is mixed with an SO2 gas plume then it appears yellow.
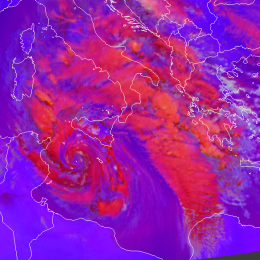
Frontal cloud bands and deep convective clouds without strong updrafts are typically shown in red tones in the Severe Storms RGB images. Examples for frontal cloudiness and cyclones are shown below and left.
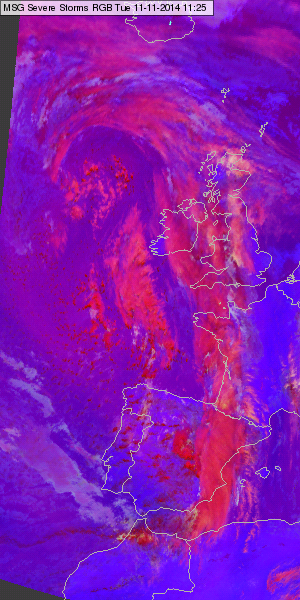
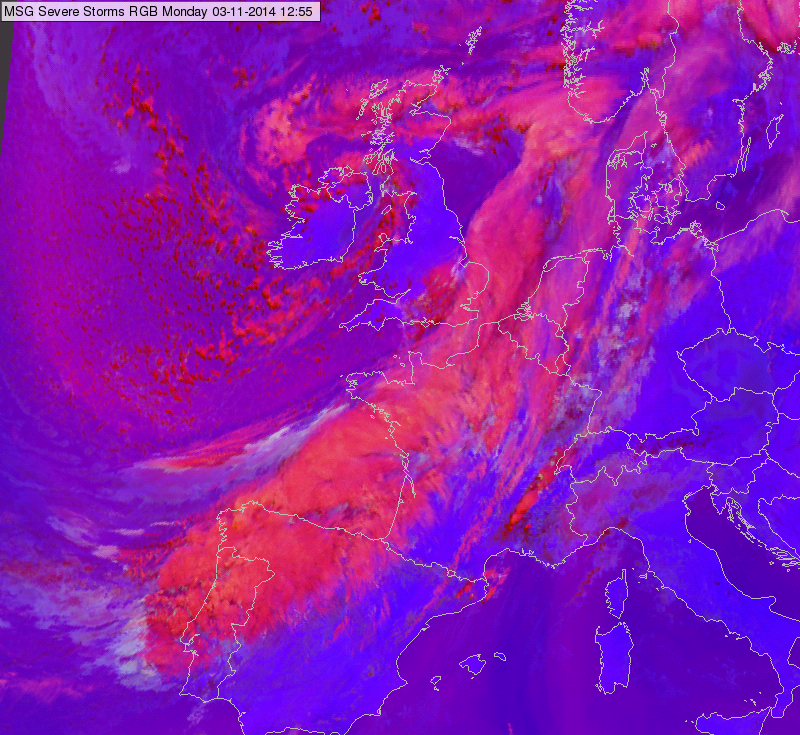
Meteosat, SEVIRI Severe Storms RGB image for 11 November 2014 11:25 UTC (left) and 03 November 2014 12:55 UTC (right)
Note that some parts of the fronts can be yellowish in regions where the cloud top is very cold or it is covered by small ice crystals due to high pollution, or in case of high level lee cloud formation within the cloudiness or embedded convection with strong updraft.
Deep convective clouds are depicted in red colours in case the updraft is not strong (like in the November case below) or they are already in the decaying phase.
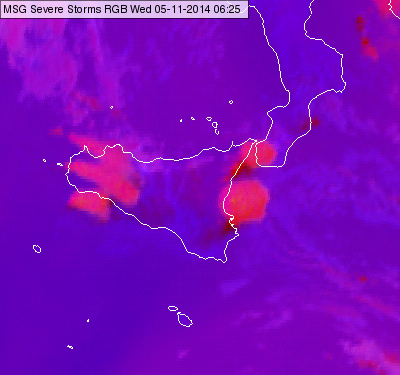
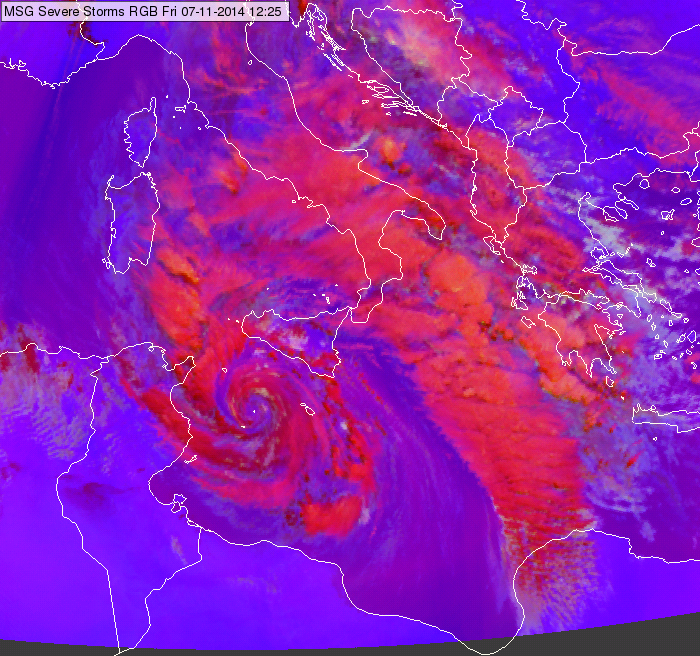
Meteosat, SEVIRI Severe Storms RGB image for 05 November 2014 06:25 UTC and 7 November 2014 12:25 UTC (right)
Explanation of the colours (see the recipe):
• The (WV6.2 – WV7.3) difference is around zero for high thick ice clouds resulting intense signals in the red colour beam.
• The (IR3.9 – IR10.8) difference is low for thick ice clouds (if the cloud top is not very cold and/or not covered by small ice crystals). This difference serves as an approximation of the 3.9 micrometer reflectivity value - large ice crystals reflect only weakly the solar radiation. (Note that this difference depends on the cloud top temperature as well.)
• The (NIR1.6 – VIS0.6) difference is large negative for thick ice clouds because their reflectivity values are much lower around 1.6 micrometer than around 0.6 micrometer. This gives low signal in the blue colour beam.
As a consequence the signal will be intense in red and low in the green and blue colour beams.
Thick ice clouds in convective cells are depicted in red or yellow colours in the Severe Storms RGB images. The areas where the particle size is small and/or the cloud top is very cold will appear in yellow colours. When ice particles become large and/or the cloud top warmer the cloud colour will turn into red. Transitional colours (e.g. orange) will also appear.
Developing, active thunderstorms with strong updraft usually have bright yellow colours (beside red and orange) on its top, mainly at the location of the updraft region. This RGB can be used to locate the active parts of extended convective cells.
The yellow colour can be caused by:
• Very cold cloud top temperature, e.g. very cold overshooting tops caused by strong updraft.
• Small ice crystals on (or above) the cloud top. Strong updrafts bring small ice particles up to the cloud top. Due to the strong updraft the water particles formed at the cloud base have not much time to become larger by coagulation before freezing. (Note that the small ice crystals may belong to an above anvil cirrus cloud, as well.)
• The combined effect of very cold cloud top temperature and small ice crystals.
If the yellow colour is caused by the presence of small ice crystals resulting from strong updrafts and spreading along the anvil, then first the updraft area, i.e. the overshooting top, turns into yellow. When the updrafts persist, the yellow area enlarges gradually.
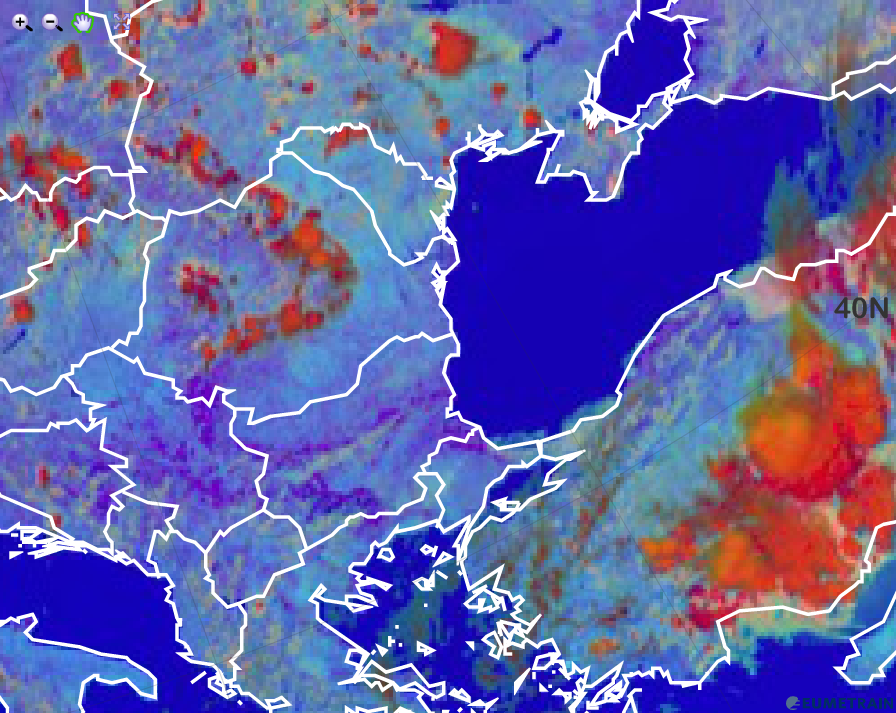
The images below show severe convective systems over Central Europe.
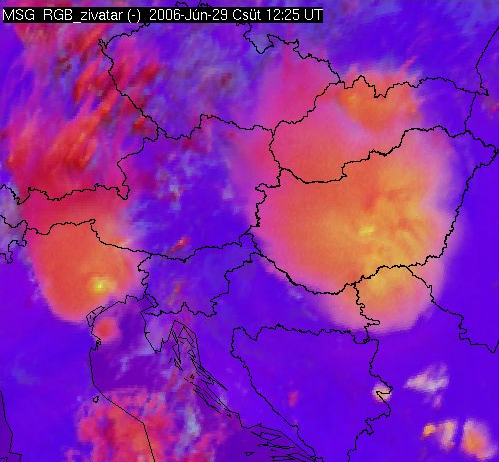
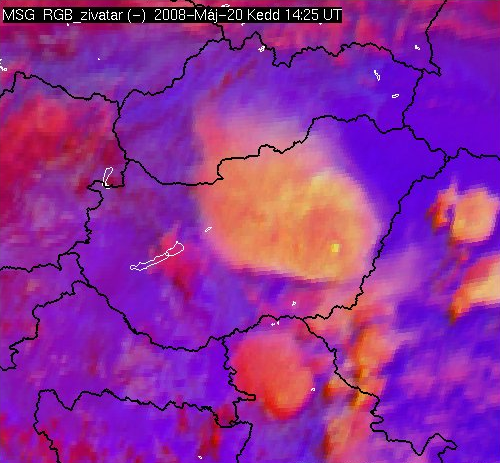
Meteosat, SEVIRI Severe Storms RGB images for 29 June 2006 12:25 UTC (left) and 20 May 2008 14:25 UTC (right)
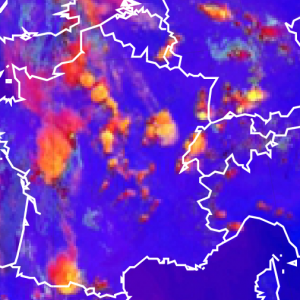
The image below shows convection above Africa.
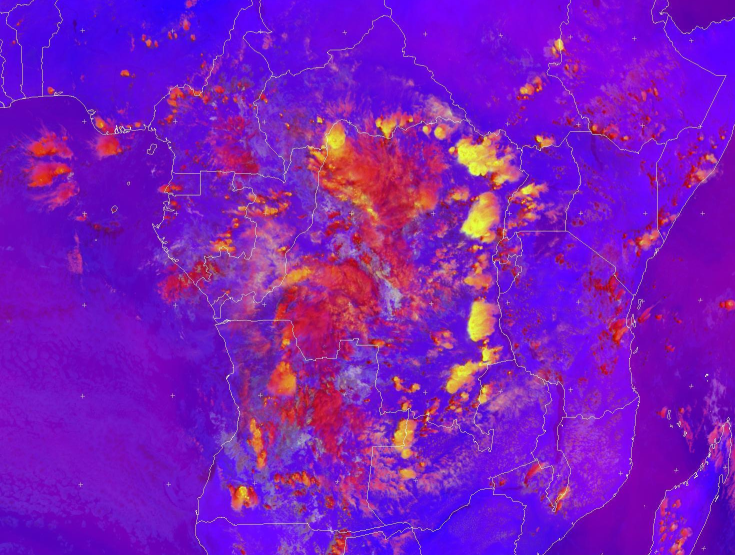
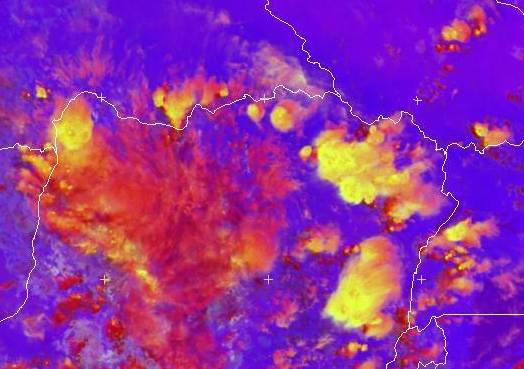
Note that small ice crystals may form not only due to intense updraft. Small ice crystals can be as well observed: on the tops of storms with cold (high) cloud base, in high level lee clouds and on the tops of polluted thick ice clouds.
Explanation of the colours of thick ice clouds (see the recipe):
• The difference (WV6.2 – WV7.3) is usually negative, but for high ice clouds it is around zero resulting intense signals in the red colour beam.
• The difference (IR3.9 – IR10.8) is high in case the cloud top is very cold and/or it consists of small particles, otherwise it is lower. (This difference serves as an approximation of the 3.9 micrometer reflectivity value - small ice crystals reflect more solar radiation than large ones. However, it depends on the cloud temperature as well.)
• The difference (NIR1.6 – VIS0.6) is large negative because the reflectivity values of ice clouds are much lower around 1.6 micrometer than around 0.6 micrometer. This gives low signal in the blue colour beam.
As a consequence the signal will be intense in red and low in blue colour beams for thick ice clouds. The difference of the (IR3.9 – IR10.8) determines whether the resulting colour will be red or yellow or some colour in between.
Dry sinking air masses appear red in the Airmass RGB images.
The reddish color is an indication for a day air mass, mostly resulting from sinking processes. This phenomenon can often be observed at or near ongoing cyclogenesis. Potential Vorticity (PV) is a good indicator for this dynaic process. So called "PV anomalies", i.e. a local height minimum of the 1.5 PV-value surface indicate the downward motion of dry stratospheric air. The 1.5 PV-value surface is often considered as the "dynamical tropopause".
As the air is getting dryer when sinking compared to the surrounding air masses, both the WV6.2 and the WV7.3 channels exhibit rather high values of the brightness temperature (BT). Still the BT of channel WV7.3 is a little bit higher than from channel WV6.2 as the latter is more affected by water vapour absorption. The BT difference (BTD) WV6.2-WV7.3 is smaller within dry areas than outside, and hence the contribution of the red colour beam is large.
The stratospheric air is ozone rich, hence the BT of IR9.7 low, the BTD IR9.7-IR10.8 strongly negative. Therefore, the impact of the green colour beam is low.
The contribution from the blue colour beam is rather small, if not zero. The temperature scale for channel WV6.2 is chosen such that high BT give only little contribution to the blue colour beam.
The Airmass RGB image below shows a reddish area over Scotland and the North Sea. A cyclogenetic process is ongoing.

Airmass RGB for 13 January 2016 12:00 UTC
The Airmass image below shows a red zone over the Arabian peninsula (10th May 2012 at 06:00 UTC). In tropical and subtropical regions the Airmass RGB depicts hot and dry air masses in red-orange tones. The dryness of the air is due to missing moisture supply from the desert and not because of dynamic effects.
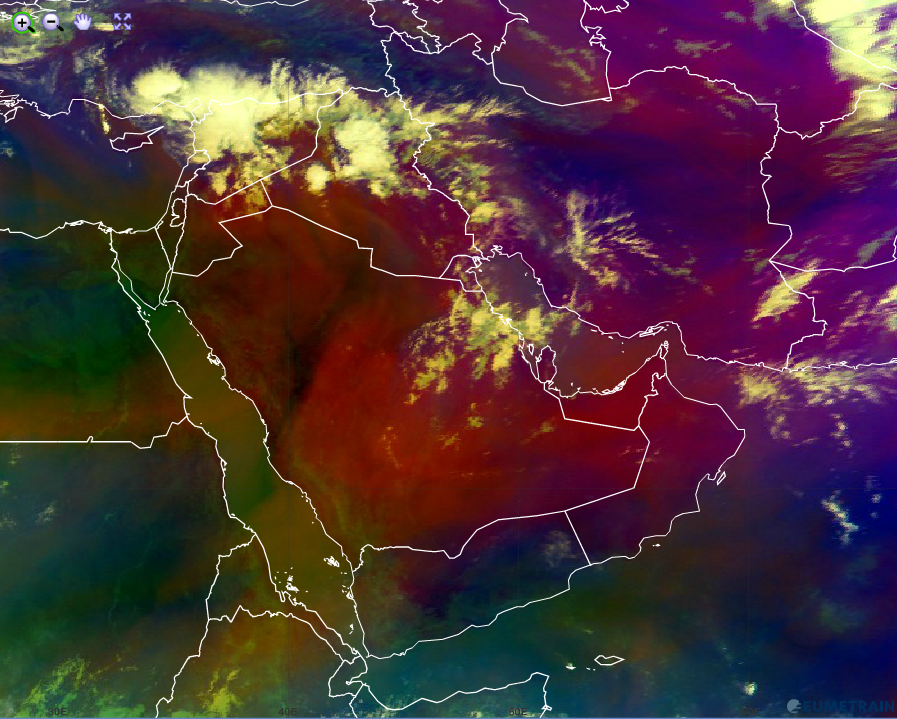
Airmass RGB for 10 May 2012 06:00 UTC
Explanation of the red colour of dry air masses in the Airmass RGB (see the recipe):
• Dry air masses are characterised by their reddish colour in the Airmass RGB. This results from a combination of a low tropopause level (cold airmass) and high ozone concentration in the level of highest instrument sensitivity in combination with strong radiances in both WV channels.
• In warm air masses, red/orange areas depict dry and hot air.
Bare soils and deserts appear red in the Natural Colour RGB images.
The reflected solar radiation at NIR1.6 from sand and non-vegetated surfaces is stronger than reflected solar radiation in both visible channels (VIS0.6 and VIS0.8) as can be seen in the image below of the Arabian peninsula. Sandy deserts are shown in red colours.
Rocky fields and vegetationless mountains appear darker (green circles). Reflected solar radiation at 1.6 micrometer has about the same intensity over rocks than radiation measured in both VIS channels.
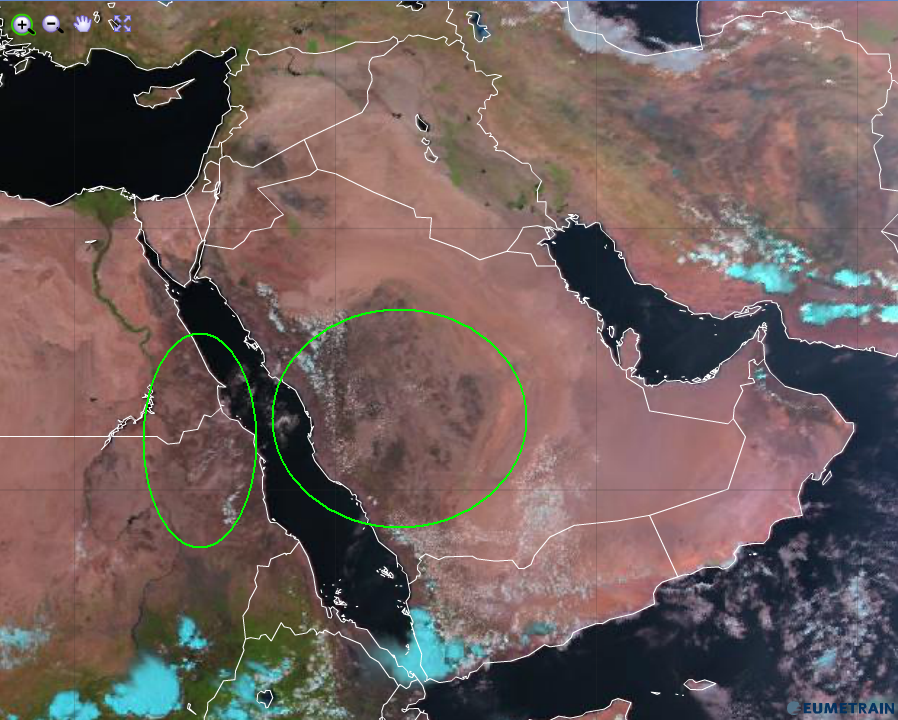
Natural Colour RGB for 12 September 2013 12:00 UTC
When the vegetation cover deteriorates during the hot summer months, the colour changes from green to red as can often be observed over land around the Mediterranean Sea.
Explanation of the colours of sand and bare soil in the Natural Colour RGB (see the recipe):
• Sandy deserts and bare soils reflect short wave solar radiation much stronger at 1.6 micrometer than at 0.6 and 0.8 micrometer. Therefore the red channel is dominant over the green and blue colour beam.
• For rocky deserts and mountains, the predominance of the reflected solar radiation at 1.6 micrometer diminishes so that the resulting colour is a dark red to dark grey (all 3 channels show the same intensity of reflected solar radiation).