
brown
Vegetated land appears brown in the Cloud Phase RGB. The shade of brown depends on the vegetation type and the green vegetation fraction. Denser green vegetation appears darker brown.
The figure below shows the western part of Europe in June both in the Cloud Phase and in the Natural Colours RGBs. In this region green vegetation is rather dense in June. In the Cloud Phase RGB, the cloud-free land appears brown, mostly in medium or dark shades. Mountain regions covered by forest usually appear dark brown.
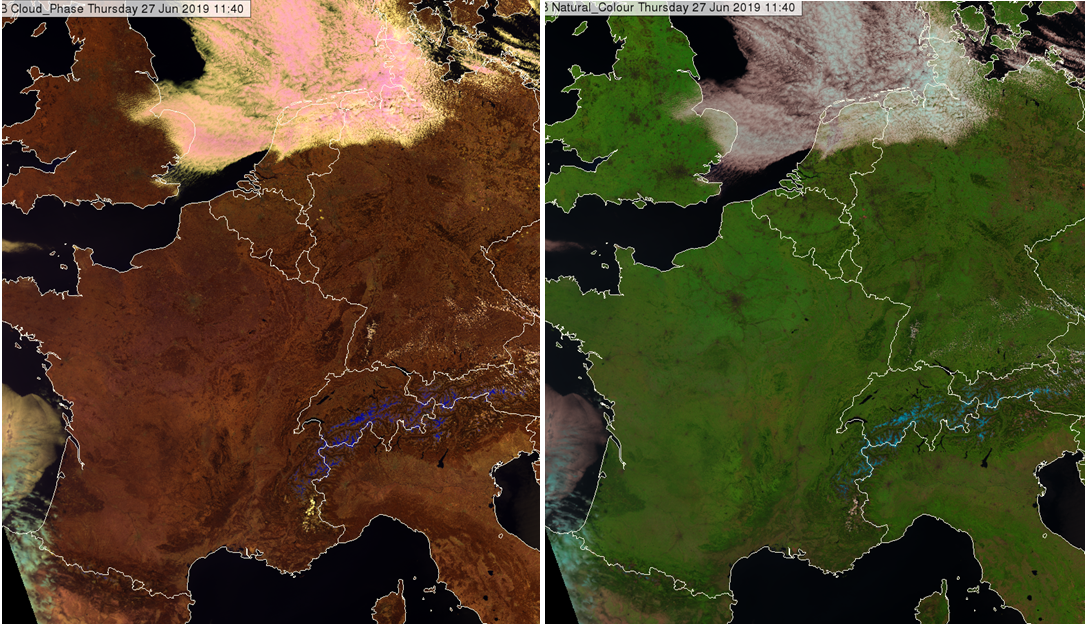
Fig. 1: VIIRS Cloud Phase and Natural Colours RGB images for 27 June 2019, 11:40 UTC
The figure below shows the Crimean Peninsula, the Black Sea and its northwestern coast in June and August. The Natural Colours RGB helps identify the areas covered by green vegetation.
The mountains along the southern coast of the Crimean Peninsula appear darker brown in the Cloud Phase RGB as it is covered mainly by forests. Seventy-five percent of the remaining area of the Crimea consists of semiarid prairie lands (steppe, grass land), which is dominant along the Ukrainian coast of the Black Sea as well. These areas appear brighter brown in June. In August their colours become more yellowish.
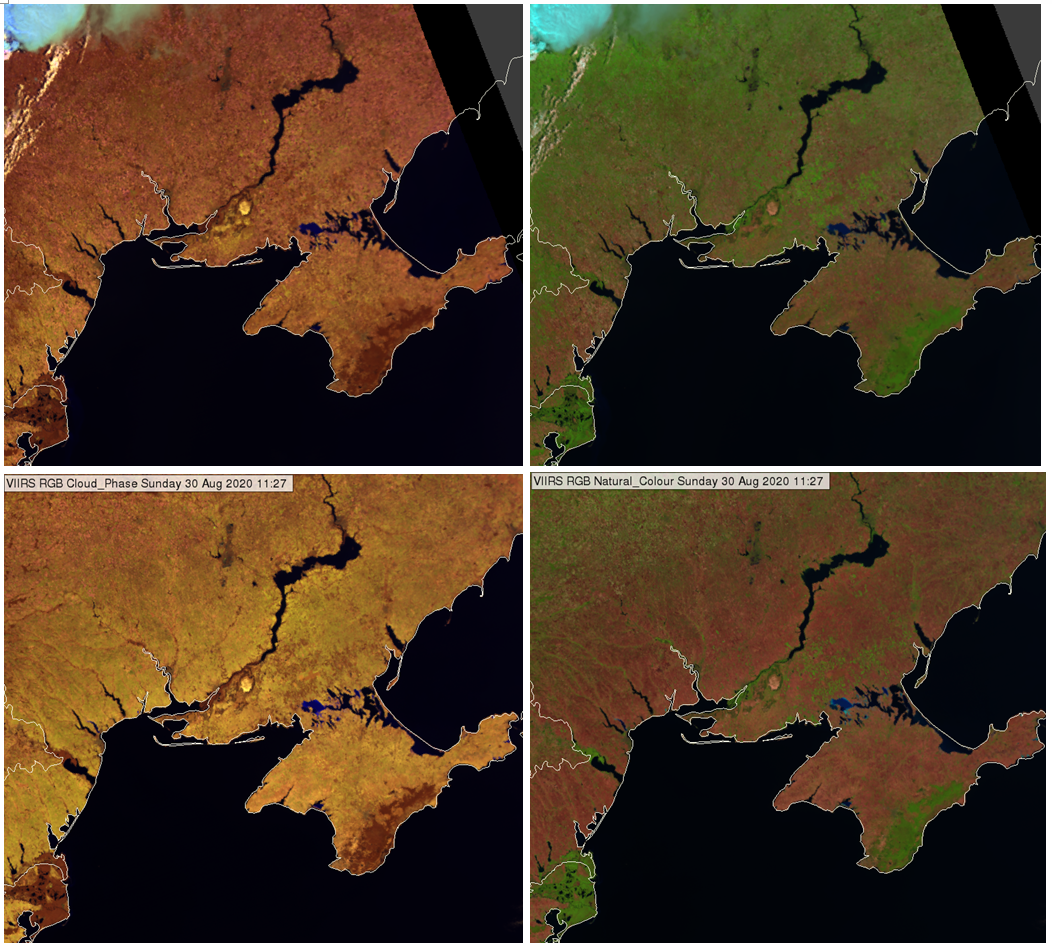
Fig. 2: VIIRS Cloud Phase RGB (upper left) and Natural Colours RGB (upper right) for 27 June 2019, 11:40 UTC. Cloud Phase RGB (bottom left) and Natural Colours RGB (bottom right) for 30 August 2020, 11:27 UTC
The left panel of the figure below shows the Danube Delta, while the right panel shows the Nile Delta.
The Danube Delta is covered mainly by dense green reeds. Some smaller areas are covered by forests. Open water of larger lakes is also present. The Danube Delta appears dark brown because of the mix of dense green vegetation and some pixels over open water. The Nile Delta and the coast of Nile is covered by dense green vegetation.
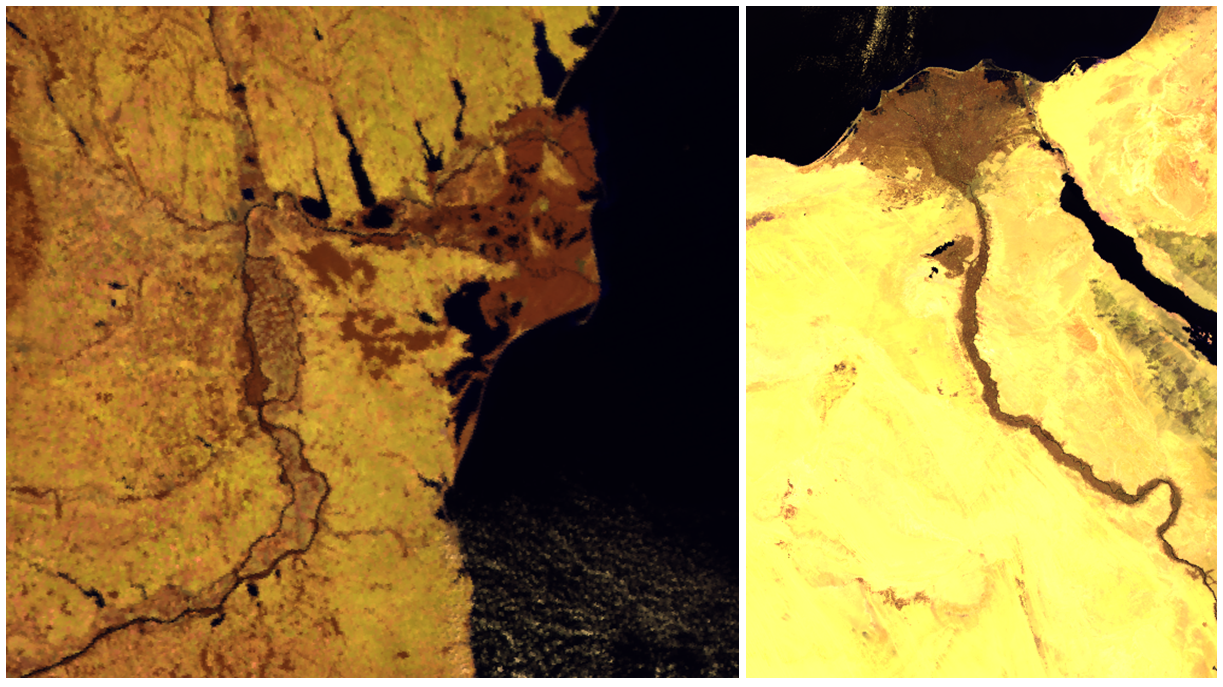
Fig. 3: The Danube Delta on VIIRS Cloud Phase RGB, 30 August 2020, 11:27 UTC (left) and the Nile River and its delta on VIIRS Cloud Phase RGB, 27 April 2021 11:19 UTC (right)
The image below shows the Iberian Peninsula in September. Areas with dense green vegetation appear dark brown. Areas where the pixels are mixed with bare soil and sparse vegetation appear much lighter brown. The Natural Colours RGB is shown to help to identify the areas covered by green vegetation. The cloud-free area over France appears also lighter brown than in June (see Fig. 1).
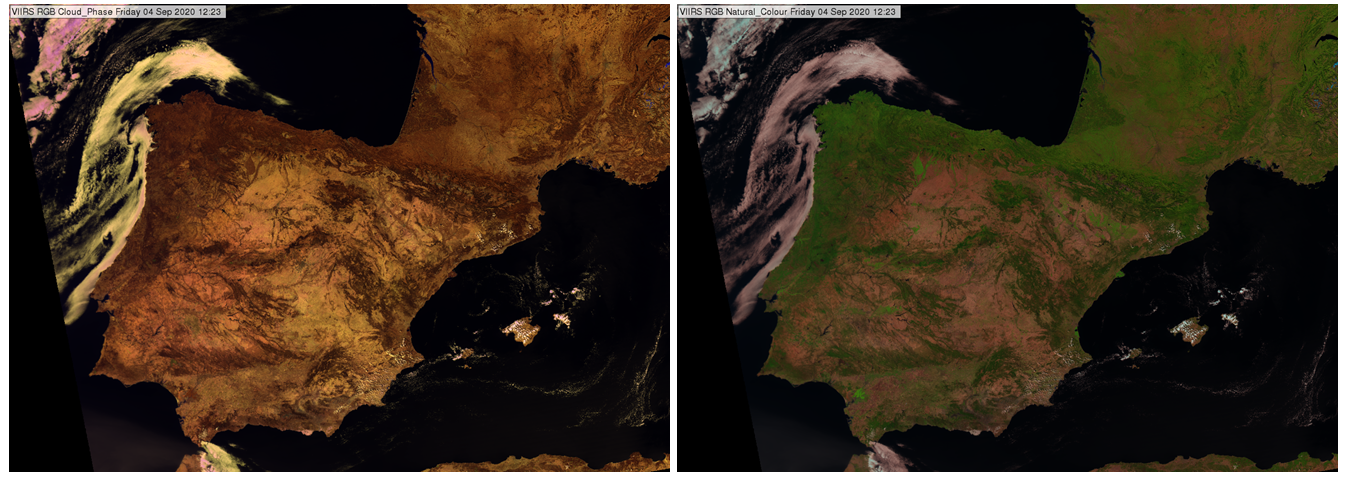
Fig. 4: VIIRS Cloud Phase and Natural Colours RGB images for 04 September 2020, 12:23 UTC
Note:
• Land is seen only in cloud-free areas.
• The brown shades depend on the solar and satellite viewing angles as well.
• Bare soil without green vegetation may appear almost yellow, with some brownish shades depending on the soil type and wetness. Rocky mountains may appear brownish or grey. Sandy deserts is yellow in Cloud Phase RGBs.
Explanation of the colour of vegetated land in the Cloud Phase RGB (see the recipe):
Vegetated land appears brown because the red signal is the strongest and the blue one is the weakest.
• If the pixel is covered by green vegetation then the red signal is the strongest and the blue one is the weakest, see the green vegetation curve in the graph below and the RGB recipe on the left site.
• If the pixel is covered by bare soil then all three signals are stronger, the level of the red and green signal are close to each other, while the blue one is much weaker, see the soil curve in the graph below and the RGB recipe on the left site. As a consequence the colour of the bare soil is lighter and may be close to yellow (depending also on the soil type and wetness).
• If the pixel is covered partly by vegetation and partly by bare soil, then it appears light brown.
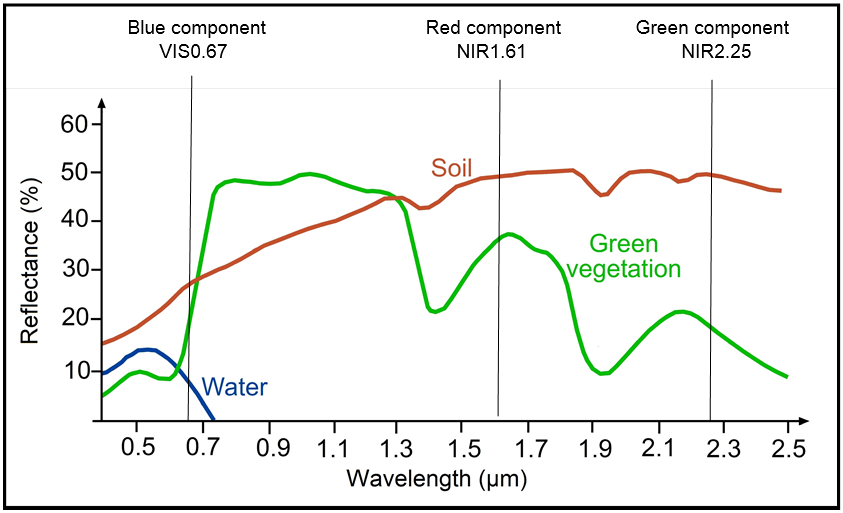
Fig. 5: Typical reflectance spectra of green vegetation, soil and water. The central wavelengths of the three channels the VIIRS Cloud Phase RGB is created from are indicated by vertical lines. © CEOS project
Note that sandy deserts appear yellow as the sand curve is similar to the soil curve, but with higher reflectance values.
Bare soils and deserts usually appear (reddish) brown or tan in the VIIRS True Colour RGB images. Colour shades depend on the soil/sand/rock type. Bare soils may appear darker brown. Sandy and rocky deserts are usually brighter than bare soils and appear in shades of brown, most often tan. The mountains in the Sahara are greyish brown. Australian deserts appear reddish brown.
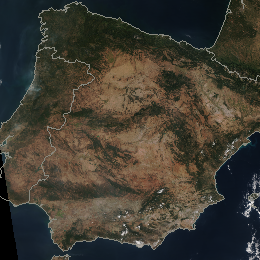
The next image shows the Iberian Peninsula at the beginning of October. Large areas not covered by green vegetation appear brownish/tan.
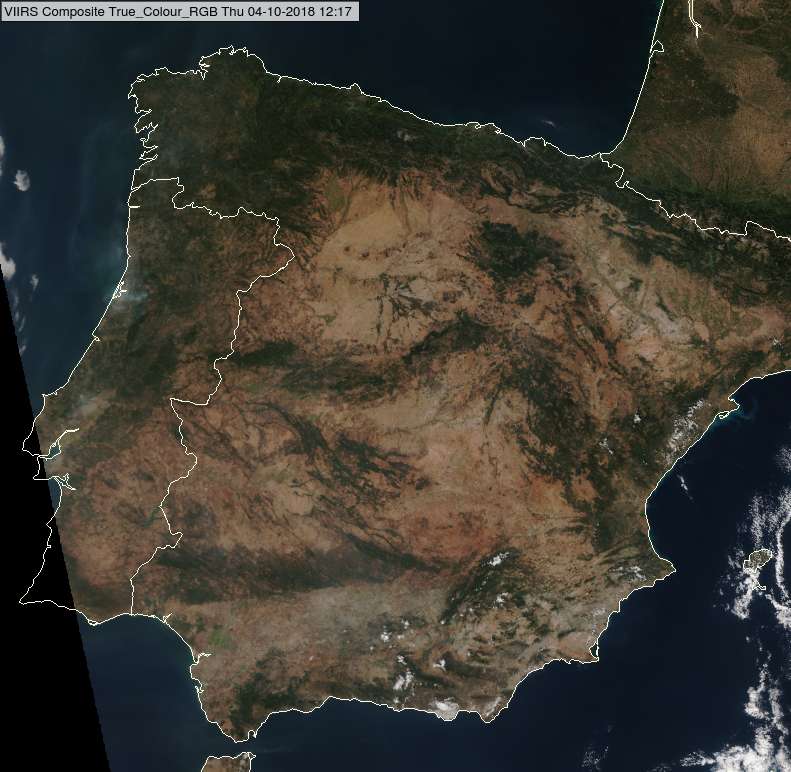
NPP, VIIRS True Colour RGB image for 04 October 2018, 12:17 UTC
The next image shows a part of Central Europe and the northern part of the Balkan Peninsula in February. Land, not covered by clouds or snow, appears (mostly dark) brownish. The reason for this are lowlands in these areas that lack the green vegetation in February; and the mountains with coniferous woods are not green in this image because of the snow cover.
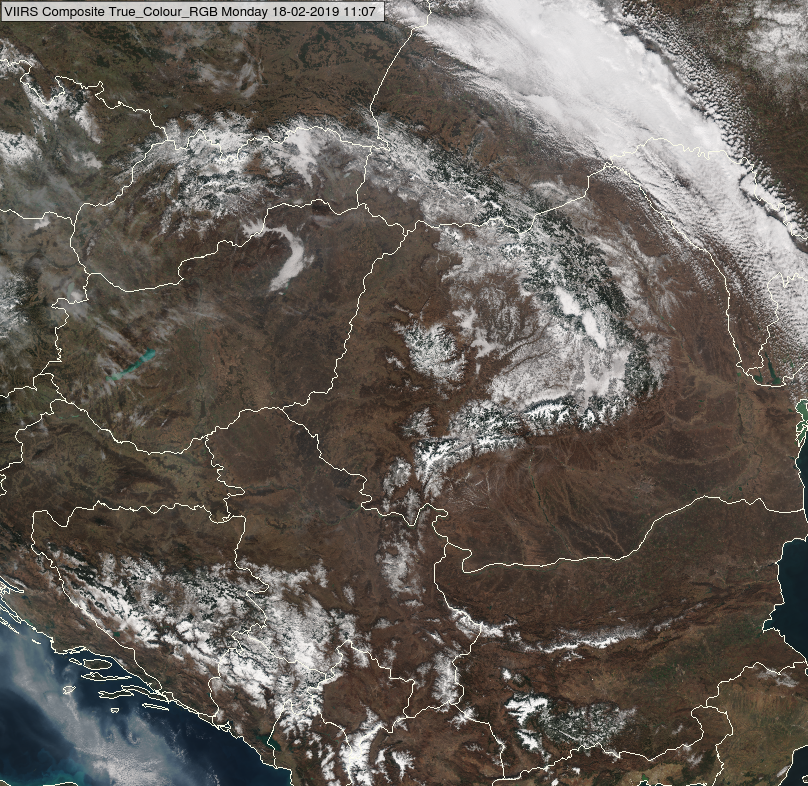
NPP, VIIRS True Colour RGB image for 18 February 2019, 11:07 UTC
Deserts appear in shades of brown. The next image shows the Taklamakan Desert in China. This is a sandy desert appearing tan in the True Colour RGB image.
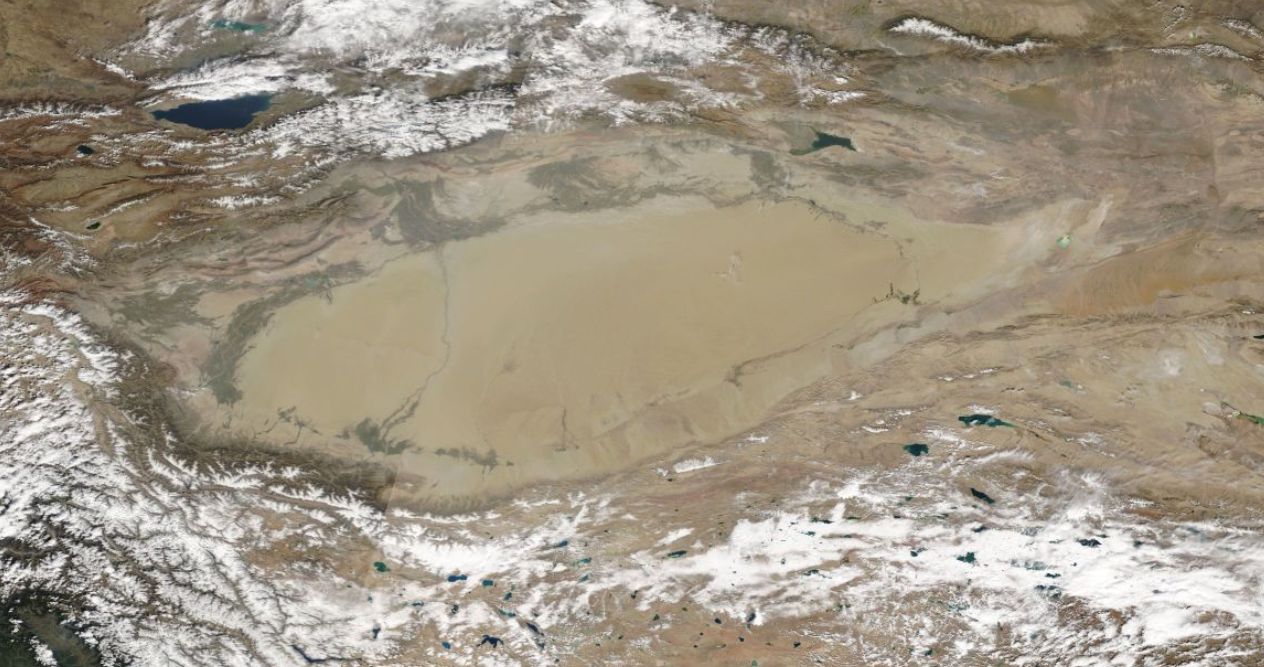
NPP, VIIRS True Colour RGB image of Taklamakan Desert, China, taken on 2 October, 2018
(Source: https://worldview.earthdata.nasa.gov)
The next image shows the Sahara and the Arabian Peninsula. The Sahara is mainly a rocky desert; some parts of the desert are sandy and there are (rocky) mountains as well. The Sahara appears in several colour shades: most of the area is tan, but mountains (rocks) appear greyish brown.
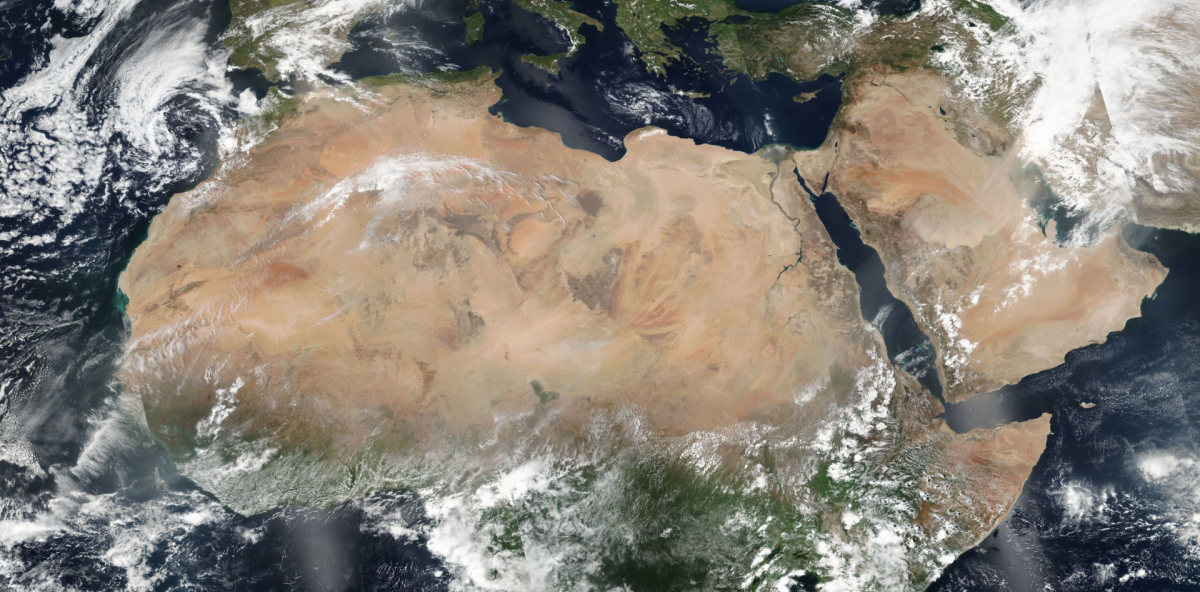
NPP, VIIRS True Colour RGB image for 23 April 2018, mosaic image composed from several overpasses (Source: https://worldview.earthdata.nasa.gov)
The Australian deserts are not completely devoid of vegetation, but have large areas with vegetation (very limited in height or extent). The majority of the Australian desert appears reddish brown (see the image below).
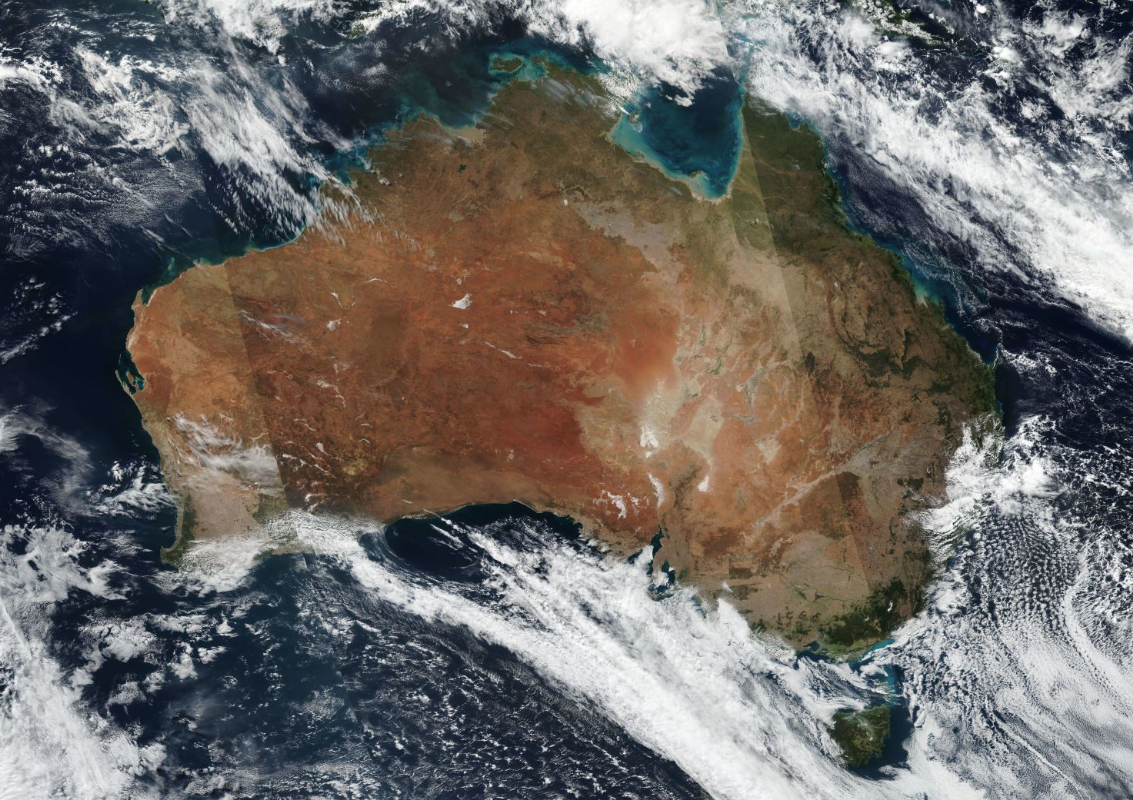
NPP, VIIRS True Colour RGB image for 14 May 2018, mosaic image composed from several overpasses (Source: https://worldview.earthdata.nasa.gov)
Note that the bare soil/desert reflectivity depends on the solar and satellite viewing directions as well. Towards the edge of the swath the colour brightness may vary (as an example, see the mosaic images above).
Explanation of the colour of bare soils and deserts in the True Colour RGB (see the recipe):
The reflectivity of bare soils is usually below 50% in all three channels of the True Colour RGB. It slightly increases with longer wavelength in the visible spectral range. That is why the bare soils appear brownish.
The reflectivity of sandy desert is more than 50% and slightly increases with longer wavelength in the visible spectral range. That is why it usually appears tan.
The majority of the Australian deserts appear reddish brown, the composition of the rocks is different, and additionally there is some green vegetation in these deserts which makes the colour shades slightly darker.
Pure volcanic ash clouds usually appear brownish or tan in the VIIRS True Colour RGB images. Very thin volcanic ash clouds may appear grey. If the ash plume is mixed with ice crystals (formed from water vapour originating from the volcano) than it may appear greyish. Volcanic SO2 gas is not seen in the True Colour RGB.
True Colour RGB images are ‘Rayleigh corrected’. This means the impact of Rayleigh scattering by the atmospheric molecules has been removed. This makes the images clearer. However, the impact of the aerosols’ scattering is not removed. This is one of the strengths of the True Colour RGB: it is quite sensitive to particulate matter in the atmosphere like smoke, smog, haze and dust.
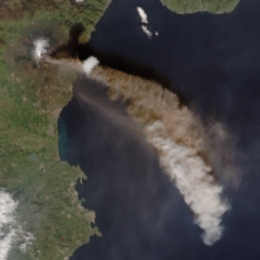
The next two images show an eruption of the Italian Mount Etna captured by NPP and NOAA-20 on the same day with only half an hour difference. Two plumes are seen originating from Etna: a grey plume and a darker, brownish coloured one. The tan/brown plume is the volcanic ash. Volcanoes usually eject not only ash into atmosphere, but gases and water vapour as well. From the water vapour, ice clouds are forming. In the image below, one can see such a greyish cloud plume (likely a mixture of ice crystals and ash) along the southern edge of the brownish ash plume.
The image below shows a smoke plume over the Aegean Sea.
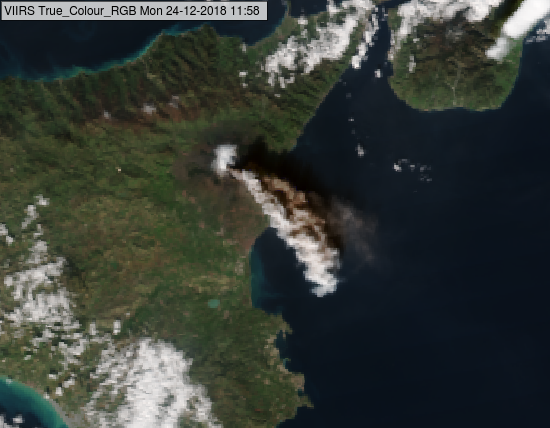
NPP, VIIRS True Colour RGB for 24 December 2018, 11:58 UTC
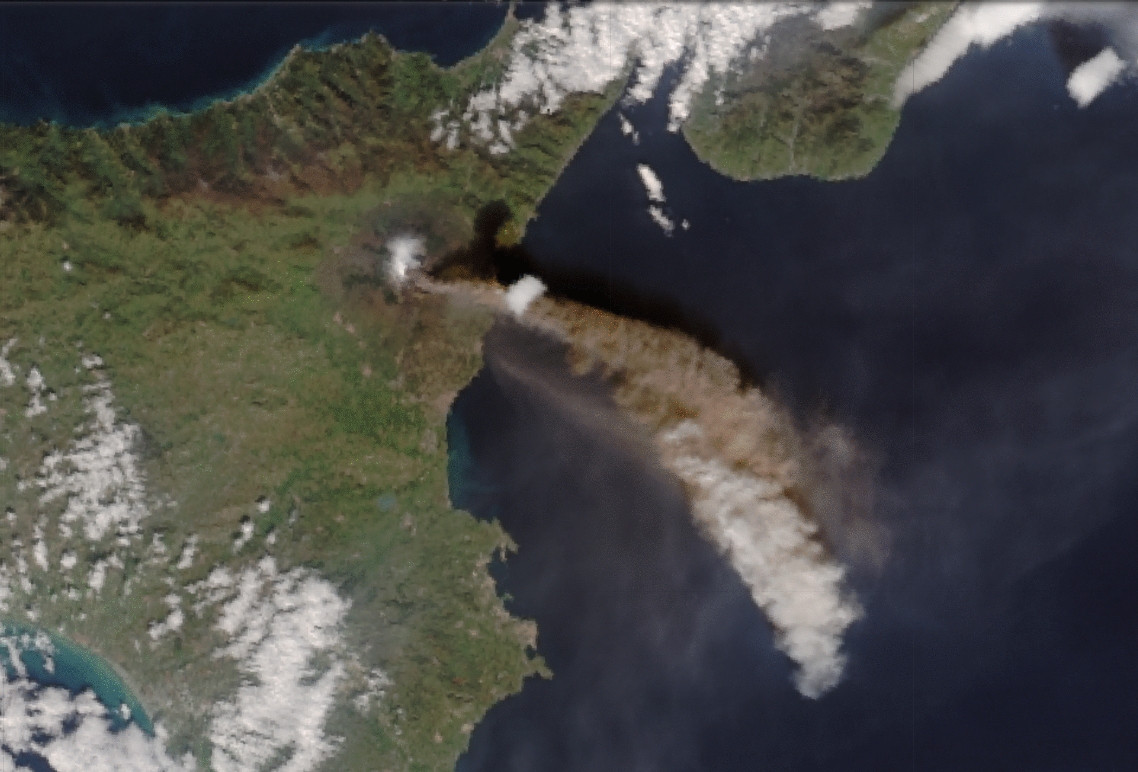
NOAA-20, VIIRS True Colour RGB for 24 December 2018, 12:20 UTC
(Source: https://cimss.ssec.wisc.edu/goes/blog/archives/category/volcanic-activity)
The next image shows the explosive eruption of the Fuego volcano in Guatemala (Central America). VIIRS acquired the image of the ash plume, after the ash (brown colour) had punched through a deck of clouds.
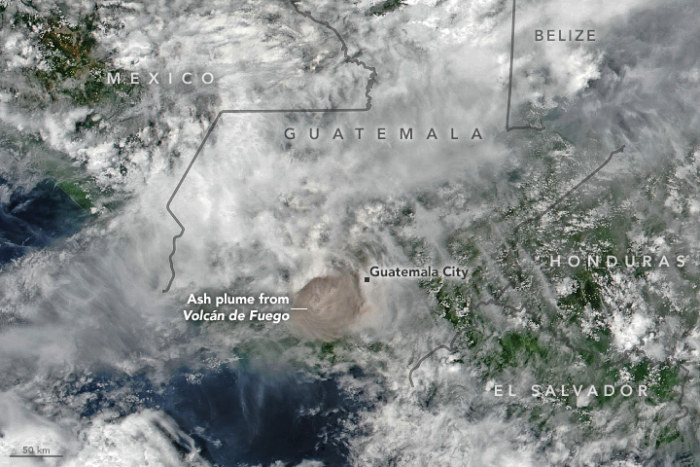
NPP, VIIRS True Colour RGB for 3 June 2018, 19:00 UTC
(Source: https://disasters.nasa.gov/mount-fuego-eruption-2018/viirs-and-omps-view-deadly-fuego-eruption)
The next image shows the eruption of the Pavlof Volcano in Alaska. The volcanic ash plume appears in brown hue.
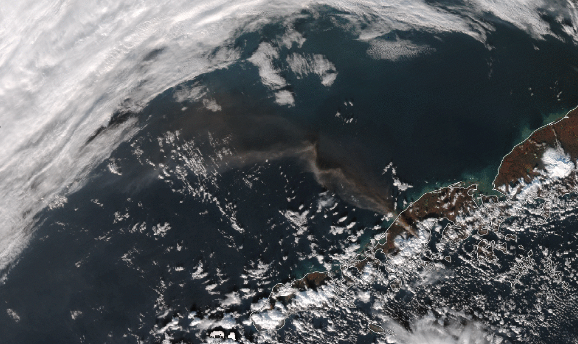
NPP, VIIRS True Colour RGB for 14 November 2014, 12:00 UTC
(Source: http://cimss.ssec.wisc.edu/goes/blog/archives/17179)
Note that:
• Pure volcanic ash clouds usually appear brownish or tan.
• Volcanic SO2 gas is not seen in the True Colour RGB.
• Thin volcanic ash clouds may appear greyish.
• If the ash plume is mixed with ice crystals (formed from water vapour originating from the volcano), it may appear greyish.
• Thick dust clouds usually appear also brownish grey, but its brownish shade is weaker.
• Other aerosol types appear mostly greyish. Pure biomass smoke tends to be bluish grey or grey, while haze appears grey.
• Towards the edge of the swath, a thin volcanic plume looks thicker, while along the sub-satellite track it looks thinner.
Explanation of the colour of volcanic ash clouds in the True Colour RGB imgages (see the recipe):
The aerosol particles scatter the visible radiation. The reflectivity of a thick aerosol plume depends on its concentration, the type of aerosols (its composition), the average particle size, the solar and satellite viewing angle and on the wavelength.
A thick volcanic ash cloud appears brownish or tan in the True Colour RGB, as its reflectivity is stronger at longer wavelengths.
In case of thin volcanic ash clouds, the measured radiance depends on the characteristics/reflectivity of the underlying surface as well. The satellite observes a combined signal:
• Radiation scattered by the dust particles into the direction of the satellite sensor and
• Radiation transmitted through the thin dust plume in the direction of the satellite sensor.
The weighting factor of the combination depends on the dust cloud transmissivity.
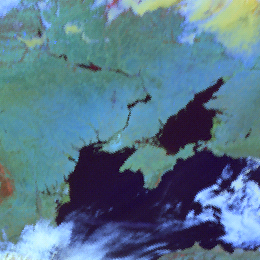
Snow free, non deserted vegetated land appears green, greenish or brownish in the Snow RGB images depending on the (solar and satellite) viewing angles, the surface type, and the type, and the development of the green vegetation. Bare soil may appear slightly bluish (see the image on the left side).
In the image below, most of European land is snow free. If there is snow on the ground, the snowy areas appear red- orange: see for example the Alps, Pyrenean and Carpathian Mountains.
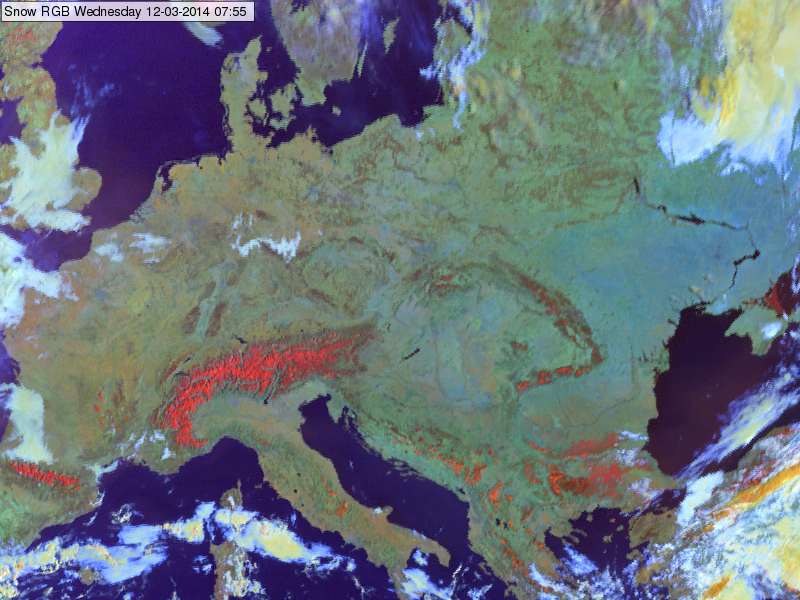
Meteosat, SEVIRI Snow RGB for 12 March 2014 07:55 UTC
In the ‘real’ winter months at mid latitudes (when this image is most often used) land appears mostly greenish, like in the image below taken in January.
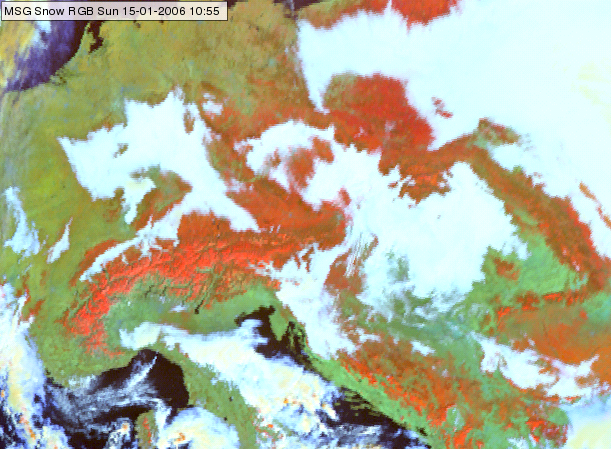
Meteosat, SEVIRI Snow RGB for 15 January 2006, 10:55 UTC
Explanation of the colours of non deserted snow free land (see the recipe):
• The reflectivity values are comparable in the 0.8 and 1.6 micrometer channels and very low in 3.9 micrometer channel. The reflectivity depends on the surface type, and also on the type and development stage of the vegetation. Additionally it considerably depends on the viewing angles.
• After the linear stretching (of the channel depending reflectivity ranges, see the recipe on the left) and gamma correction, the green component often becomes strongest, and the blue component gets closer to the red and green components.
The resulting colour depends on the relative magnitudes of the colour components.
• For vegetated area the blue component is low. The land appears green or greenish brown.
-------> Wintertime (with less vegetation and lower solar elevations) the land appears typically green, forests may appear brownish.
-------> In other seasons the red and green signals are often comparably strong and so the land appears more often brownish (usually with green tones).
• For bare soil area the blue component may become slightly higher than the other two components, in these cases the land may appear greyish blue.
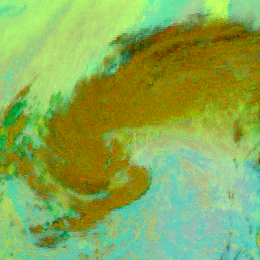
Thick ice clouds appear brown in the Ash RGB images.
The image below shows frontal cloudiness and deep convective clouds.
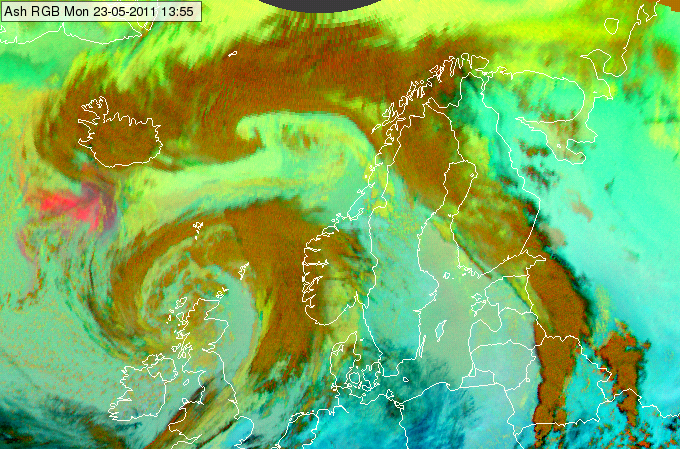
Meteosat, SEVIRI Ash RGB image for 23 May 2011, 13:55 UTC
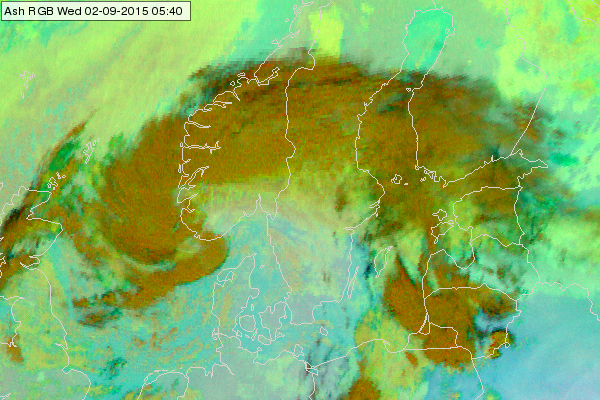
Meteosat, SEVIRI Ash RGB image for 02 September 2015 05:40 UTC
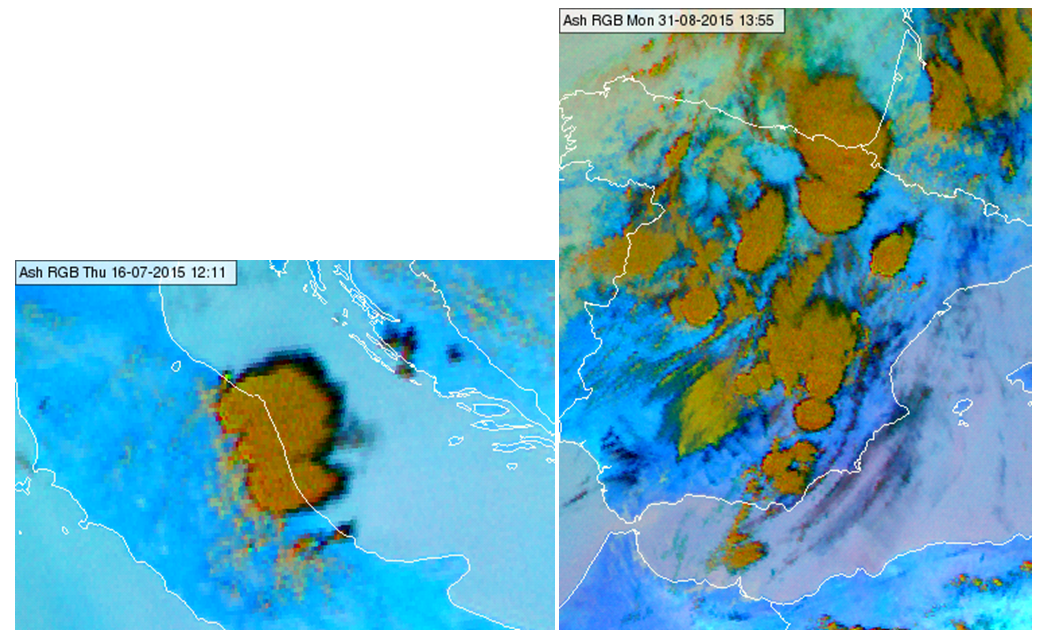
Meteosat, SEVIRI Ash RGBimages for 16 July 2015 12:10 UTC (left) and 31 August 2015 13:55 UTC (right)
Explanation of the colour of thick ice clouds (see the recipe):
• For thick ice cloud the brightness temperature values are close to each other in all three channels the Ash RGB is composed from. Both the (IR12.0 - IR10.8) and the (IR10.8 - 8.7) brightness temperature differences are around zero. However, the red signal will be higher than the green signal due to the different ranges of the linear stretching (see the recipe on the left).
• The blue signal is low, most often zero, as the IR10.8 brightness temperature of a thick ice cloud is usually less than the lower limit of the appropriate range (-30 Celsius degree).
As a consequence the thick ice cloud appears brown in the Ash RGB images.
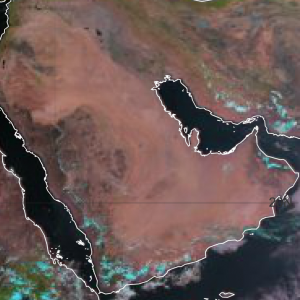
Bare soils and deserts appear red in the Natural Colour RGB images.
The reflected solar radiation at NIR1.6 from sand and non-vegetated surfaces is stronger than reflected solar radiation in both visible channels (VIS0.6 and VIS0.8) as can be seen in the image below of the Arabian peninsula. Sandy deserts are shown in red colours.
Rocky fields and vegetationless mountains appear darker (green circles). Reflected solar radiation at 1.6 micrometer has about the same intensity over rocks than radiation measured in both VIS channels.
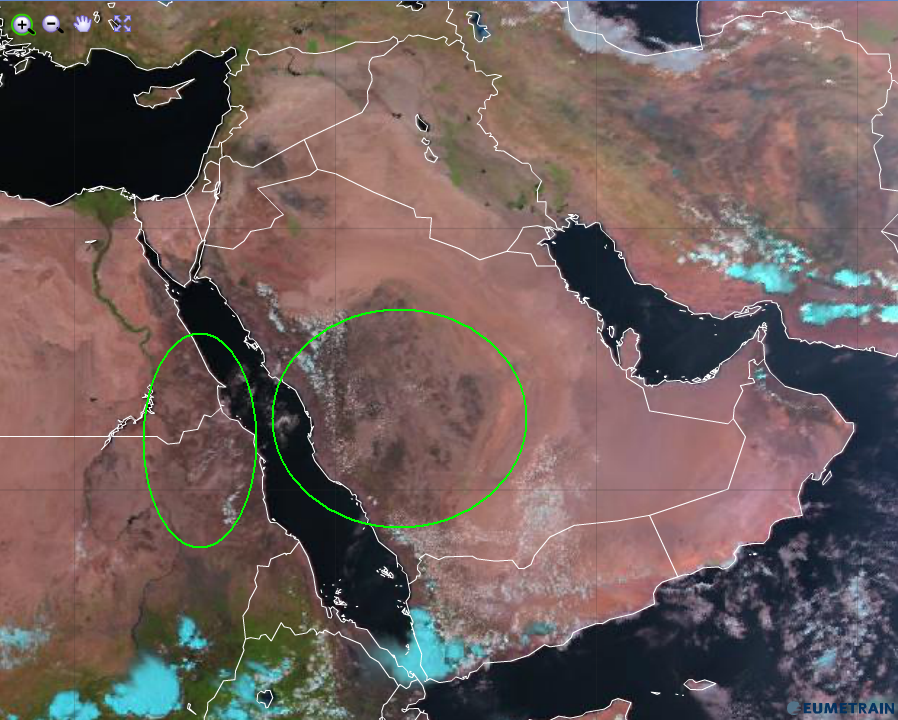
Natural Colour RGB for 12 September 2013 12:00 UTC
When the vegetation cover deteriorates during the hot summer months, the colour changes from green to red as can often be observed over land around the Mediterranean Sea.
Explanation of the colours of sand and bare soil in the Natural Colour RGB (see the recipe):
• Sandy deserts and bare soils reflect short wave solar radiation much stronger at 1.6 micrometer than at 0.6 and 0.8 micrometer. Therefore the red channel is dominant over the green and blue colour beam.
• For rocky deserts and mountains, the predominance of the reflected solar radiation at 1.6 micrometer diminishes so that the resulting colour is a dark red to dark grey (all 3 channels show the same intensity of reflected solar radiation).