
Understand NWP outputs
Length: 55 min
Authors: Andreas Wirth, Yasmin Markl (ZAMG)
The lecture continues on the material from the second chapter of the course that concerned fronts, convection, low cloudiness, atmospheric waves and all types of clouds associated with those processes. In the first part Andreas goes over the Norwegian school once again and through some convective cases. Yasmin later on goes through low cloudiness and fog cases and the lecture finishes with gravity waves.

Presentation 10 from the Synoptic and Mesoscale Analysis of Satellite Images 2016
Length: 66 min
Author: Wilfried Jacobs (DWD)
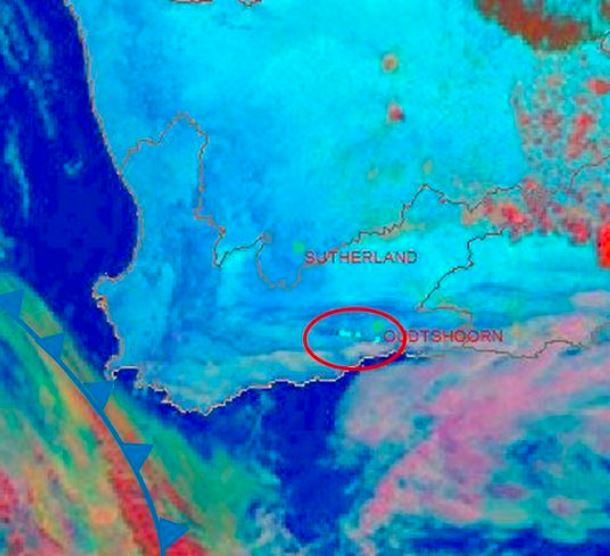
Satellite image interpretation of shallow clouds and related weather phenomena is a very important task for nowcasting because NWP-models and statistical methods exhibit still deficiencies in simulating these phenomena in a proper way. Especially over oceans but also over land observation networks are often too coarse meshed for nowcasting.
The theory and the most suitable satellite products will be explained first. In combination with other data (e.g., observations, radio soundings, radar products) examples will be discussed for the following application areas:
1. Diagnosing shallow clouds in respect to water content and related weather, e.g., drizzle of different intensities;
2. Identifying fog and low stratus and how to estimate the fog/stratus layer’s thickness. The likelihood of dissolving and connected weather phenomena (e.g., freezing drizzle) will be covered, too.
Presentation 9 from the Synoptic and Mesoscale Analysis of Satellite Images 2016
Length: 50 min
Author: Frans Debie (KNMI)
Convection can be found everywhere on the planet. However in meteorological way of thinking in mid-latitudes there is convection in different airmasses and also at the boundary of these airmasses. Convection at the boundaries belongs to the sub-features of frontal systems and we won’t deal with convection in the frontal systems.
In this lecture a few examples of unstable air Conceptual models will be shown, for instance: Cumulonimbi, Enhancement of convection by PV, Spanish Plume, etc. The typical environment is one part and the organization modes is the second part of the lecture.
Presentation 8 from the Synoptic and Mesoscale Analysis of Satellite Images 2016
Length: 51 min
Author: Justyna Wodziczko (MetNo)
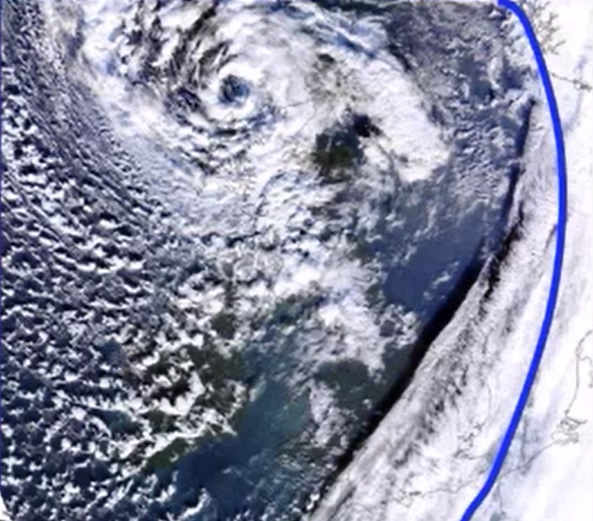
Polar Lows are generally characterized by severe weather in form of strong winds, snow showers sometimes even hail, which sometimes results in loss of lives, especially on the sea. Sometimes these systems are also connected with the term Arctic Hurricane, which had been used for especially intense Polar lows. Compromising definition of Polar low is: small, but fairly intense low in northern maritime regions.
The polar lows are formed in cold air outbreaks, north of the polar front, mostly in the regions east of 0°E and south of 75°N. Favorable season for them is the cold part of the year. By size, they are smaller (200-600 km) than ordinary synoptic lows with life-span typically around 18 hours, and with very intense change of weather.
Why was it difficult to forecast polar lows and what are the improvements in that area since 2000? In my presentation I will also show you how we are forecasting Polar lows, which models we are using and of course satellite products.
Presentation 7 from the Synoptic and Mesoscale Analysis of Satellite Images 2016
Length: 60 min
Author: Veronika Zwatz-Meise (former ZAMG)
Commas are meso-scale structures developing within cold air, that can cause severe weather on the ground, often behind frontal cloud bands. They occur mainly during the cold season and are a common feature for Northern and Western Europe - nevertheless commas can also be found in the south. In this lecture life cycles and the appearance of commas in satellite imagery will be demonstrated. Different types of development exist - Within the cold air commas can grow out of EC starting as a small feature which is growing in to the typical meso-scale cloud spiral. On the other hand commas can be found in connection with occlusion when they split off the cloud spiral and become a separate feature on their own. Typical weather events are storms and heavy precipitation (in form of showers and thunderstorms). Examples of real cases will be shown and they shall illustrate the typical synoptic situations.
Presentation 6 from the Synoptic and Mesoscale Analysis of Satellite Images 2016
Length: 50 min
Author: David Schultz (University of Manchester)
Precipitation within extratropical cyclones often organizes into mesoscale substructures known as precipitation bands. The purpose of this presentation is to better understand how precipitation organizes into bands. We will discuss about Shapiro-Keyser and the Norwegian models of cyclones, why do they form, the differences between them, also where in cyclones precipitation bands form, their structures and evolutions, what controls their locations and intensities, and techniques to diagnose precipitation bands. In the end we will discuss about occlusion bands and how do they actually form considering latest researches.
Presentation 5 from the Synoptic and Mesoscale Analysis of Satellite Images 2016
Length: 79 min
Author: Veronika Zwatz-Meise (former ZAMG)
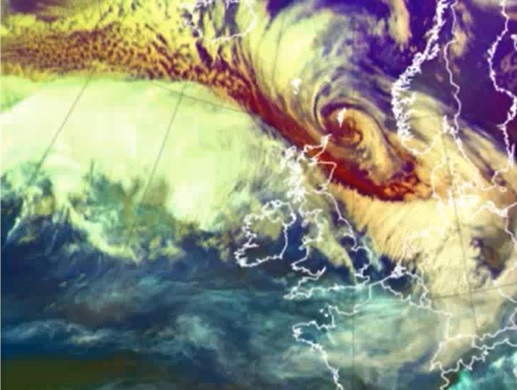
In this second part of the Cyclogenesis and Occlusion Cloud Bands lecture, a special form of cyclogenesis is treated in detail: the “rapid cyclogenesis” which is connected with very severe and often catastrophic weather events.
All processes and weather systems are presented from the aspect of “Conceptual Model thinking”; that means the typical appearance in satellite images is connected to the physical background which is responsible for the cloud configurations; then these results are connected to relevant numerical parameters in horizontal and vertical presentation. And all of the presented CMs are connected to the typical connected weather events. This combination of different meteorological material is especially important in forecasting and nowcasting.
Presentation 4 from the Synoptic and Mesoscale Analysis of Satellite Images 2016
Length: 75 min
Author: Veronika Zwatz-Meise (former ZAMG)
Cyclogenesis and occlusion cloud bands are common meteorological phenomena which are tightly connected. While “cyclogenesis” is a process, describing the development of a low centre, which can last from few hours to several days, the occlusion cloud bands are the result of this cyclogenesis process. Occlusion cloud bands differ from cold and warm front bands because of their history as well as their physical status.
The two lectures start from the classical cyclogenesis (occlusion) processes which are related to the classical polar front theory and introduce then the conveyor belt view of these processes culminating in the warm and cold conveyor belt occlusion types.
The occlusion cloud band types are described and compared to cold and warm front types in their horizontal as well as vertical depiction.
Also special subtypes of occlusion processes like “instant occlusion” and “cold air development” are mentioned.
Presentation 3 from the Synoptic and Mesoscale Analysis of Satellite Images 2016
Length: 61 min
Author: Andreas Wirth and Liliane Hofer (ZAMG)
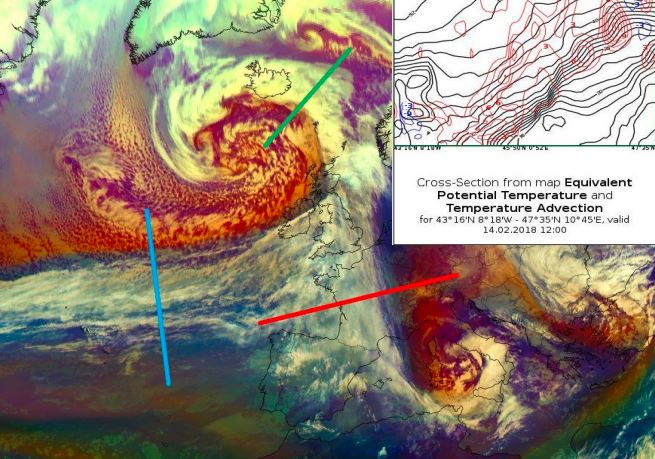
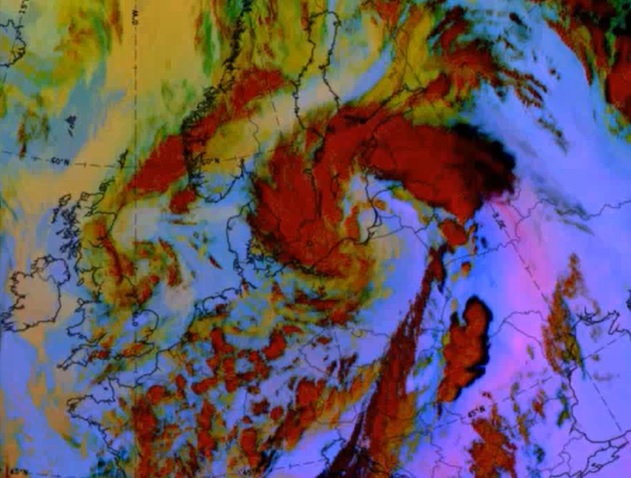
When observing the development of frontal zones in satellite imagery, forecasters should always keep an eye on frontal sub-structures like upper waves, front intensifications or rapid cyclogenesis. It is important to look for frontal substructures, because they often show new developments. NWP models sometimes catch the situation, sometimes not. Especially for rapid or small scale developments, model performance may leave a lot to be desired.
Here we focus on comparison of model outputs and satellite data regarding frontal substructures. Because the data are easily compared and show great results, satellite images are a good tool for model output verification.
Presentation 2 from the Synoptic and Mesoscale Analysis of Satellite Images 2016
Length: 52 min
Author: Ab Maas (former KNMI)
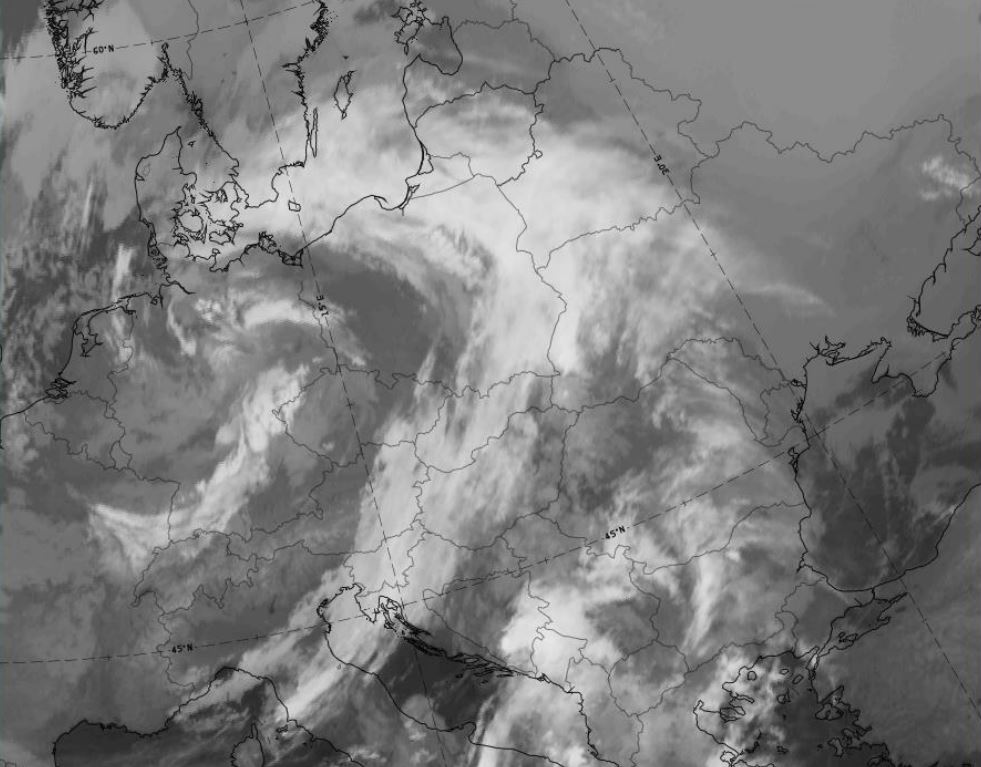
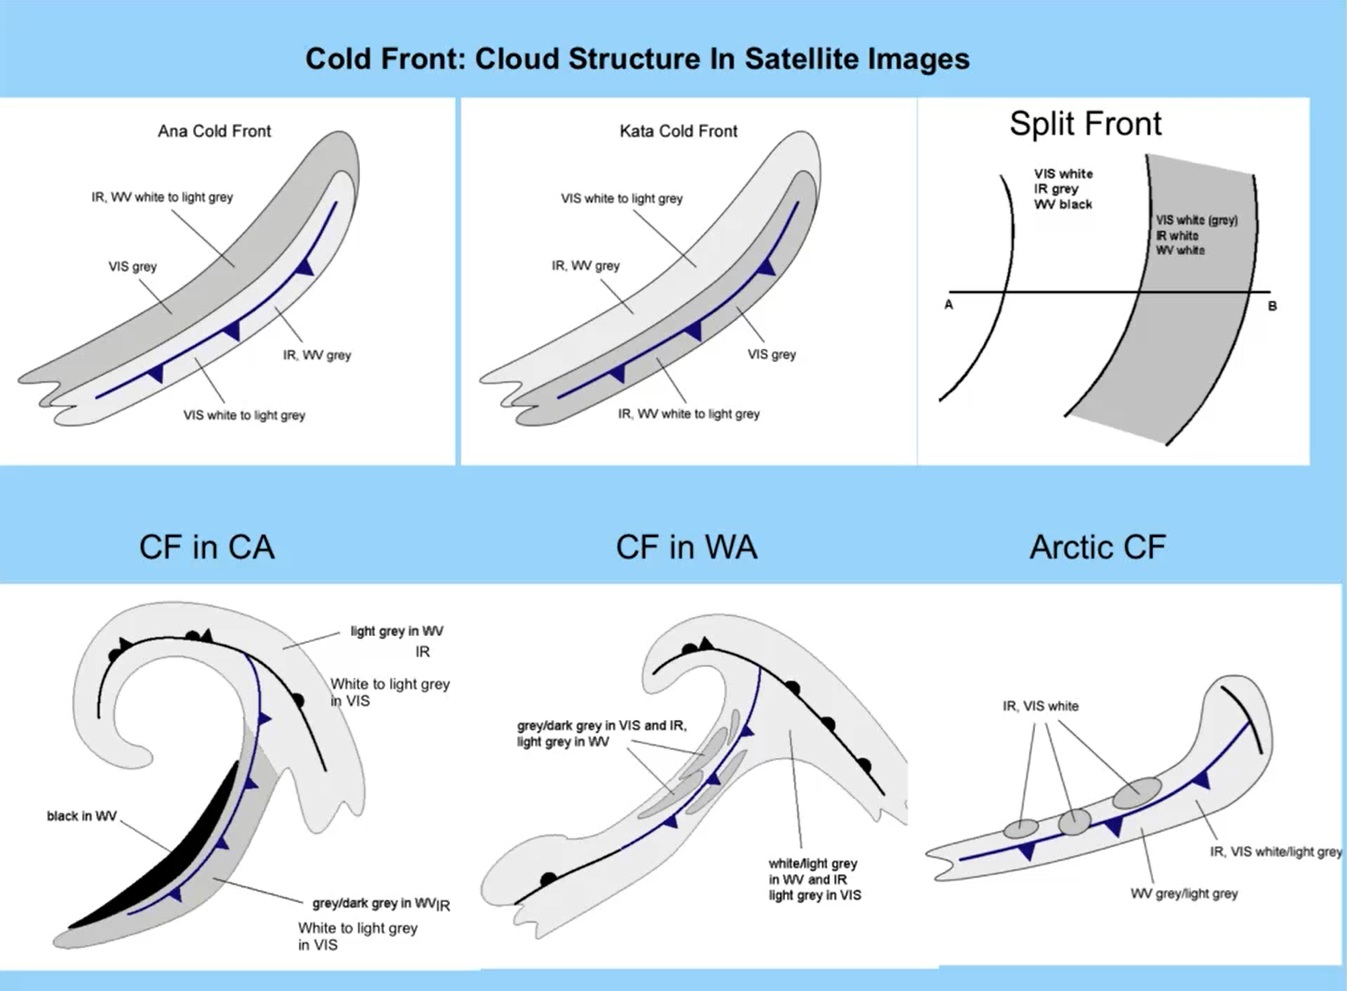
Fronts as described in the “Bergen school” by Vilhelm Bjerknes are early conceptual models. Parameters typical for the changing of air masses were named and used by forecasters to recognize transition zones (fronts) between air masses. Satellite information expressed how right Bjerknes was in his CM thinking, but this information showed also that fronts can have much more complicated structure and life cycle Bjerknes could imagine.
In SatManu there are 5 different types of cold- and 3 different types of warm fronts that are recognized and described.
In this lecture we concentrate on warm- and cold fronts and show how we can analyze them with help of CM thinking.
Presentation 1 from the Synoptic and Mesoscale Analysis of Satellite Images 2016
Length: 56 min
Author: Ab Maas (former KNMI)
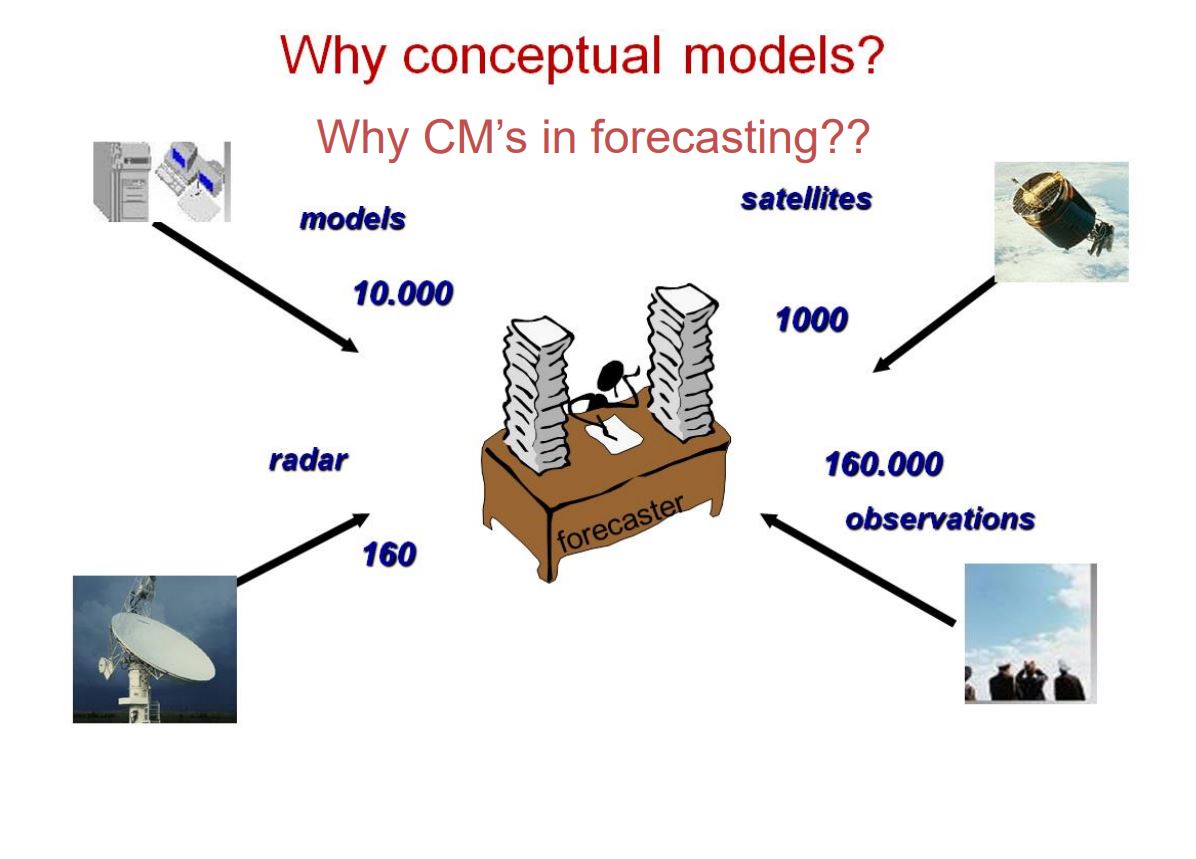
Getting a good, actual weather picture within short time is essential for a forecaster who has to react quickly and adequately on weather changing’s.
The huge amount of weather data which are available makes it almost impossible for a human being to handle. Thinking in conceptual models is the only way to deal with this problem
Meteorological satellites opened a whole new field in the conceptual model thinking in operational meteorology. Now there was an opportunity to recognize weather systems by detecting cloud patterns and verify this first guesses with observations and numerical parameters.
Within 20 years of the project fifty-three different conceptual models were described in a manual: Sat Manu. Also for the southern hemisphere, we have already fifteen CM’s described.
Presentation 11 in the Environment Event Week 2016
Length: 30 min
Author: Lee-Ann Simpson (SAWS)
South Africa is by nature a dry country, which has very short wet periods, mainly confined to the coastal areas and eastern half of the country. During the dry season, the hot, windy conditions result in a favourable environment for fires to spread uncontrollably and cause large scale damage to the local vegetation and to infrastructure. To be able to anticipate and forecast the risk of runaway fires in South Africa, a forecaster needs to have many sources of information, ranging from precipitation amounts to an understanding of the local vegetation. The inclusion of satellite imagery interpretation is an invaluable part of the forecasting process and the monitoring of fires can be done accurately and on a 24hour basis. This presentation will outline the risk the fires pose within South Africa and our forecasting processes dealing with this environmental hazard.