Weather development
At 06 UTC the cold front has removed to central France. Within this cold front we have a substructure in the east part of the Netherlands. This substructure can be identified as a wave. Key parameters are warm air advection, through at the surface and PVA500-maximum acting as a trigger to the convection. Taking a look at the Enhanced IR-image is a great chance to find out about the impact of frontal and even prefrontal cloud systems. The Enhanced IR allows you to easier discriminate the cold cloud tops and identify features such as cold ring shaped and u-shaped thunderstorms. These indicators help to locate overshooting tops and severe convection. In the present picture there are cold cloud tops over Poland resulting from the convergence zone. Furthermore there are cold cloud tops over Germany, Denmark and the Netherlands. Considering the situation in Vienna, there is still wind from south-east due to foehn and as you can see on the Enhanced IR-chart no significant cold cloud tops.
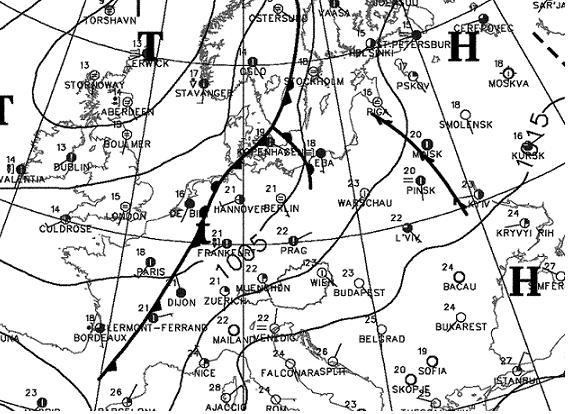
Figure 5: Surface chart/06 UTC
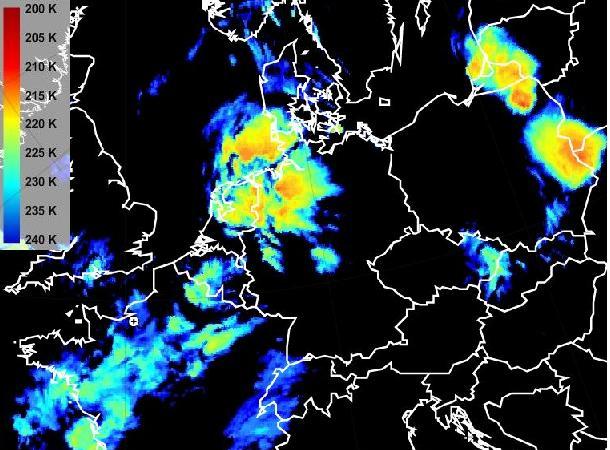
Figure 6: Enhanced IR10.8 (Meteosat9)/06 UTC
At 12 UTC the frontal system has slightly moved eastwards and the Enhancement IR shows cold zones over West Germany. To make further decisions it is a good idea taking a look at the Severe Storm RGB. This product is only available during day-time. As we can see here, cold cloud tops (Enhanced IR) in combination with yellow colours in the Severe Storm RGB indicate fierce weather with severe updrafts. So, over central Germany there is a young developing cell.
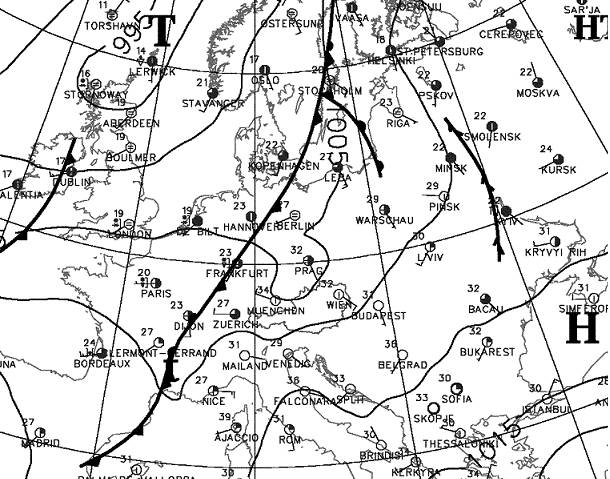
Figure 7: Surface chart/12 UTC
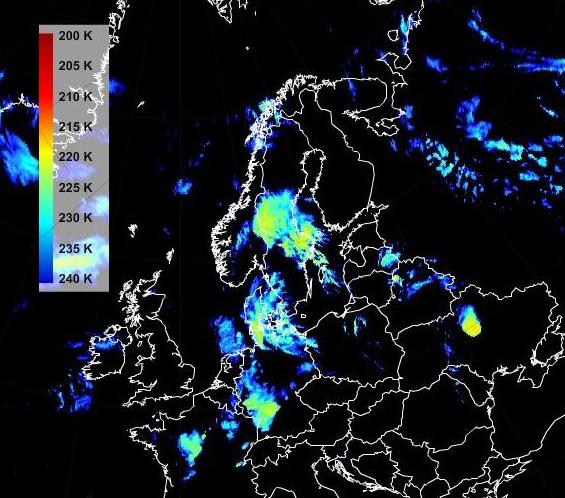
Figure 8: Enhanced IR10.8 (Meteosat9)/12 UTC
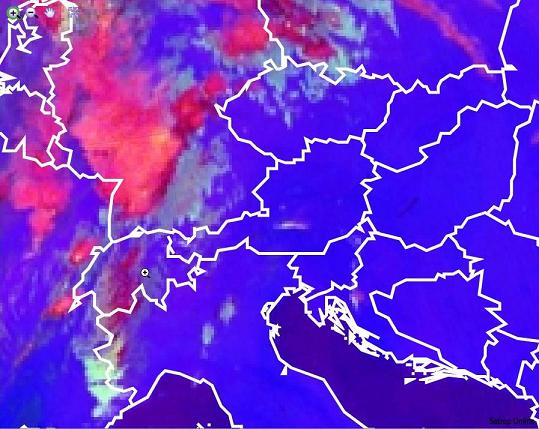
Figure 9: Severe Storm RGB/12 UTC
The further development shows that at 18 UTC the cold front has reached Switzerland. Next to that there is a convergence line in the east of Austria. Fascinatingly there are prefrontal cells that lead to fierce weather. Those cells are due to convergence at the leading edge of fronts (description in the following abstract). Looking at the Enhanced IR you can detect ring-shaped cloud tops. Inside those rings the temperature is higher. Taking a first guess people would probably say that the cloud top there must be lower. But it is not like that. In fact, in the stratosphere temperature is rising again and therefore those warm areas in the ring-shaped cloud tops indicate overshooting cloud tops. Additionally detecting such features you should note the possibility of hail. In the present picture there is the possibility (and as we will find out later- the creation) of hail development over Bavaria, Upper Austria and the Czech Republic. Deciding whether there is the possibility of hail development, it is recommended to take a look at several products: the Enhanced IR and in addition the radar blips.
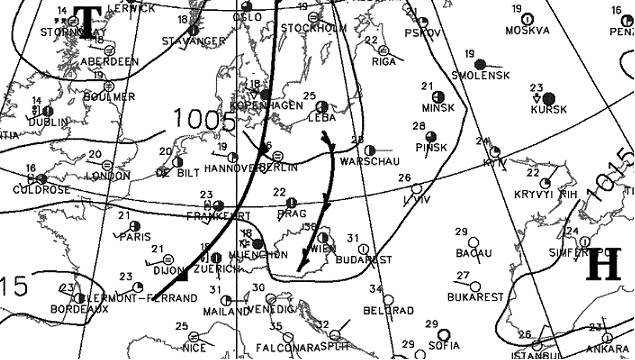
Figure 10: Surface chart/18 UTC
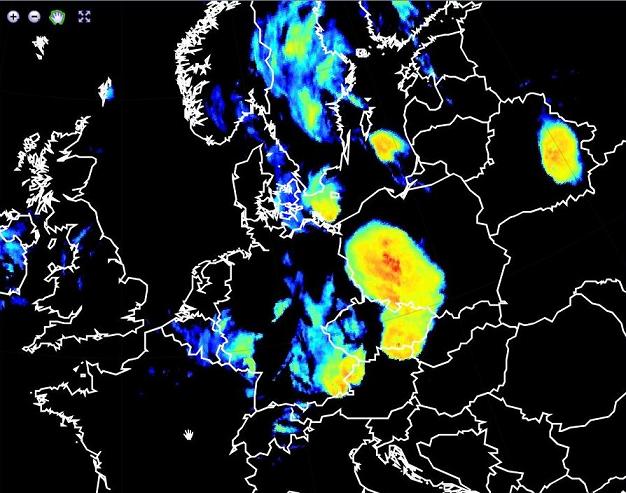
Figure 11: Enhanced IR10.8 (Meteosat 9)/18 UTC
To make a detailed analysis of the weather situation on 23rd of July, it is also important to mention that it was probably the hottest day of the year (no higher temperatures measured before). The days before that severe weather event were also marked by high temperatures due to the advection from subtropical air masses. Interestingly the Austrian farmer alliance reported that the areas, where the biggest hailstones were detected where those with the highest temperature. The size of hail is not directly linked to temperature, but to updrafts and "warm cloud depth". Nevertheless high temperatures indicate high energy values on the surface and probably influence the updrafts there. So finally the high temperatures have of course an impact on this fierce weather.
Survey on the stratification & stability parameters
There are numerous parameters to calculate the stability of the present air mass. To give a quick insight into the air mass stratification, I am going to use the most common ones: the Showalter-Index, the Lifted-Index and the CAPE-Index. They represent e.g. the potential for severe convection and should support the forecaster making his decisions.
- Showalter [°C] = T500-Tparcel1
- Lifted-Index [°C] =T500-Tparcel2
- CAPE
T500 = temperature (°C) at 500hPa;
Tparcel1 = Temperature (°C) at 500hPa of a parcel lifted from 850hPa;
Tparcel2 = Temperature (°C) at 500hPa of a parcel lifted with the average pressure;
Temperature and Dew Point of the layer 500m above the surface
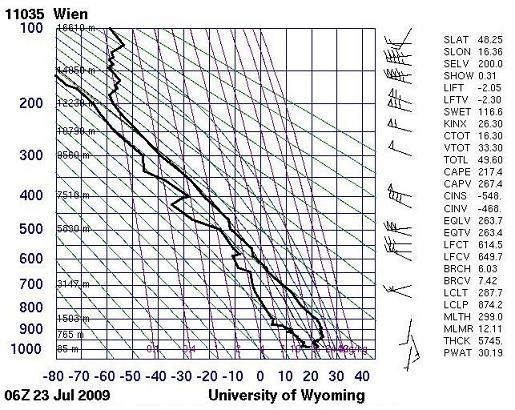
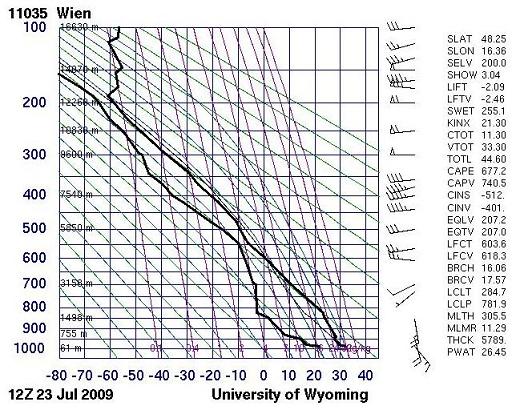
At 06 UTC and at 12 UTC the Showalter-Index indicates that thunderstorms are possible, though a trigger is needed. The Lifted-Index already shows also the possibility of thunderstorms. Within the next few hours the situation is getting tense. At 18 UTC the CAPE-Index shows values about 1650J/kg which indicates the possibility of heavy showers and hail. Above all an outstanding wind shear (deep layer shear: 0-6 km) can be detected which is one of the most important ingredients to severe thunderstorms.
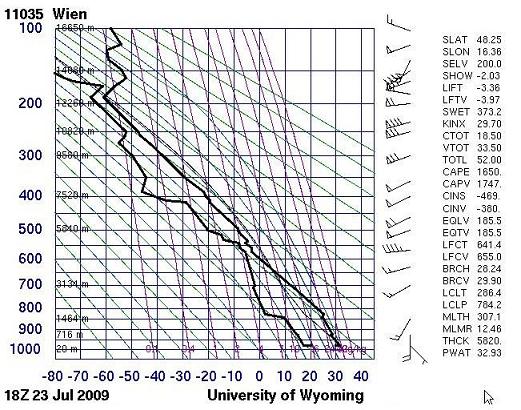
At 18 UTC the wind shear amplifies enormously and the next day (00 UTC) shortly after the transition of the cold front the surface wind shows the classic north-component. The big difficulty in forecasting this weather event was to predict exactly the time the wind direction would change. At 18 UTC Vienna was still dominated by a south-easterly flow as can be seen on the weather chart. Later on when the wind direction changed rather abruptly, the cells where integrated in the upper-level flow and rushed eastwards.
The transition of the cold front which went along with prefrontal thunderstorms caused remarkably storms. The gust front as well as the downburst caused lots of damage. In the present picture shown above the highest wind speeds are illustrated. Though there was a wind speed maximum measured in Langenlebarn (137km/h) the model shows clearly that the wind speed maximum was detected somewhere else. The INCA-analysis shows a maximum wind speed about 62m/s (223.2km/h).
Figure 12: Meteosat 9 - Enhanced IR10.8: time sequence
This first loop shows the convective development using the IR10.8 channel. The images are artificially enhanced to ensure a better discrimination of the several convective stages. The change from U-shaped storm into ringshaped storm can be well observed. Courtesy of Martin Setvak (CHMI)
Figure 13: Meteosat 9 - HRVIS RGB: time sequence
The second loop shows a combination of the HRVIS channel on red and blue with temperature information of IR10.8 on blue. Striking features are the overshooting tops. Courtesy of Martin Setvak (CHMI)