
grey
Sandy desert appears yellow in Cloud Phase RGB. Rocky desert appears yellow with brownish or reddish shades, or grey.
In the figures below, the Cloud Phase RGB is presented together with the Natural Colour RGB to help identifying the surface features.
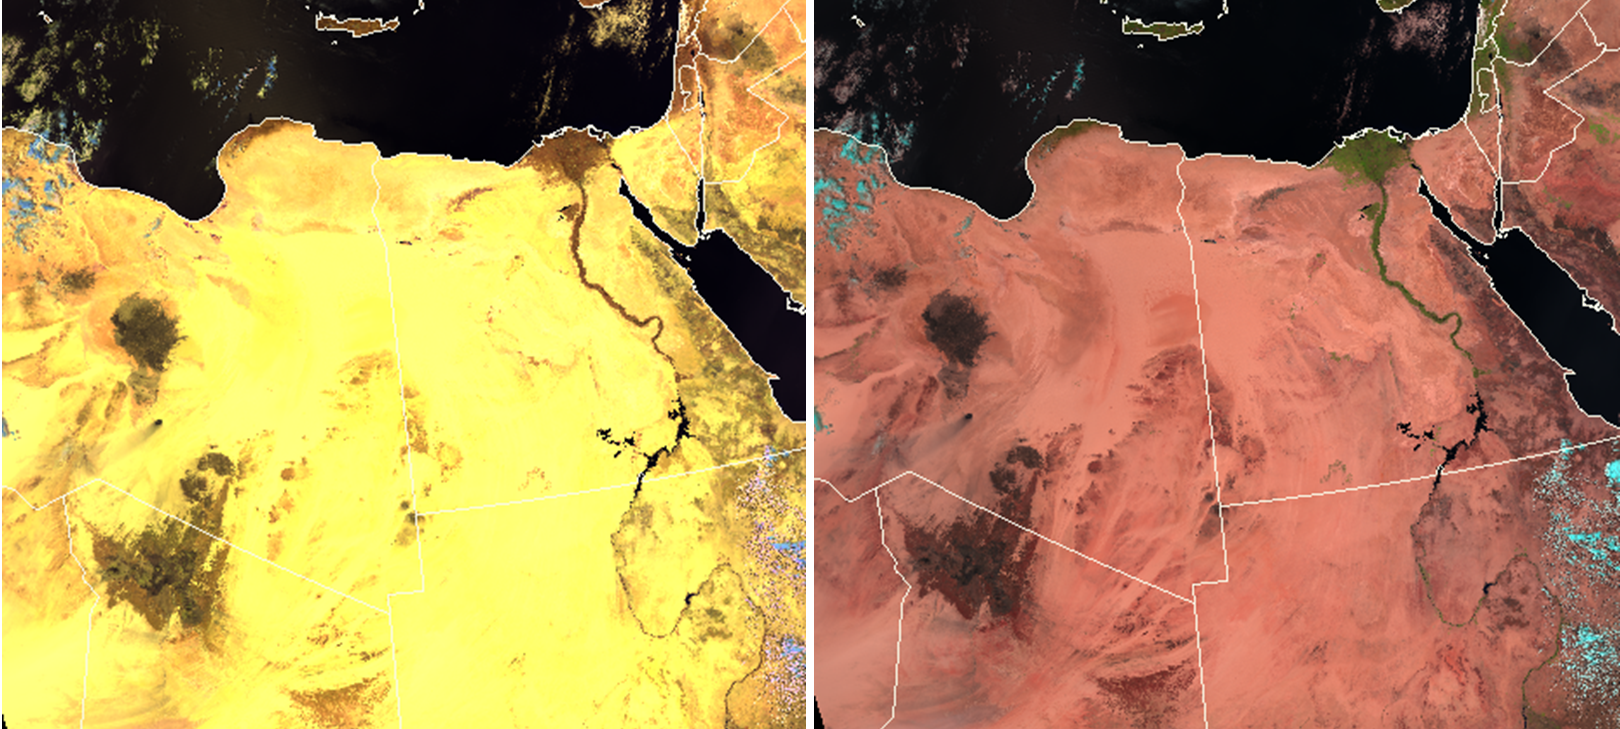
Fig. 1: VIIRS Cloud Phase and Natural Colour RGB images for 27 April 2021, 12:10 UTC
Figure 1 shows the part of the Sahara with the Sinai Peninsula. The Sahara Desert appears mostly yellow, while the vegetated area (e.g. along the Nile River and the delta of the Nile) appears dark/medium brown in the Cloud Phase RGB.
In the Natural Colour RGB (right image), the Sahara shows a special structure: sandy desert appears pinkish red, other areas (rocky or mixed desert) appear brownish or grey. On the Cloud Phase RGB one can see almost the same structure. Sandy desert appears yellow, while rocky or sand mixed with stones appear darker with some brownish or reddish shades. However, the Cloud Phase RGB shows less details than the Natural Colour RGB. The reason for this is that the Cloud Phase RGB is tuned for highlighting cloud top microphysical features and not for surface features. The red and the green beam of the Cloud Phase RGB are cut at 50% reflectivity values, (see the recipe on the left) resulting colour saturation for some areas of the desert and hence omitting surface details.
Figure 2 below shows the north-western coast of the Black Sea in June and August. The ‘Oleshky Sands’ national park is located close to the River Dnieper (indicated by a white arrow). It consists of sand dunes with sparse vegetation across the sands. In the Cloud Phase RGB, the desert appears yellow with some brownish shades in June and August (slightly more brownish shades in June than in August). Note that a salt lake is also seen (indicated by a blue arrow).
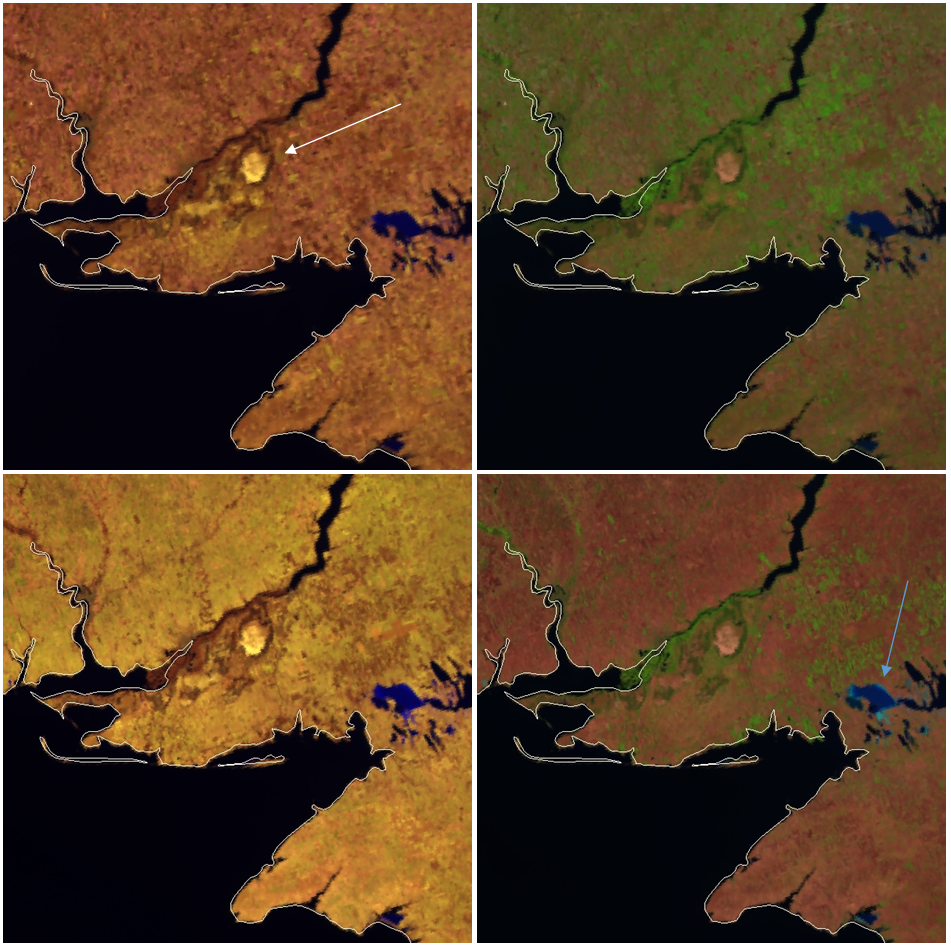
Fig 2: VIIRS Cloud Phase and Natural Colour RGB images for 27 June 2019, 11:40 UTC (upper left and right) and for 30 August 2020, 11:27 UTC (bottom left and right). The white arrow indicates the location of the national park, while the blue arrow indicate a salt lake.
The figure below shows Anatolia. The Anatolian highland is a large semi-dry area. It is covered mainly by steppe. Some parts are semi-desert. Dry grasslands cover the drier valleys and surround the saline lakes. In the Cloud Phase RGB the inner part of Anatolia appears mainly light brownish, close to yellow. The coast of the biggest saline lake (Lake Tuz) appears yellow. The saline lake appears dark blue/magenta in the Cloud Phase RGB, while cyan in the Natural Colour RGB.
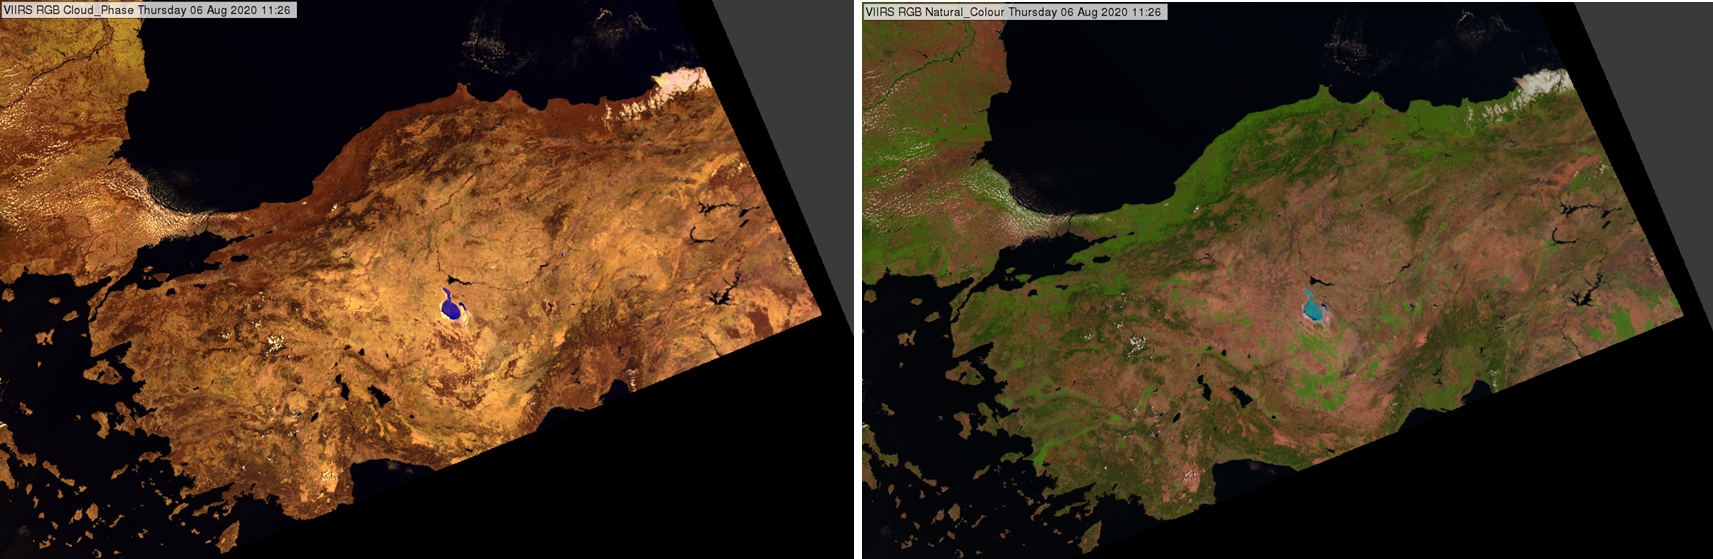
Fig 3: VIIRS Cloud Phase and Natural Colour RGB images for 6 August 2020, 11:26 UTC
Note:
• Land is seen only in cloud-free areas.
• The colour shades depend on the solar and satellite viewing angles as well.
• The colour shades of deserts or semi-deserts depend on their typical soil type (sand or rock, depending also on the material of the rock) and the type, fraction and greenness of the possible sparse vegetation.
• The Cloud Phase RGB is tuned for cloud top microphysical analyses. Land is just the background in these images. In case of land analyses other RGB types are recommended to use, e.g. Natural Colour or True Colour RGB.
o Different desert surface types might look similar in these images due to colour saturation, appearing homogeneously yellow.
o From the Cloud Phase RGB colour one cannot say unambiguously whether an area contains some green vegetation or just bare soil, rocks. They all may appear in lighter shades of brown.
Explanation of the colour of deserts and semi-deserts (see the recipe):
• The reflectivity values of sand is close to 50% both in NIR1.6 and NIR2.25 channels. So, in case of sandy deserts, the red and green signals are close to maximum. The blue signal is lower. As a consequence, the sandy desert appears yellow in the Cloud Phase RGB.
• The reflectivity values of rocks are usually lower than for sand. The actual reflectivity values, and the colours in the Cloud Phase RGB depend on the surface type.
• Sparse vegetation is depicted in brownish shades in the Cloud Phase RGB. The presence of green vegetation lowers the signals in all three colour beams and the red signal usually becomes strongest.
Smoke plumes from burning biomass usually appear bluish grey or grey in the VIIRS True Colour RGB images. The smoke of an oil fire is black.
True Colour RGB images are ‘Rayleigh corrected’. This means that the impact of Rayleigh scattering by atmospheric molecules has been removed to make the images clearer. However, the impact of the aerosols’ scattering is not removed completely. This is one of the strengths of the True Colour RGB: it is quite sensitive to particulate matter in the atmosphere like smoke, smog, haze and dust.
A thick smoke plume close to the source has a different shape, structure and colour shade than ice and water clouds. A very thin smoke plume, further from its source area, or a residual thin smoke plume of a former fire often resembles a blurred (bluish) greyish veil. Its detection is easier against a dark background like the sea.
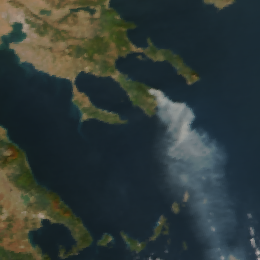
The image below shows a smoke plume over the Aegean Sea.
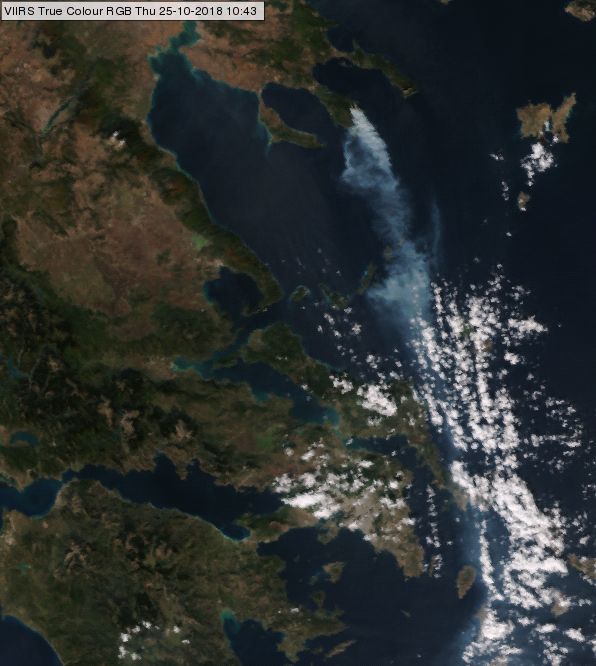
NPP, VIIRS True Colour RGB for 25 October 2018, 10:43 UTC
The image below shows the smoke of the same fire one and half hour later. Both, the True Colour and the Natural Colour RGB images are shown to demonstrate how much more sensitive the True Colour RGB is in respect to the smoke.
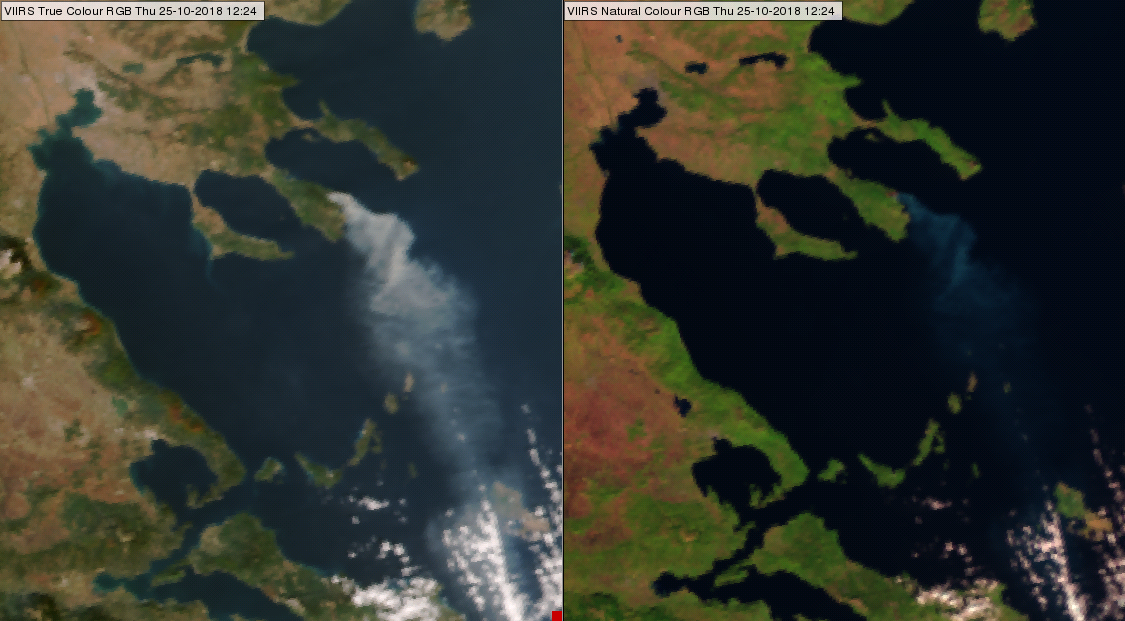
NPP, VIIRS True Colour RGB (left) and Natural Colour RGB (right) for 25 October 2018, 12:24 UTC
The following two images show the smoke of the wildfire which devastated in Northern California in November 2018 during several days. True Colour RGB imagery from VIIRS provides good view of the smoke. The image of 8 November shows (mainly) thick smoke. Here thick smoke appears grey with weak brownish shades, thin smoke appears bluish grey.
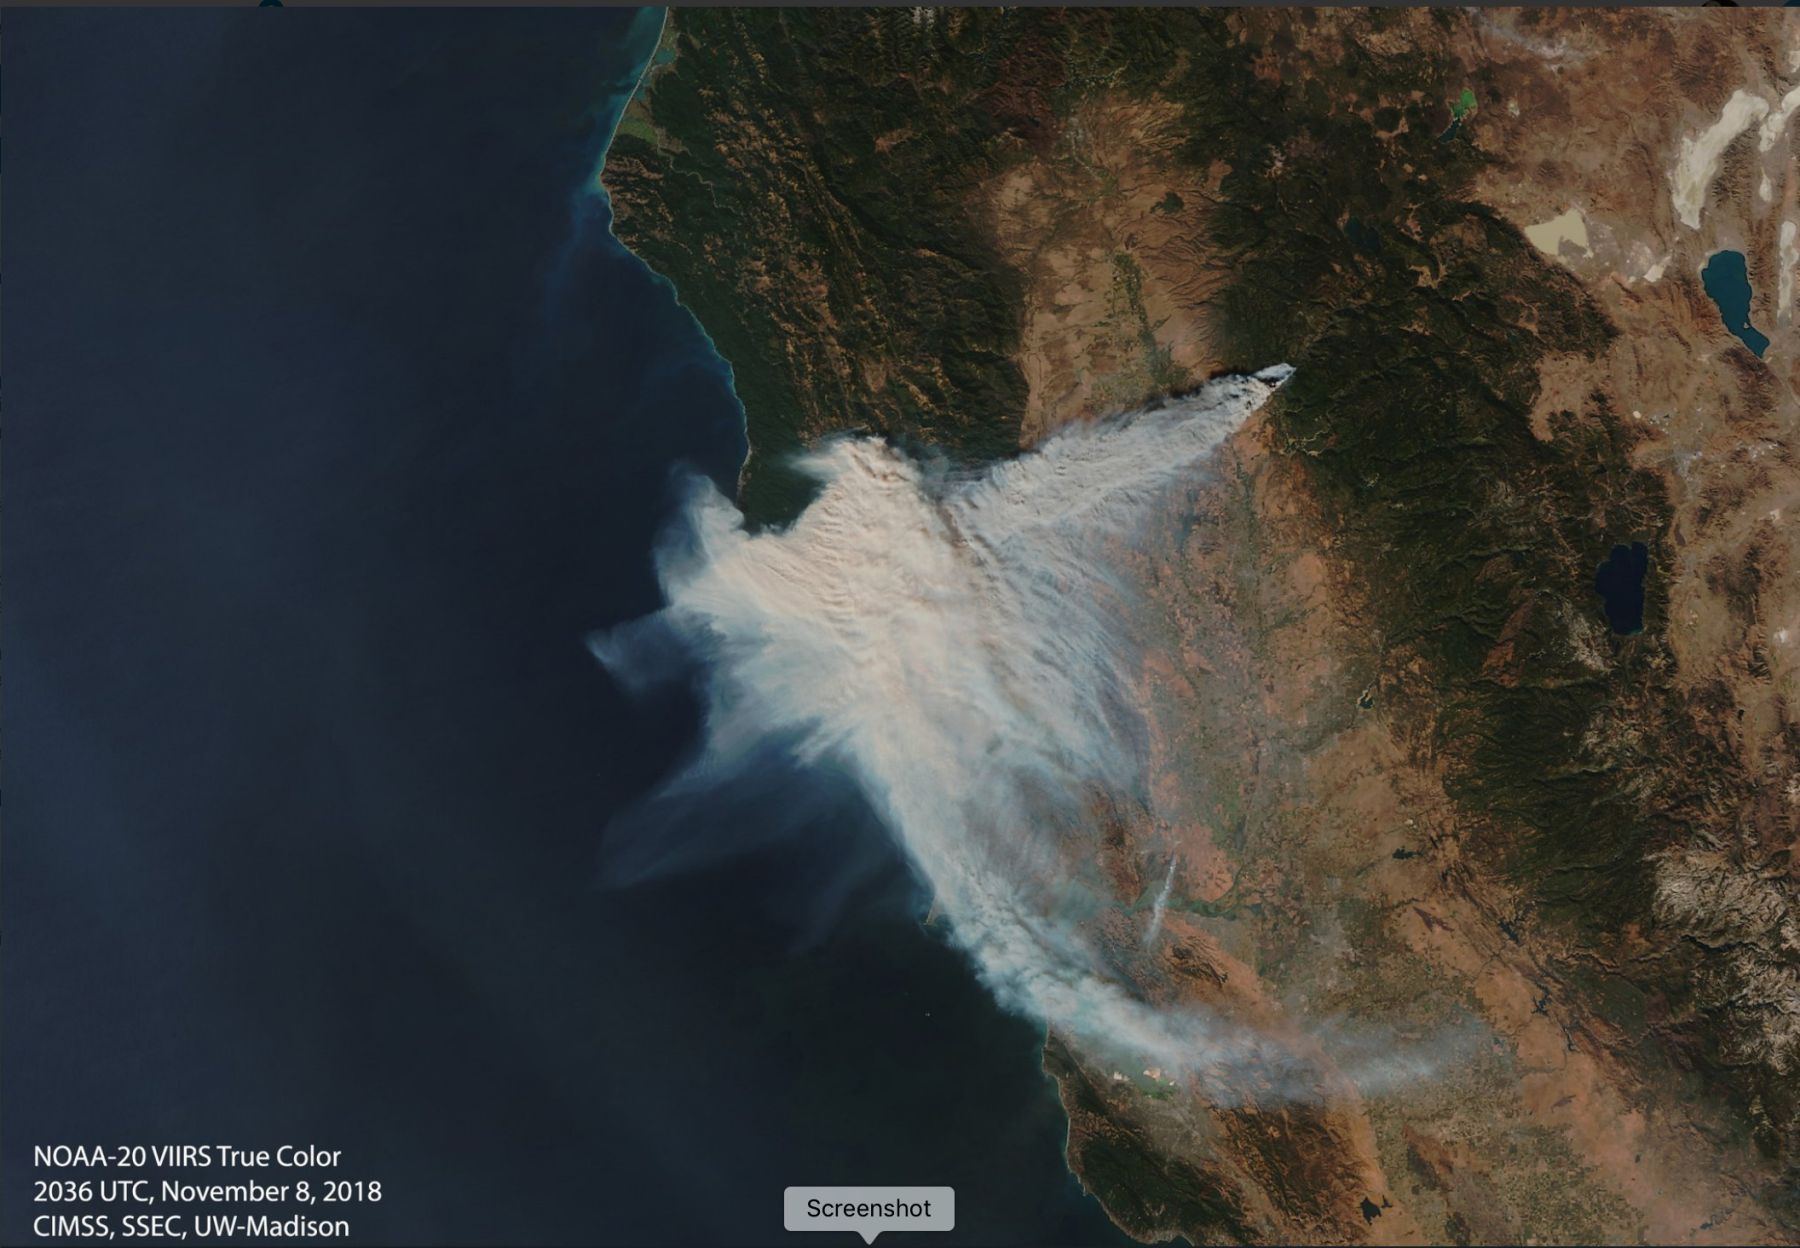
NOAA-20, VIIRS True Colour RGB for 8 November 2018, 20:36 UTC
(Source: https://cimss.ssec.wisc.edu/goes/blog/archives/category/air-quality)
The image below shows the smoke 3 days later. Here we can see mostly thin smoke in bluish grey shades.
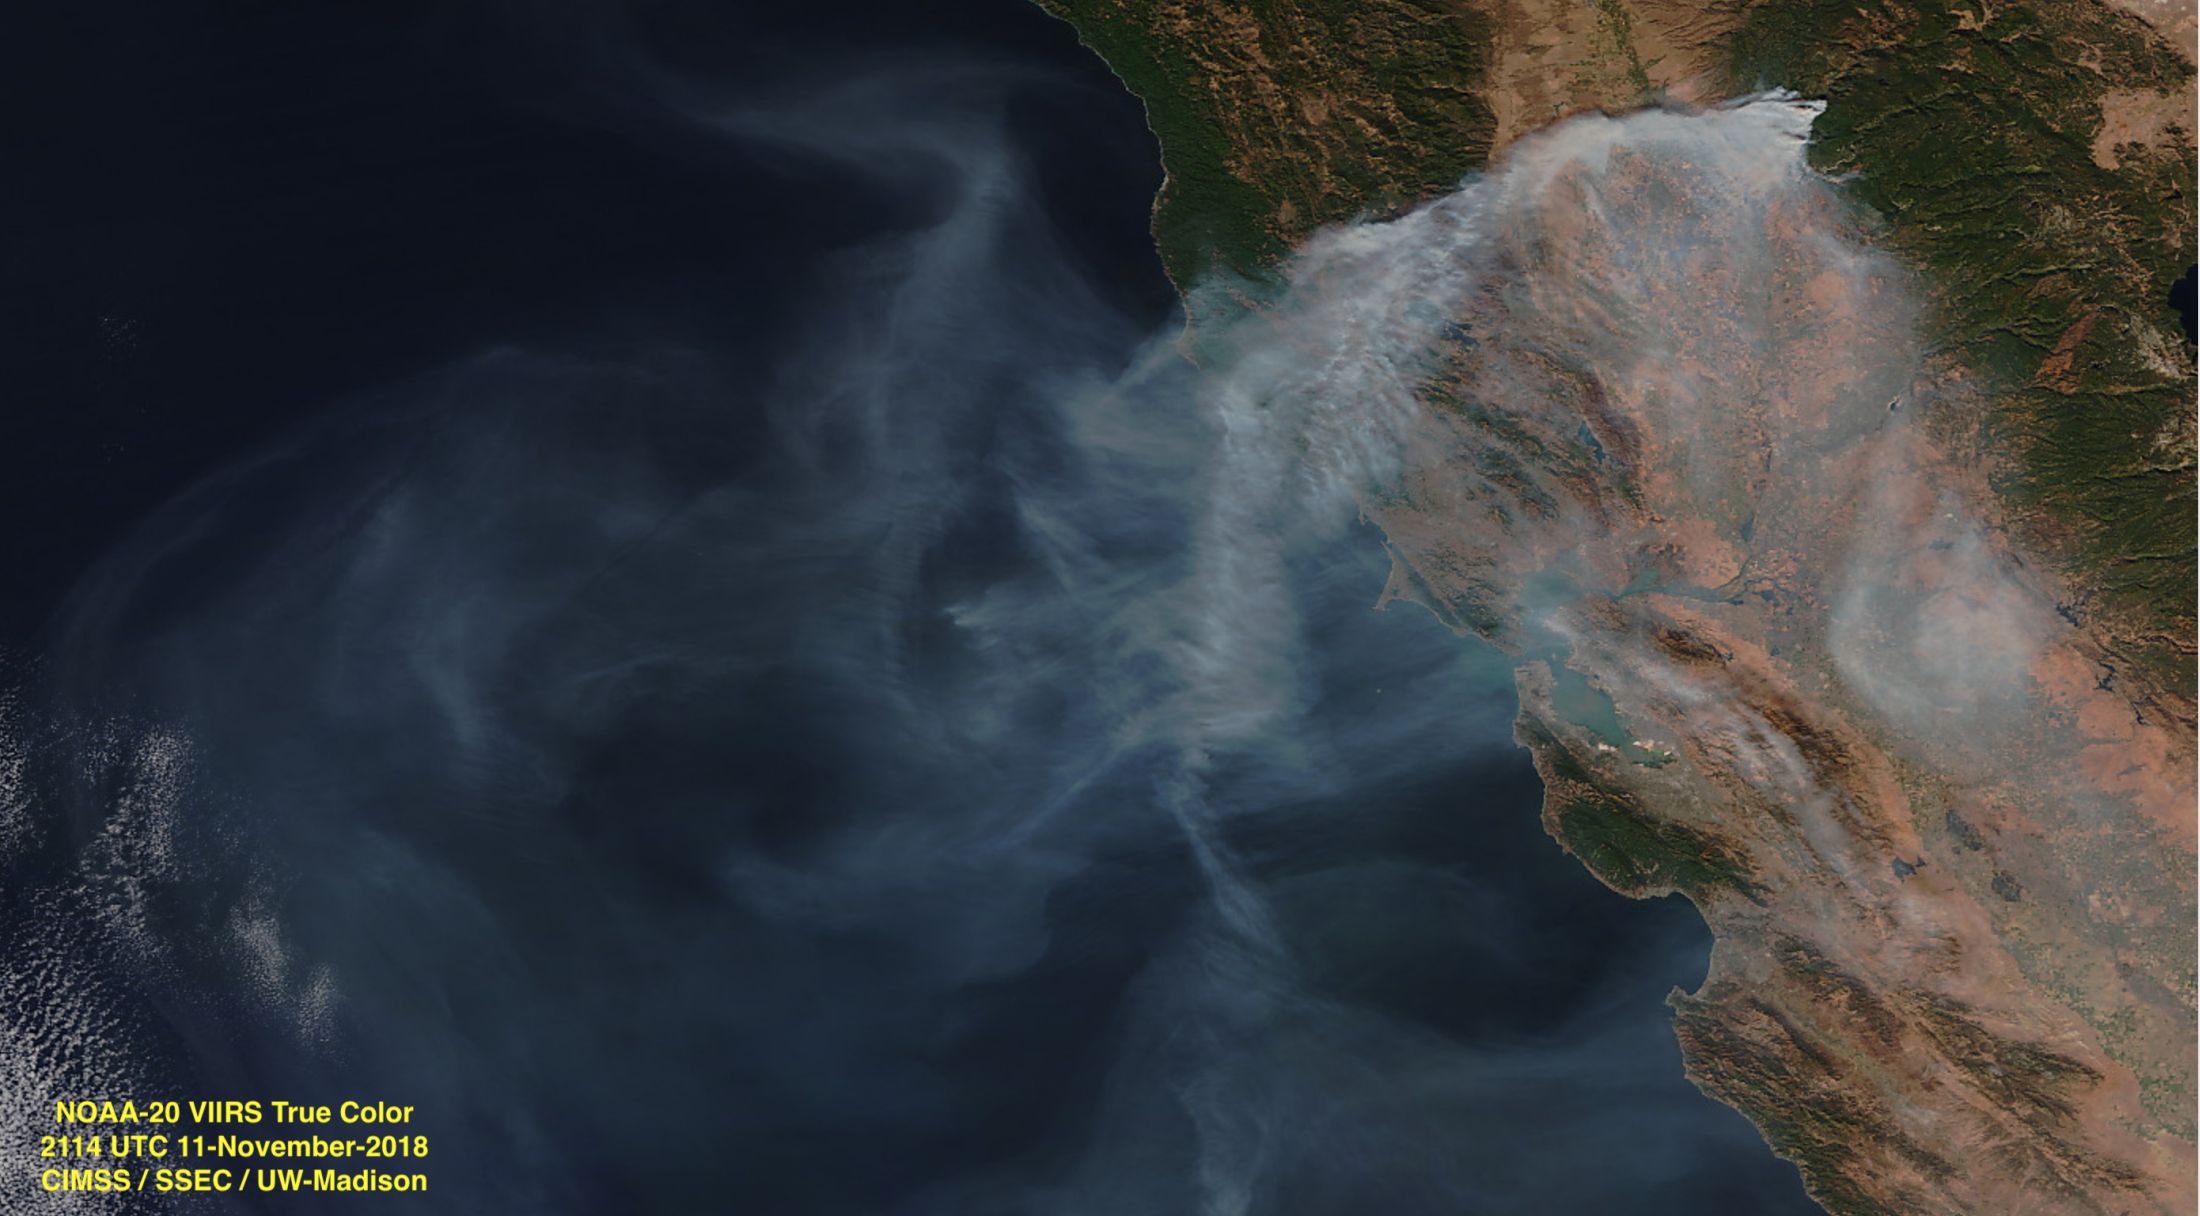
NOAA-20, VIIRS True Colour RGB for 11 November 2018, 21:14 UTC
(Source: https://cimss.ssec.wisc.edu/goes/blog/archives/category/air-quality)
Note that:
• The aerosol plumes usually appear grey in the True Colour RGB images. The grey shade may indicate the type of the aerosols. Biomass smoke is often bluish grey, the smoke of oil fire is black, dust cloud is often brownish grey, while haze appear grey.
• Towards the edge of the swath a thin smoke plume appears thicker, while along the sub-satellite track it looks thinner.
• Thin clouds also appear greyish.
Explanation of the colour of smoke in the True Colour RGB imgages (see the recipe):
The aerosol particles scatter the visible radiation. The reflectivity of a thick aerosol plume depends on its concentration, the type of aerosol (its composition), the average particle size, the solar and the satellite viewing angles and on the wavelength.
The colour of the smoke depends strongly on the burning material. The smoke of an oil fire is black because of the large concentration of highly absorbing soot particles. The smoke of a pure biomass fire is grey or bluish grey as the particles are not too large and the absorption of the smoke particles is much lower.
In case of a thin smoke plume the measured radiance depends on the characteristics/reflectivity of the underlying surface as well. The satellite observes a combined signal from:
• Radiation scattered by the smoke particles into the direction of the satellite sensor and
• Radiation transmitted through the thin smoke plume in the direction of the satellite sensor.
The weighting factor of the combination depends on the smoke plume transmissivity.
Dust clouds appear brownish grey or grey in the VIIRS True Colour RGB images.
True Colour RGB images are ‘Rayleigh corrected’. This means the impact of Rayleigh scattering by the atmospheric molecules has been removed. This makes the images clearer. However, the impact of the aerosols’ scattering is not removed. In case of high aerosol concentration (e.g. dust plumes), the image become blurred. In fact, this is one of the strengths of the True Colour RGB: it is quite sensitive to particulate matter in the atmosphere like smoke, smog, haze and dust.
The structure of an aerosol plume in satellite imagery is usually much more homogeneous than that of a water or ice cloud. A thin dust plume, further away from its source area, mostly resembles a blurred (brownish) greyish veil. Its detection is easier against a dark background, but if the aerosol concentration is high enough the dust cloud is recognisable over land as well.
In the next images, a dust plume coming from the Sahara is seen in brownish, greyish colour over the Atlantic Ocean. The coast of western Africa is on the right side of the image. The image was taken one day after the dust really started to be pushed off the African coast over the Atlantic.
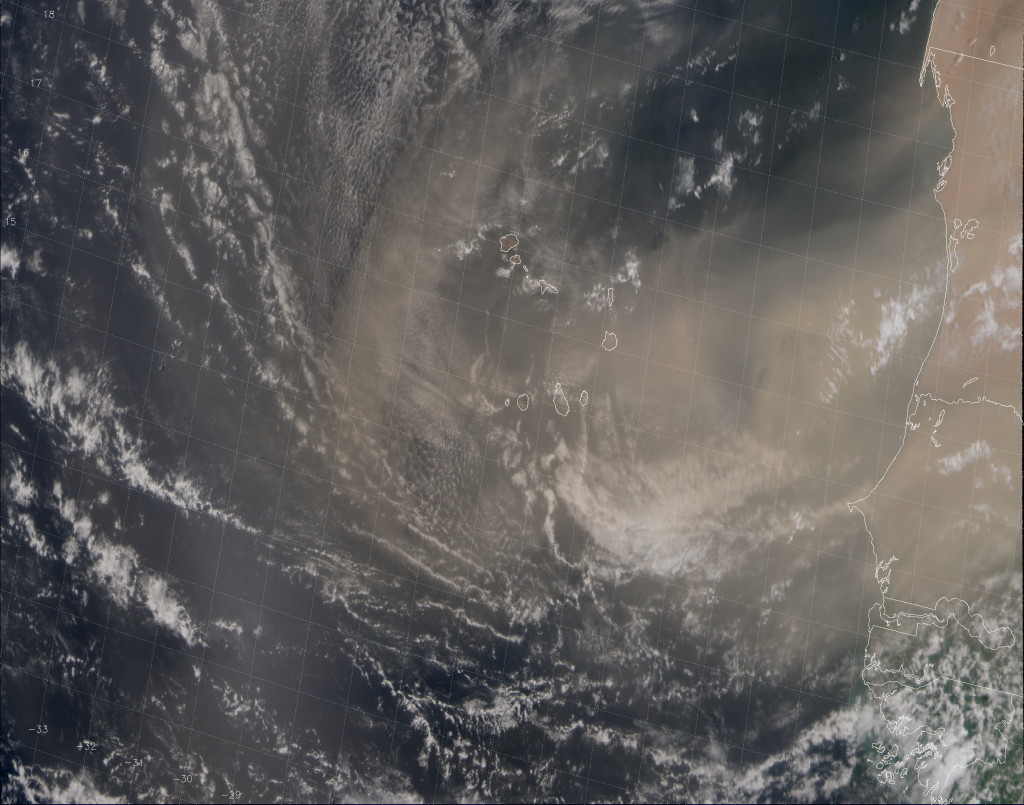
NPP, VIIRS True Colour RGB for 30 July 2013, 15:07 UTC
(Source: http://rammb.cira.colostate.edu/projects/npp/blog/index.php/uncategorized/abafado-bruma-seca/ )
Over the following days the dust plume was pushed across the Atlantic Ocean. In the image below, the dust plume extends from one side of the swath to the other – over 3000 km.
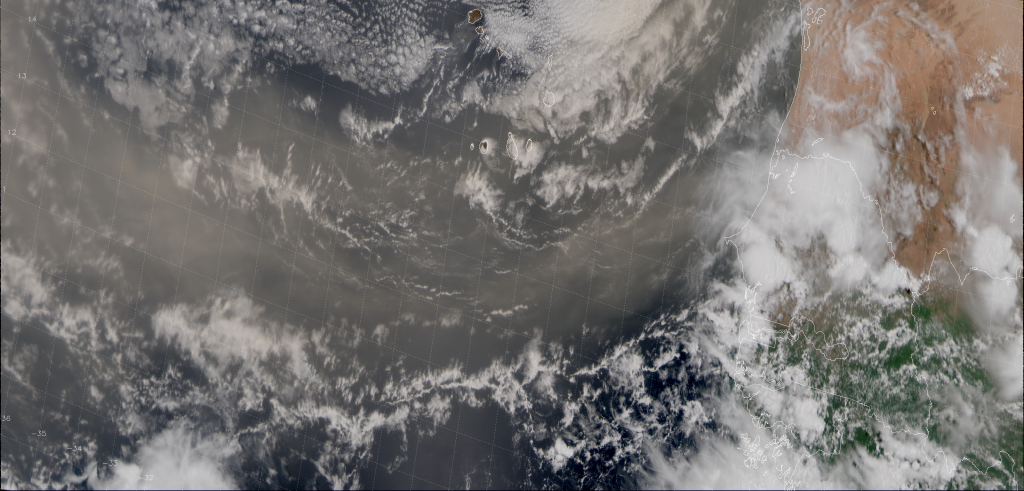
NPP, VIIRS True Colour RGB for 31 July 2013, 14:48 UTC
(Source: http://rammb.cira.colostate.edu/projects/npp/blog/index.php/uncategorized/abafado-bruma-seca/ )
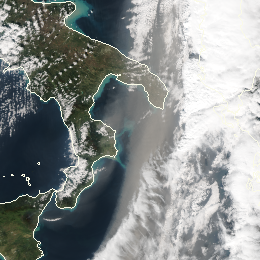
The image below shows a dust cloud over the Mediterranean Sea and Italy. On the VIIRS Dust RGB (right panel) the pink colour indicates the dust cloud. This help to delineate the dust plume on the True Colour RGB (left panel).
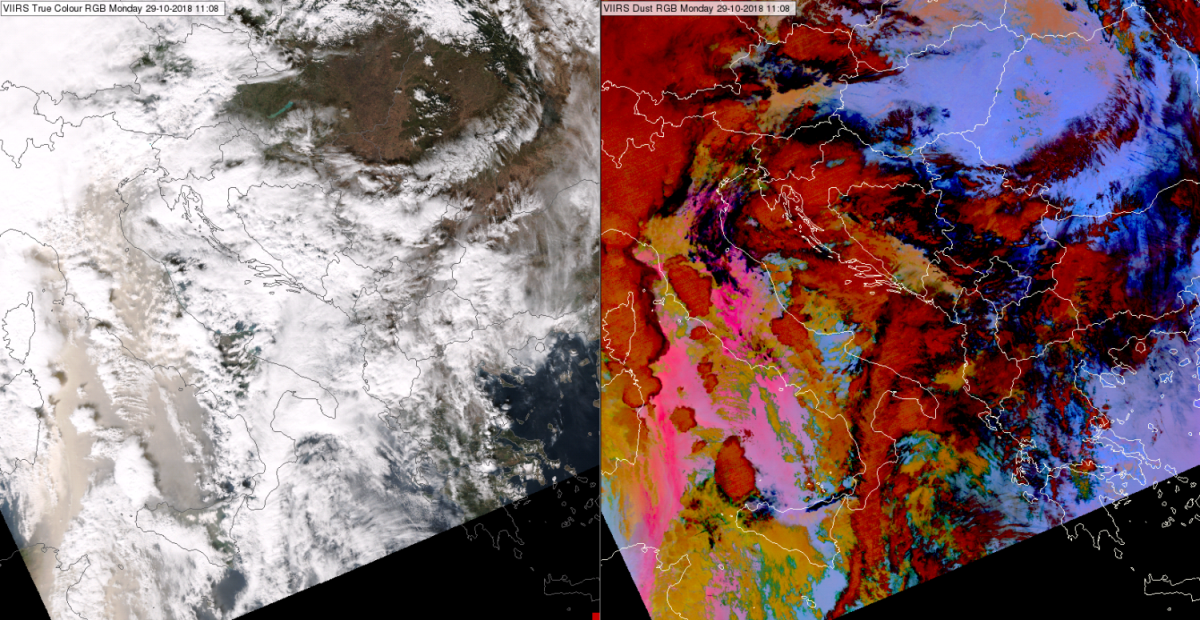
NPP, VIIRS True Colour RGB (left) and Dust RGB (right) for 29 October 2018, 11:08 UTC
The next image shows dust clouds over the Black Sea region. Here, the dust plume appears grey, not brownish grey, maybe because of the lower concentration. The dust plume is better seen over the sea, but its presence can be suspected over the land as well: south of the Black Sea and also in the cloud-free area indicated by the arrows. Here the colour shade is different from usual.
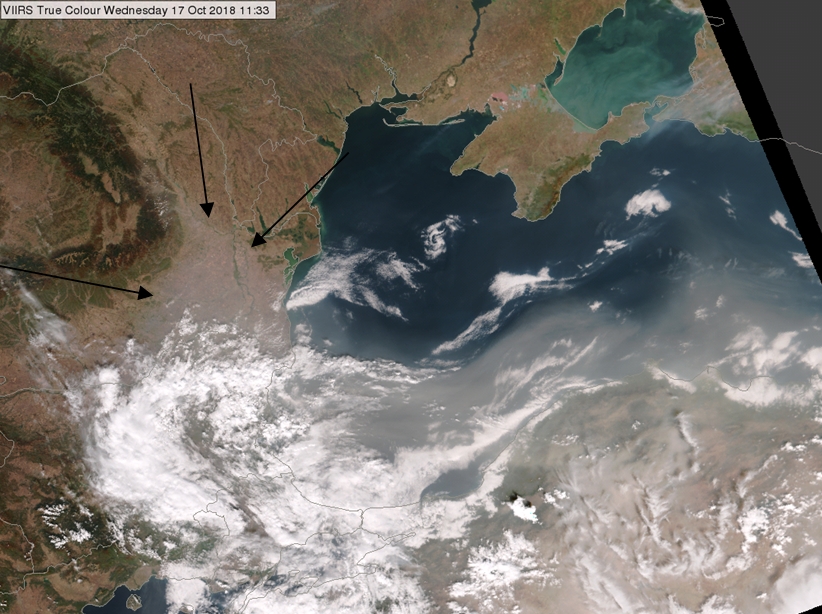
NPP, VIIRS True Colour RGB for 17 October 2018, 11:33 UTC
For comparison, the SEVIRI 24-hour Microphysics RGB is shown below to confirm that this aerosol plume does consists of dust particles. Dust clouds appear pink in the 24-hour Microphysics RGB.
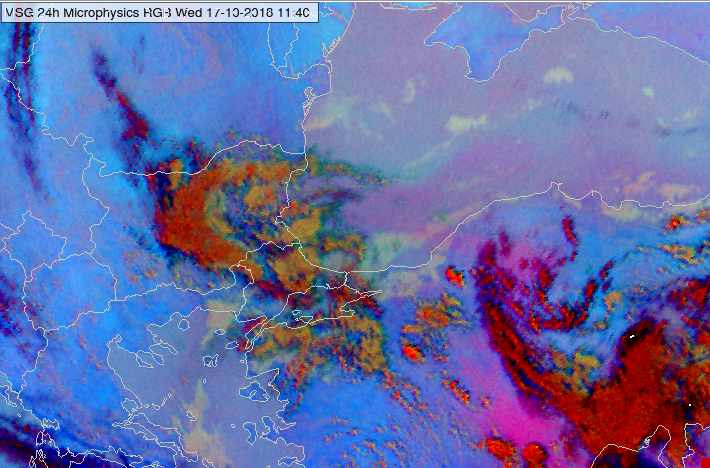
Meteosat, SEVIRI 24-hour Microphysics RGB for 17 October 2018, 11:40 UTC
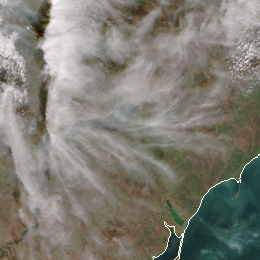
The last example shows another dust cloud over the Mediterranean Sea some days later. The grey blurred area indicated by yellow arrows delimits the dust plume.
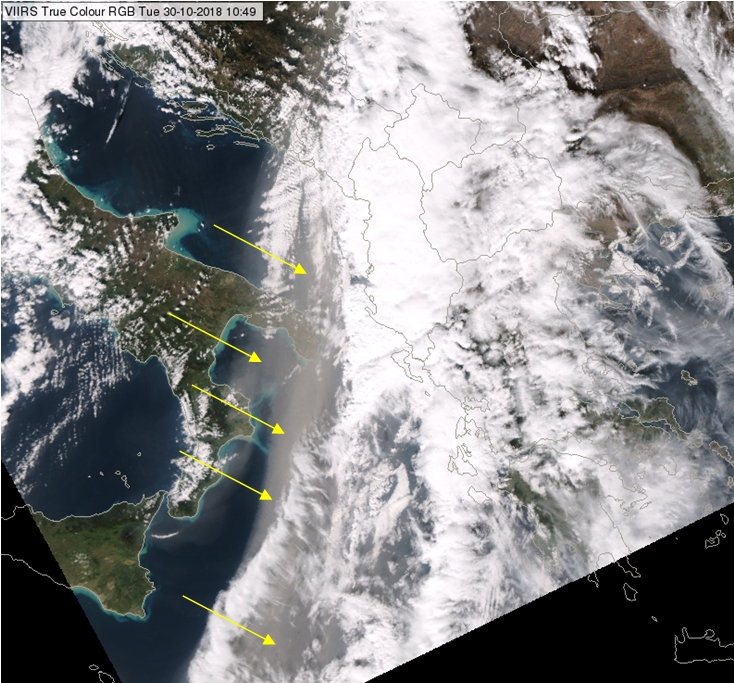
NPP, VIIRS True Colour RGB image for 30 October 2018, 10:49 UTC
Note that:
• The aerosol plumes usually appear grey in the True Colour RGB images. The grey shade may indicate the type of the aerosol. Dust clouds tend to be brownish grey, biomass smoke tends to be bluish grey, while haze appear grey.
• Towards the edge of the swath a dust plume looks thicker, while along the sub-satellite track it looks thinner.
• Thin ice or water clouds similarly appear greyish in the True Colour RGB. However, thin ice clouds have usually a different texture.
Explanation of the colour of dust clouds in the True Colour RGB (see the recipe):
The aerosol particles scatter the radiation in the visible wave length. The reflectivity of a thick aerosol plume depends on its concentration, the aerosol type (composition), the average particle size, solar angle and satellite viewing angles and on the wavelength.
A thick dust cloud appears brownish grey in the True Colour RGB. The measured reflectivity is slightly stronger at longer wavelength.
In case of a thin dust cloud, the measured radiance depends on the characteristics/reflectivity of the underlying surface as well. The satellite observes a combined signal from the ground and the cloud:
• Radiation scattered by the dust particles into the direction of the satellite sensor and
• Radiation transmitted through the thin dust plume in the direction of the satellite sensor
The weighting factor of the combination depends on the dust cloud transmissivity.
So, although a thick dust cloud appears brownish grey in the True Colour RGB, a thin dust plume may ‘loose’ its brownish shade and becomes grey.
Thin clouds usually appear grey in the VIIRS True Colour RGB images. Very thin ice clouds are not seen.
The image below shows thin low-level water cloud along the Italian coast of the Adriatic Sea and thin cirrus clouds across the Adriatic Sea. Both clouds appear bluish grey over the dark blue sea background. Thin cirrus over the land appears greenish/brownish grey.
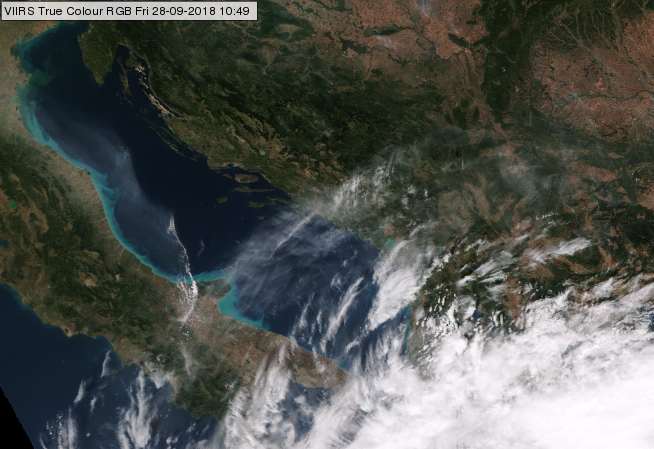
NPP, VIIRS True Colour RGB image for 28 September 2018, 10:49 UTC
The next image shows the Alps region by True Colour RGB (left) and Cloud Type RGB (right). High level lee cloudiness is seen south-east of the Alps. The Cloud Type RGB is very sensitive to the thin cirrus clouds over cloud-free areas appearing red in this RGB type. Comparing the two panels one can see that thin ice clouds appear either grey in True Colour RGB or are not seen at all.
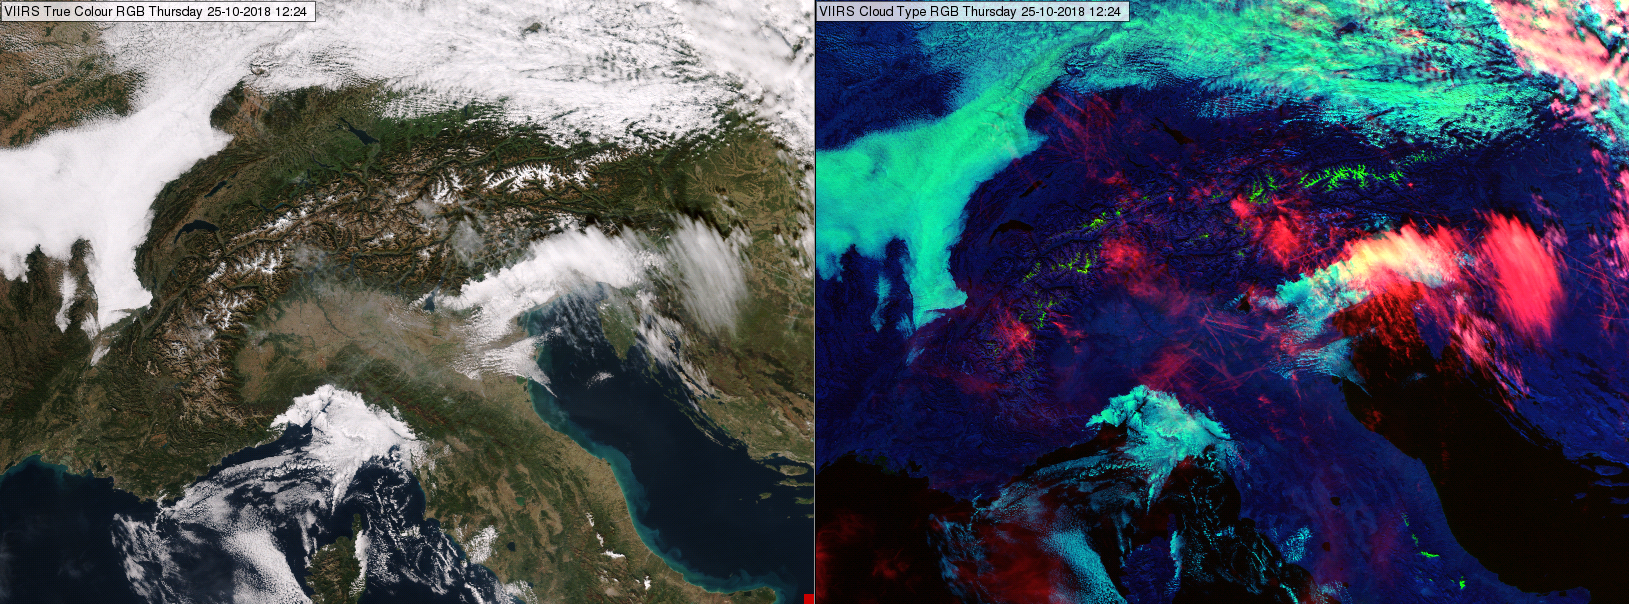
NPP, VIIRS True Colour RGB image for 25 October 2018, 12:24 UTC
Note that:
• The cloud colour depends on the solar and satellite viewing directions as well. Towards the edge of the swath the greyish colour may be brighter, while along the sub-satellite track it might be paler. A thin cloud is usually better seen on the edge of the swath.
• The True Colour RGB is sensitive to thin low-level clouds, while other RGB types (like Dust and Night Microphysics RGBs) which are famous for being sensitive to thin clouds are sensitive mainly to the thin mid- and high-level clouds.
• High concentration aerosol plums also appear greyish.
• Thick cloud and snow appear white.
Explanation of the colour of thin clouds in the True Colour RGB (see the recipe):
Thin clouds are semi-transparent. Radiance coming from below can go through the cloud. The satellite observes a combined signal from the thin cloud itself and from the ground:
• Radiation scattered by the cloud elements into the direction of the satellite sensor and
• Radiation transmitted through the thin cloud in the direction of the satellite sensor.
The weighting factor of the combination depends on the cloud transmissivity. This is true for all three channels the RGB is combined from.
As a consequence, the colour of the thin clouds depends partly on the cloud characteristics (such as transmissivity, reflectivity) and partly on the characteristics/colour of the underlying surface: which can be land, sea or lower level cloud. A thin cloud over dark background such as sea or vegetated land appears greyish. A thin cloud over lower level clouds is not really seen by its colour shade, it might be seen because of the shadow it casts.
A very thin ice cloud is not seen in visible spectral range.
Semitransparent ice clouds appear greyish in the HRV Fog RGB images. Thicker cirrus clouds are grey with cyan tones. Thinner cirrus clouds appear as thin greyish veils (potentially with some week cyan tones).
The image below shows stratiform thin cirrus clouds over sea and land.
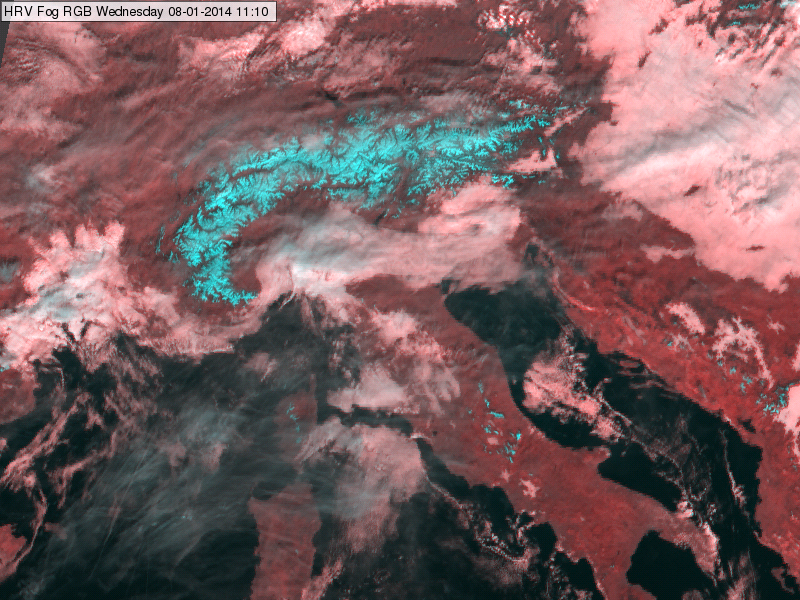
Meteosat, SEVIRI HRV Fog RGB image for 8 January 2014, 11:10 UTC
The image below shows thicker cumuliform cirrus clouds over sea and land.
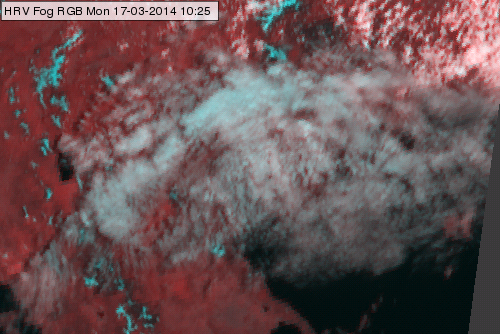
Meteosat, SEVIRI HRV Fog RGB image for 17 March 2014, 10:25 UTC
The next image show the transition from thick ice clouds to thinner and thinner ice clouds.
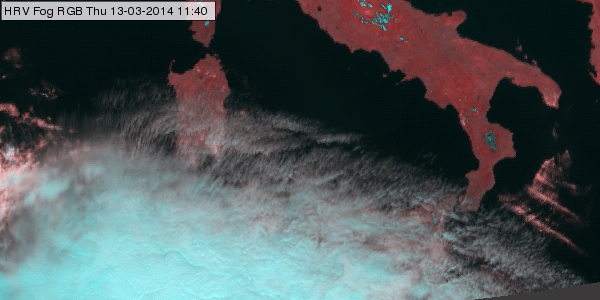
Meteosat, SEVIRI HRV Fog RGB image for 13 March 2014, 11:40 UTC
Explanation of the colours of the semitransparent clouds (see the recipe):
In case of semitransparent clouds the satellite measures mixed radiation consisting of the radiation emitted or reflected by the semitransparent cloud itself and the radiation originated from below and transmitted through it. That is why the colour of a semitransparent cloud depends not only on the characteristics of the cloud itself, but also on the transparency and the colour of the underlying surface.
• The colour of the almost thick semitransparent cloud approximates the colour of the thick ice clouds (cyan with some grey tones).
• The colour of the very thin cirrus clouds approximates the colour of the underlying clouds or surface.
• The colour of the thin cirrus is between the colour of the thick ice cloud and that of the underlying cloud or surface. – It appears as a thin greyish veil (potentially with some week cyan tones).
Mid-level water clouds are depicted in greyish colours in the Severe Storms RGB images.
An example is shown below. The grey cloud in the Severe Storms RGB image (left) is seen in the (WV6.2-WV7.3) difference image (right) as well, indicating that it is a mid- or high-level cloud. The brownish colour of this cloud in the 24 hour Microphysics RGB image (right) indicates that it is a mid-level water cloud.
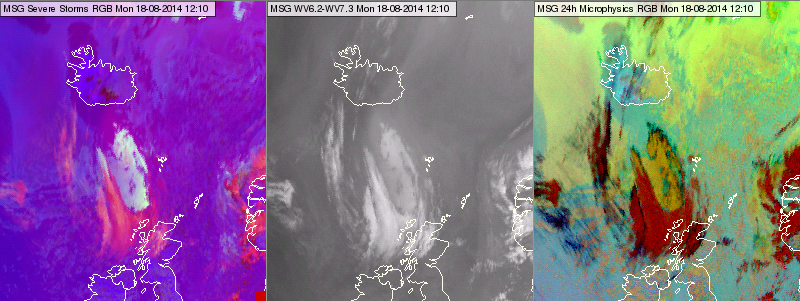
Meteosat, SEVIRI Severe Storms RGB image (left), (WV6.3-WV7.2) difference image (centre) and 24 hours Microphysics RGB image (right) for 18 August 2014 12:10 UTC
Note that the low-level water clouds seen in the 24 hour Microphysics RGB images (around Island) are hardly seen in the Severe Storms RGB images.
Explanation of the colours of the mid-level water clouds (see the recipe):
The mid-level water clouds are
• seen in the (WV6.2-WV7.3) difference image resulting medium to strong signal in the red colour beam.
• well seen in the (IR3.9-IR10.8) difference image too, resulting medium to strong signal in the green colour beam.
• Although they are not well detectable in the (NIR1.6 – VIS0.6) difference image, as the difference is close to zero both for water clouds and land/water surfaces, nevertheless the caused signal is medium to strong.
As all three colour components are medium to strong the resulting colour will be (close to) greyish.