
light blue
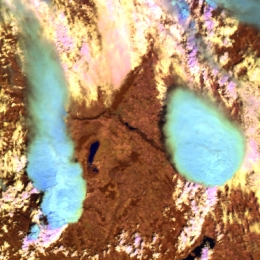
Deep convective clouds with strong updraft – severe convective clouds – often appear light blue in Cloud Phase RGB. The reason is that they typically have small ice crystals on their top, and thick ice clouds covered by small ice crystals appear light blue in Cloud Phase RGB.
In most of the cases thick ice clouds are covered by large ice crystals (appearing medium blue in the Cloud Phase RGB). However, there are some exceptions when the cloud top ice crystals are small. One of them is severe convection with strong updraft. The reason is the following. Strong updrafts often bring small ice particles up to the cloud top. Due to the strong updraft the small droplets formed at the cloud base do not have much time to become larger by coagulation before freezing.
The left panels of figures 1, 2 and 3 show Cloud Phase RGB. Several clouds appear blue with different shades.
Fig. 1 shows a part of Central Europe. The middle and right panels show Day Microphysics RGB (created with NIR1.6) and Cloud Effective Radius product. This triple visualisation helps to confirm whether the light blue clouds in Cloud Phase RGB are really covered by small ice crystals.
• Day Microphysics RGB is also sensitive to cloud top microphysics (phase and mean particle size of the cloud top elements). Thick ice clouds covered by large ice crystals appear red, thick ice clouds covered by small ice crystals appear orange in the Day Microphysics RGB.
• The Cloud Effective Radius product is retrieved from SEVIRI data by NWCSAF. To make easier the comparison only the effective radii of mainly thick ice clouds are visualised by masking water and thin ice clouds.
The Day Microphysics RGB and the Cloud Effective Radius product confirm that the light blue clouds in the Cloud Phase RGB are really covered by much smaller ice crystals than the medium blue clouds. The reports in the European Severe Weather Database confirm that the convective cloud systems indicated by arrows caused severe weather during their lifetime (tornado, hail, severe wind).
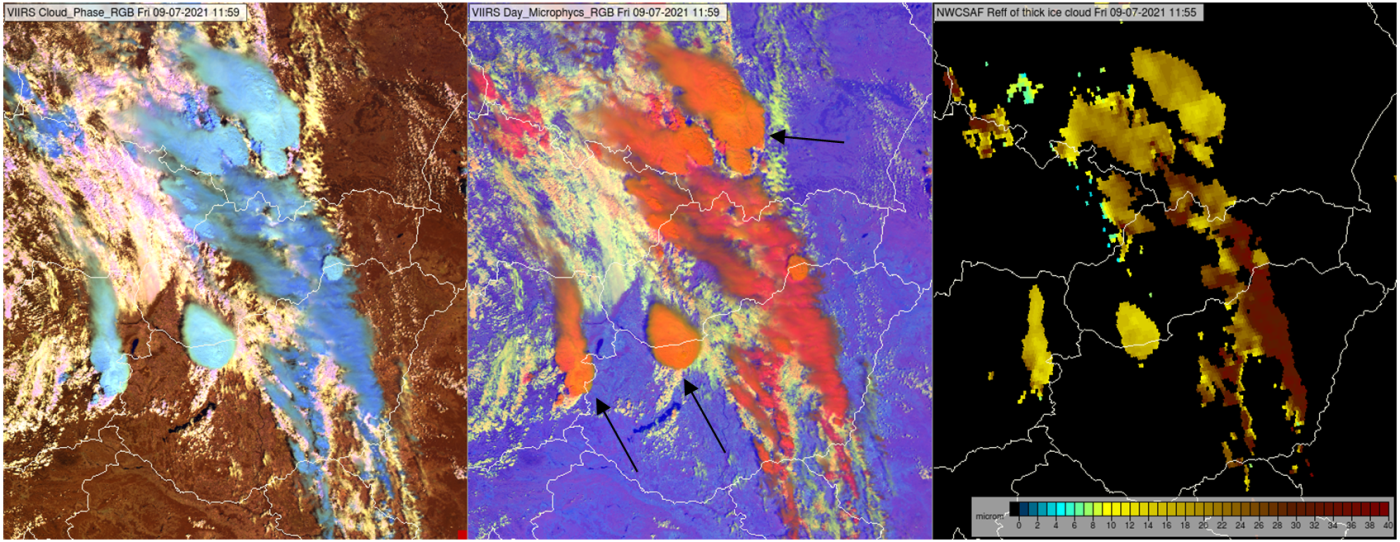
Fig. 1: Left: VIIRS Cloud Phase and Day Microphysics RGB images (left and middle) for 09 July 2021, 11:59 UTC. NWCSAF Cloud Effective Radius product (right) for 09 July 2021, 11:55 UTC.
Figure 2 shows a thunderstorm system over North Italy in two time steps. The left panels show the Cloud Phase RGB, the right panels the Sandwich product. Cloud Phase RGB and Sandwich product complement each other in convection monitoring. Sandwich product provides info on cloud top temperature and the cloud top features, like cold rings and cold U shapes, overshooting tops, gravity waves, ice plumes. Cloud Phase RGB provide info on cloud top microphysics. An F1 tornado was reported around 13 UTC at the location indicated by the arrow.
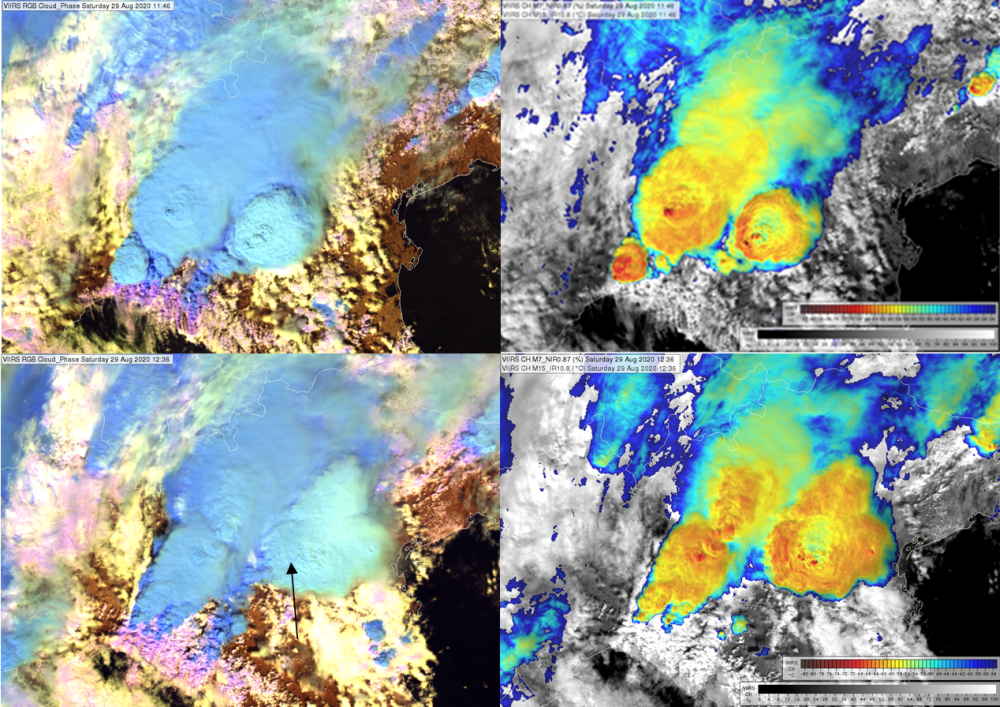
Fig. 2: VIIRS Cloud Phase RGB and Sandwich images taken on 29 August 2020, at 11:46 and 12:36 UTC.
Figure 3 shows thunderstorm system over central Italy. The large bright blue cell indicated by the arrow caused F2 tornado around 11 UTC.
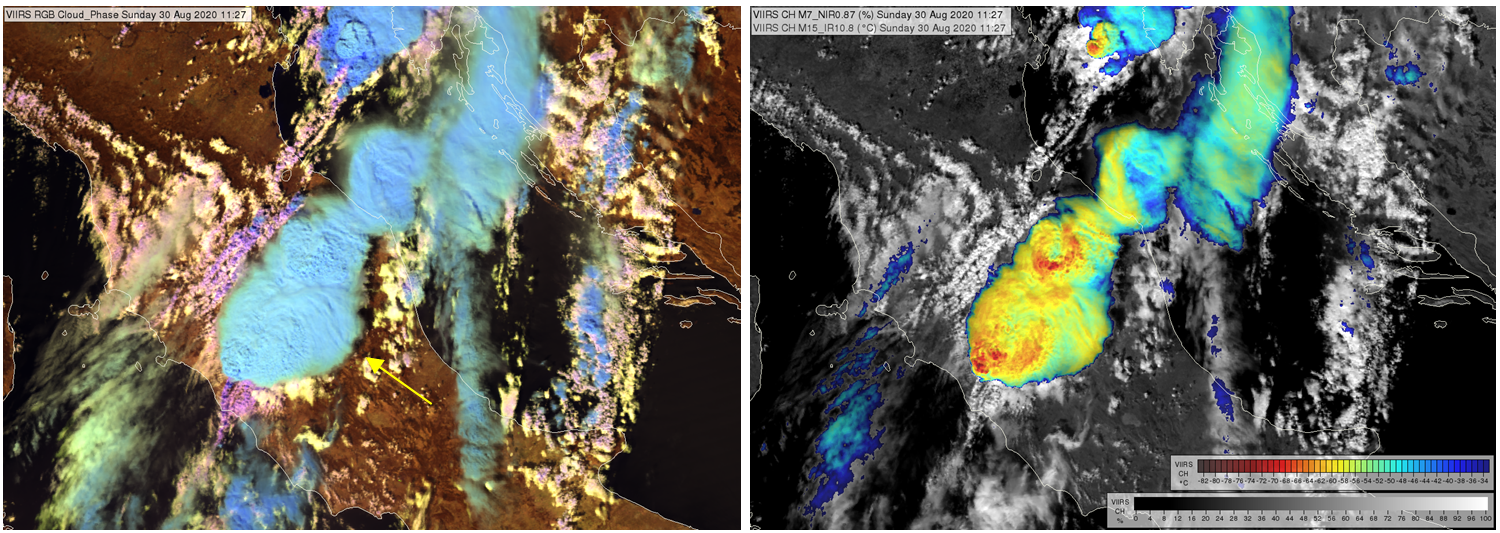
Fig. 3: VIIRS Cloud Phase RGB image and Sandwich product taken on 30 August 2020 at 11:27 UTC.
Note that:
• The actual colour shades depend on the sun-viewing geometry as well (solar and satellite directions).
• Not all convective clouds appearing light blue in Cloud Phase RGB are severe storms.
• Small ice crystals may form not only due to intense updraft. Small ice crystals can be as well observed: on the tops of storms with cold (high) cloud base, in high level lee clouds and on the tops of highly polluted thick ice clouds.
• Thick ice clouds covered by large ice crystals appear medium blue in Cloud Phase RGB.
• If the thick ice cloud is covered by thin cirrus it might appear slightly greenish or whitish.
Explanation of the colours of thick ice clouds covered by small ice crystals in the Cloud Phase RGB (see the recipe):
• The blue signal is large, a thick cloud has high reflectivity in visible spectral region and it is almost independent on the cloud top microphysics.
• In case of small cloud top particles, the 1.6 and 2.25 μm reflectivity values increase (compared to the case of large cloud top particles), see the graph below. Highlighting the 0-50 % reflectivity range, the red and green signals became stronger than medium but usually lower than the blue signal. (Additionally, the green signal is usually slightly stronger than the red one as the absorption of ice at 2.25 μm is somewhat weaker than at 1.6 μm).
Therefore, thick ice clouds covered by small ice crystals usually appear light blue. The blue signal is strong, while the red and green signals are above medium.
In case the cloud top particles are extremely small, it can happen that the green or both the green and red signals saturate and may become even stronger than the blue one. In such cases the resulting colour may turn to whitish or light greenish or light yellowish.
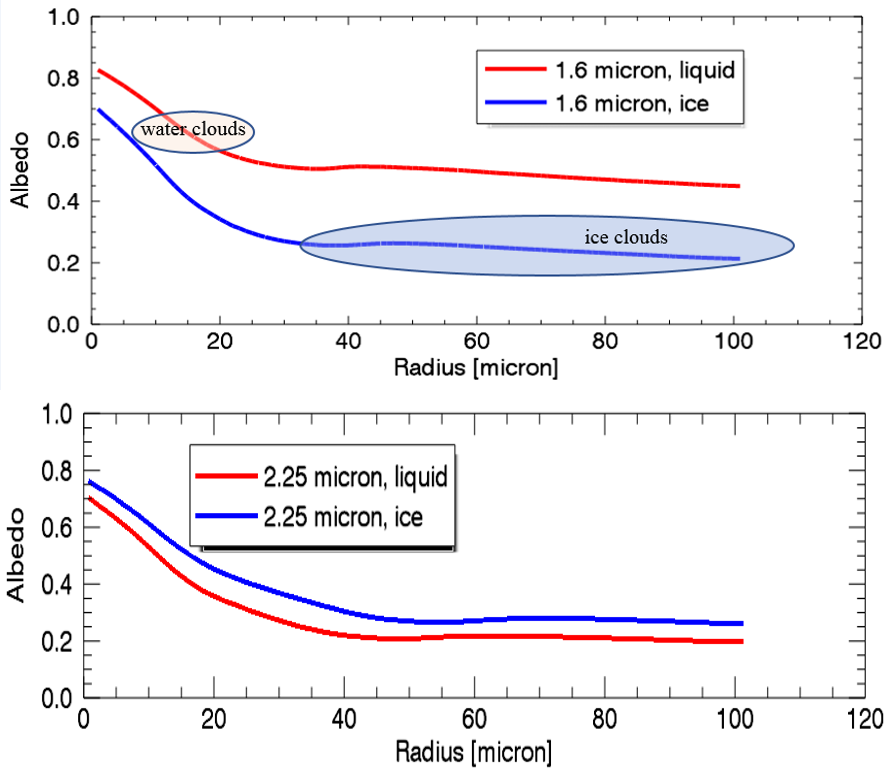
Fig. 4: Simulated reflectivity of thick ice and water clouds as function of the effective radius of the cloud top particles at 1.6 μm (up) and 2.25 μm (bottom) wavelengthes. The typical range of the cloud top particle size of water and ice clouds are indicated in the upper graph.
(Source: Ralf Bennartz, University of Wisconsin–Madison).
Thick fog or low clouds consisting of small droplets usually appear light green at mid-latitudes in the VIIRS Night Microphysics RGB images. In case of warm cloud tops, the colour turns into light blue; while in case of cold cloud tops, it turns into bright green.
In the image below, thick fog/low clouds with small droplets are seen over Czech Republic in light green colour. Cloud top brightness temperature (BT) is around 5°C.
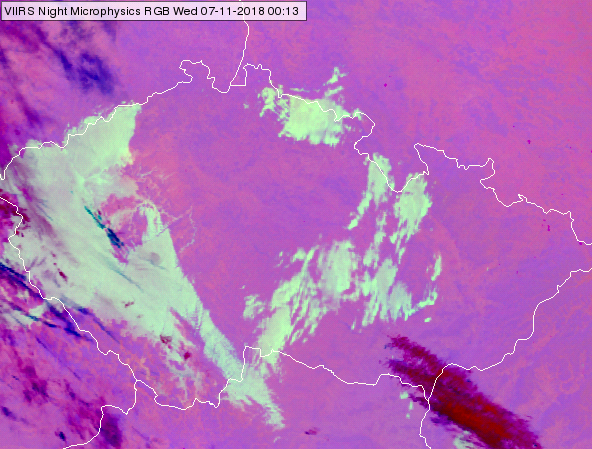
NPP, VIIRS Night Microphysics RGB image for 07 November 2018, 00:13 UTC
The colour shade depends on the temperature as well. Warmer cloud tops have more blue shades, while colder cloud tops have fewer blue shades, see the example below. On the left panel fog is seen at the coast of Portugal; its top brightness temperature is ~ 14°C. On the middle panel fog/low cloud is seen west of the Black Sea, over Moldavia, Romania and Ukraine; here cloud top brightness temperature is ~ 0°C. On the right panel fog/low cloud is seen in Russia, at the border of Ukraine; its cloud top brightness temperature is ~ -12°C.
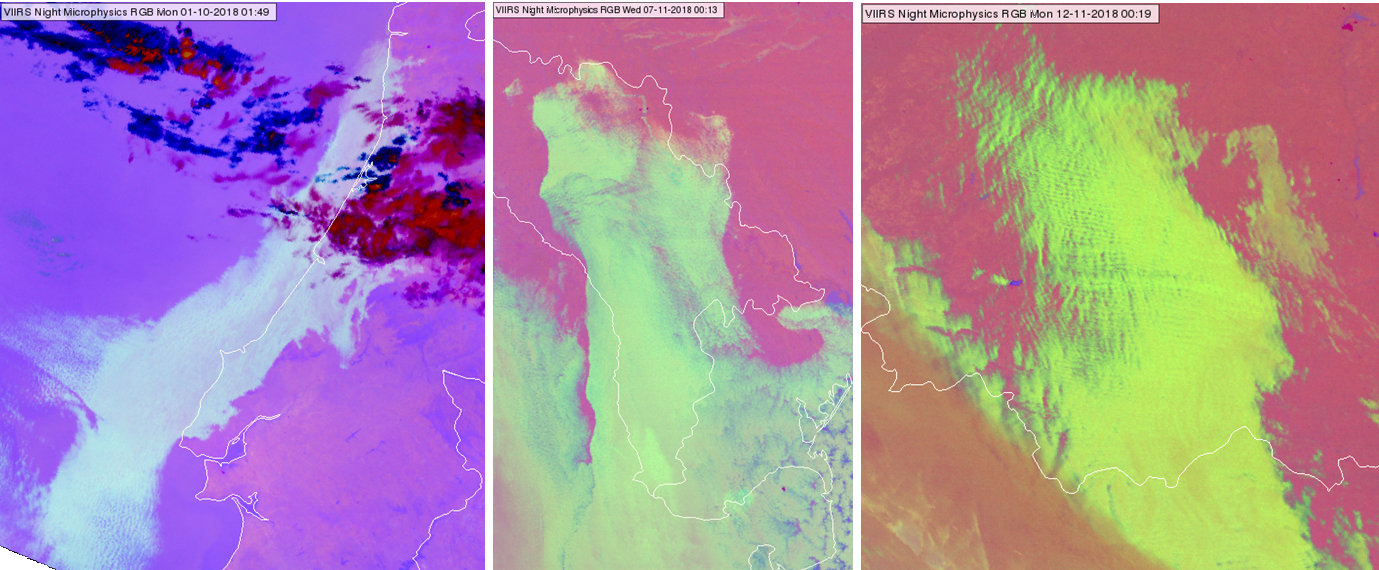
NPP, VIIRS Night Microphysics RGB images taken on 01 October 2018 at 01:49 UTC at coast of Portugal (left), 07 November 2018 at 00:13 UTC east of the Black Sea, over Romania Moldova and Ukraine (middle panel) and 12 November 2018 at 00:19 UTC over Russia and Ukraine (right)
Note that thick fog/low clouds at mid-latitudes can appear also in pinkish grey in case they consist of large droplets.
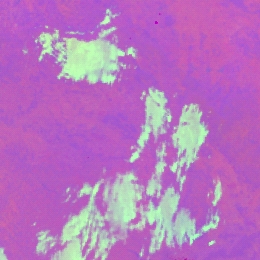
In the image below, mainly thick fog/low clouds are seen over Hungary and Slovakia. In some area the cloud is covered by small droplets (appearing light green), while in other areas the cloud is covered by large droplets (appearing pinkish grey). Note that valley fogs are seen in the Carpathian Mountains, left side of the image.
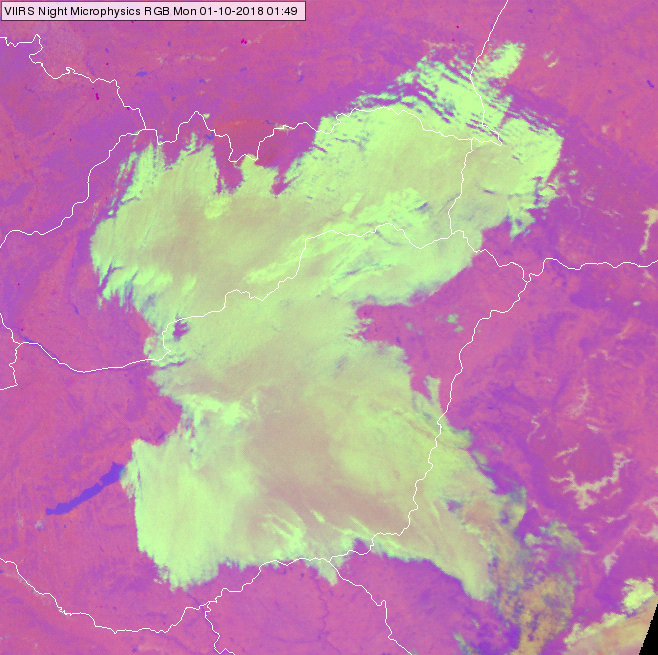
NPP, VIIRS Night Microphysics RGB image for 1 October 2018, 01:49 UTC
The image below shows low clouds consisting of mainly large droplets over east-northern Belarus (appearing in pinkish grey colours). Within this region several greenish plumes are seen indicating low clouds with small droplets. The reason of the strongest plume (indicated by the arrow) is the factories of Novopolotsk city emitting large amount of condensation nuclei.
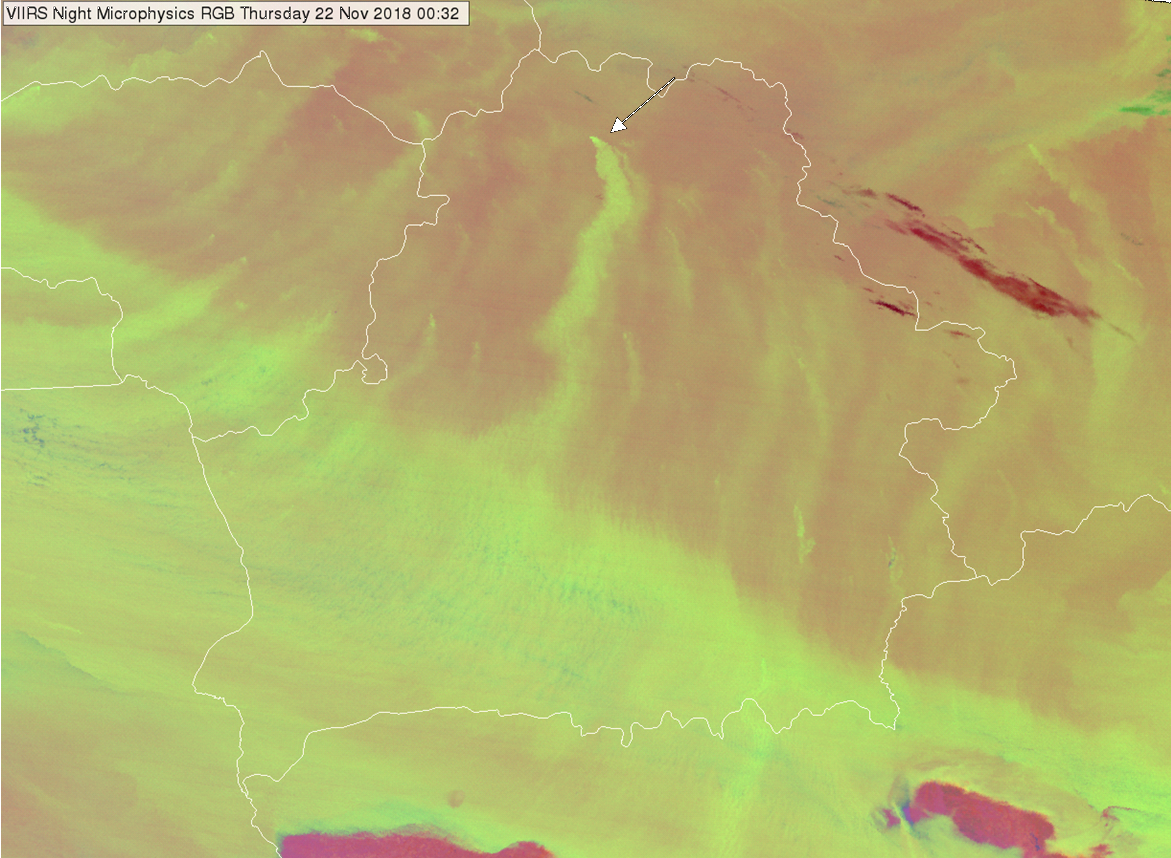
NPP, VIIRS Night Microphysics RGB image of Belarus taken on 22 November 2018, 00:32 UTC
Explanation of the colour of thick fog/low water clouds consisting of small droplets at mid-latitudes in the Night Microphysics RGB (see the recipe):
• For thick clouds the (IR12.0 - IR10.8) brightness temperature difference is close to zero, so the red component will be between medium and maximum.
• For thick fog/low clouds consisting of small droplets, the (IR10.8 - IR3.7) brightness temperature difference is very high (due to different emissivity values), so the green signal will be strong, stronger than the red component.
• The blue signal depends on the cloud top temperature. In case of warmer/colder cloud top temperature, the cloud will have more/fewer blue shapes.
As a consequence, thick fog/low clouds consisting of small droplets appear light green in case of cool cloud top, or light blue in case of warm cloud top, or bright green in case of supercooled water clouds.
Sandy desert appears light blue in the Snow RGB images, in some areas with greenish shades. More greenish shades appear at lower solar elevations. Rocky desert appears medium blue (see the images below and left).
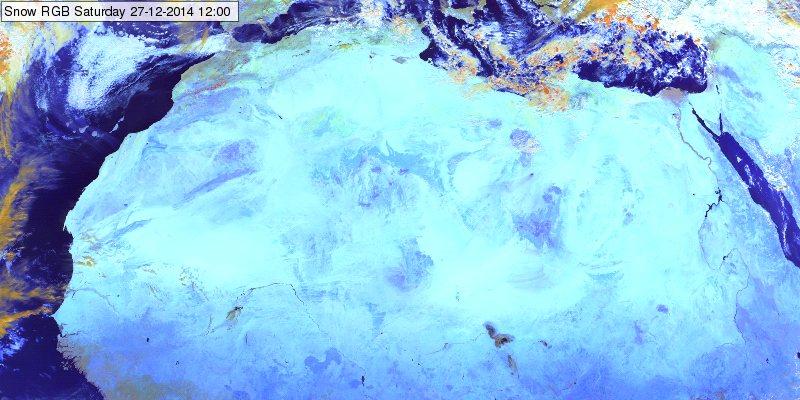
Meteosat, SEVIRI Snow RGB for 27 December 2014, 12:00 UTC
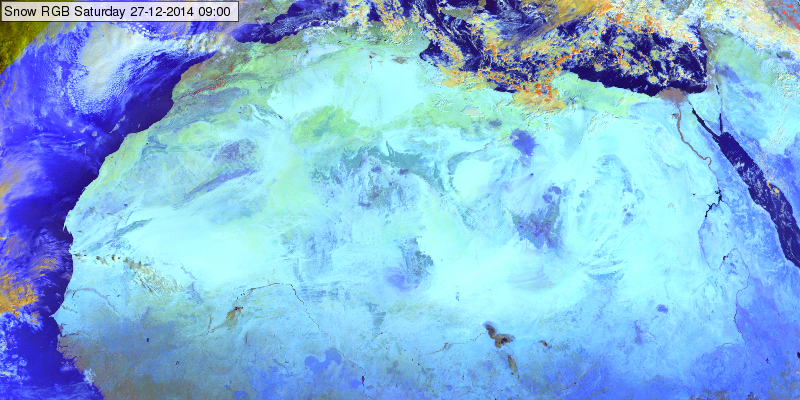
Explanation of the colours for sandy desert (see the recipe):
• The reflectivity of sand is higher in the NIR1.6 channel than in the VIS0.8 channel. After linear stretching, the green signal will be even higher compared to the red beam (see the ranges in the recipe). For high solar elevation usually both, the green and the blue components saturate, while the red component is also considerably high. The resulting colour will be light blue. If the solar elevation is lower, then the sandy desert is shown in greenish tones in some areas.
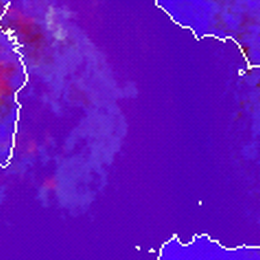
Low-level water clouds over water surfaces are light bluish, although often hardly recognisable in the Severe Storms RGB images.
The Severe Storms RGB was developed to highlight the characteristics of the thick ice clouds. Any other objects are just ‘background’. Detection of the water clouds is not important in this RGB type. Low-level water clouds over land are not even recognizable in the Severe Storms RGB images.
The figures below show some examples. The Day Microphysics RGB images (right) show much more clouds than the Severe Storms RGB images (left). Over land the low level clouds are missing from the Severe Storms RGB images. Over sea they are slightly brighter bluish than the water surface, see the encircled areas.
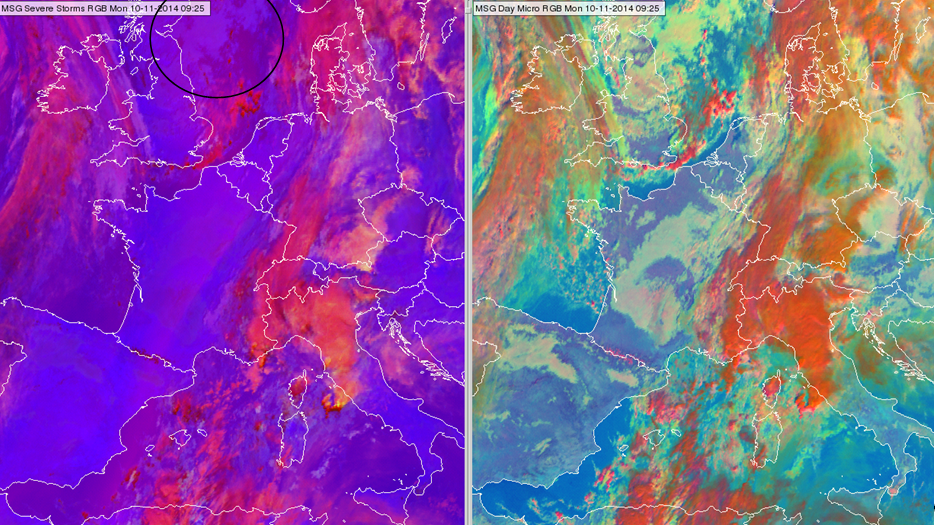
Meteosat, SEVIRI Severe Storms RGB image (left) and the Day Microphysics RGB image (right) for 10 November 2014 09:25 UTC
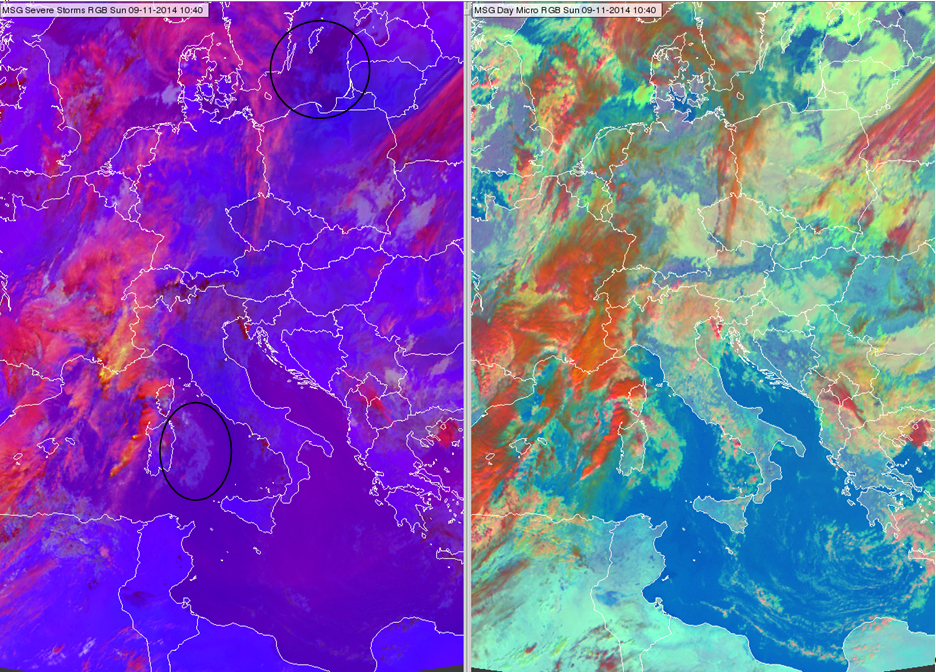
Meteosat, SEVIRI Severe Storms RGB image (left) and the Day Microphysics RGB image (right) for 09 November 2014 10:40 UTC
Note that the mid-level water clouds are well seen (in greyish colours).
Explanation of the colours of the low-level water clouds (see the recipe):
• In the (WV6.2-WV7.3) difference there is no information about low-level clouds. The radiation emitted from their surface is totally absorbed by the water vapour content above them.
• The (IR3.9-IR10.8) difference is definitely higher for low level water clouds than for cloud-free area. However, the gamma correction strongly decreases this contrast.
• The (NIR1.6-VIS0.6) difference is a little bit higher for water clouds than for the water surface. There is a weak contrast between them. (This difference is about the same for water clouds and land - no contrast.)
As a consequence the low level water clouds are only hardly recognizable over water surfaces, they are slightly brighter bluish.