
medium blue
Thick ice clouds covered by large ice crystals appear medium blue in Cloud Phase RGB.
Thick ice clouds have usually large ice crystals on their top. However, there are some exceptions when the cloud top particles are typically small. Such clouds appear light blue in Cloud Phase RGB.
In figures 1 and 2 Cloud Phase RGB is shown together with NWCSAF Cloud Effective Radius product to confirm that the medium blue clouds in Cloud Phase RGB are really covered by large ice crystals. NWCSAF Cloud Effective Radius product shows the cloud top particle size (retrieved from SEVIRI data). To make easier the comparison, only the effective radii of thick ice clouds are visualised by masking water and thin ice clouds. Take into account that the product is retrieved from SEVIRI data which has coarser spatial resolution (hence more mixed pixel) than VIIRS images, and the retrieval is based only on one microphysical channel (NIR1.6).
Figure 1 shows cloudiness of a low pressure system over Southeast Europe. Water clouds appear in yellowish and pinkish colour shades. Thick ice clouds are depicted in blue, while cirrus clouds appear in greenish shades. Land is brown, sea is black.
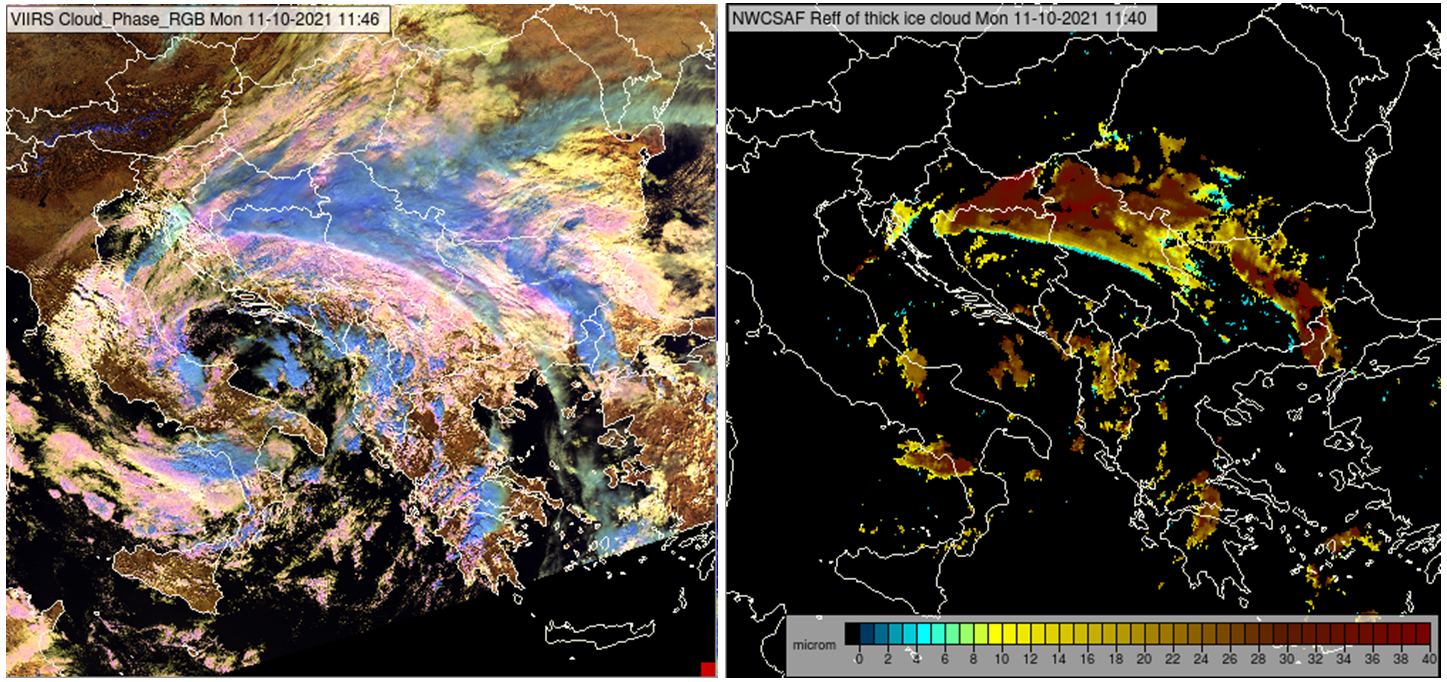
Fig. 1: Left: VIIRS Cloud Phase RGB taken on 11 October 2021 at 11:46 UTC. Right: Cloud Effective Radius of thick ice clouds (retrieved from the 11:40 UTC SEVIRI data by NWCSAF).
Figure 2 shows frontal cloudiness. Shades of purple colour in the Cloud Phase RGB indicate water clouds with extremly large droplets or mixed phase clouds.
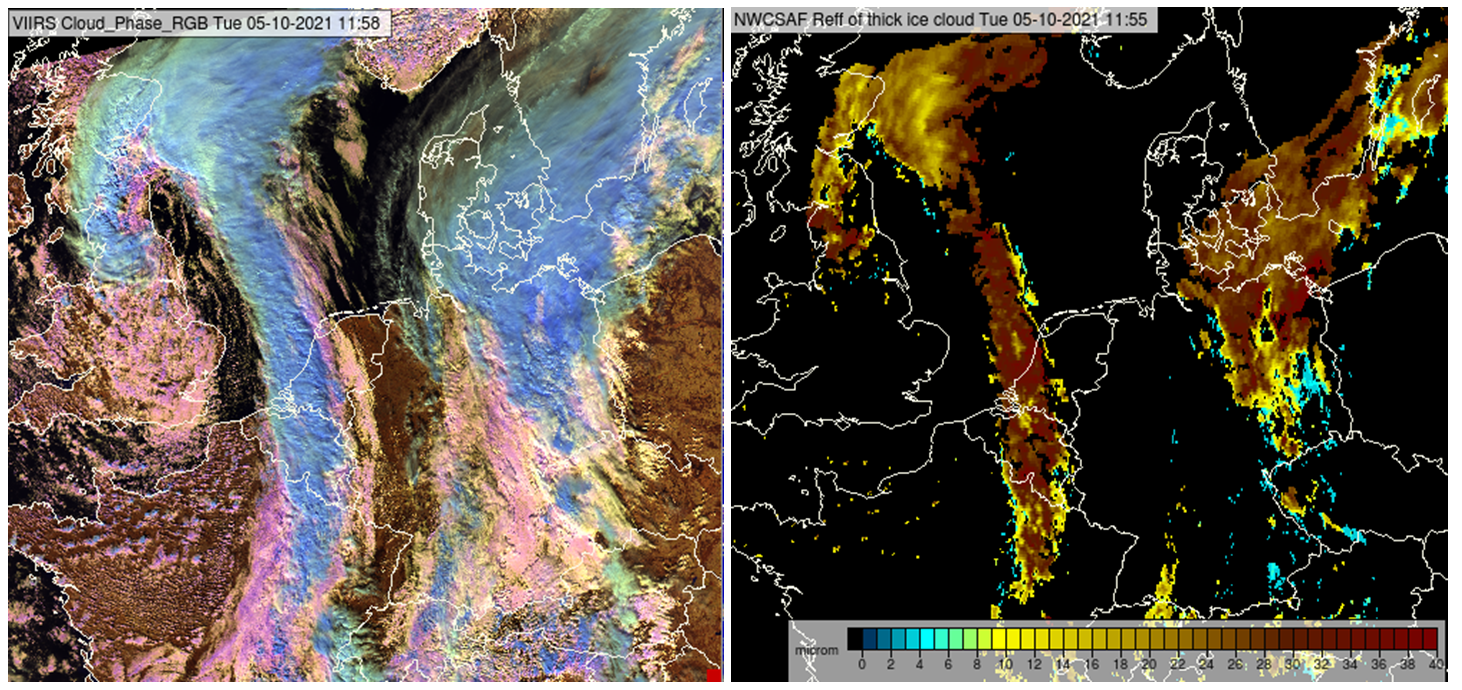
Fig. 2: Left: VIIRS Cloud Phase RGB taken on 5 October 2021 at 11:58 UTC. Right: Cloud Effective Radius of thick ice clouds (retrieved from the 11:55 UTC SEVIRI data by NWCSAF).
In figures 3 and 4 Cloud Phase RGB is shown together with Day Microphysics RGB (created with NIR1.6). Day Microphysics RGB is also sensitive to cloud top microphysics (phase and mean particle size of the cloud top elements). Thick ice clouds covered by large ice crystals appear red, thick ice clouds covered by small ice crystals appear orange. Water clouds with small droplets appear greenish, while water clouds with large droplets and mixed phase clouds are pinkish.
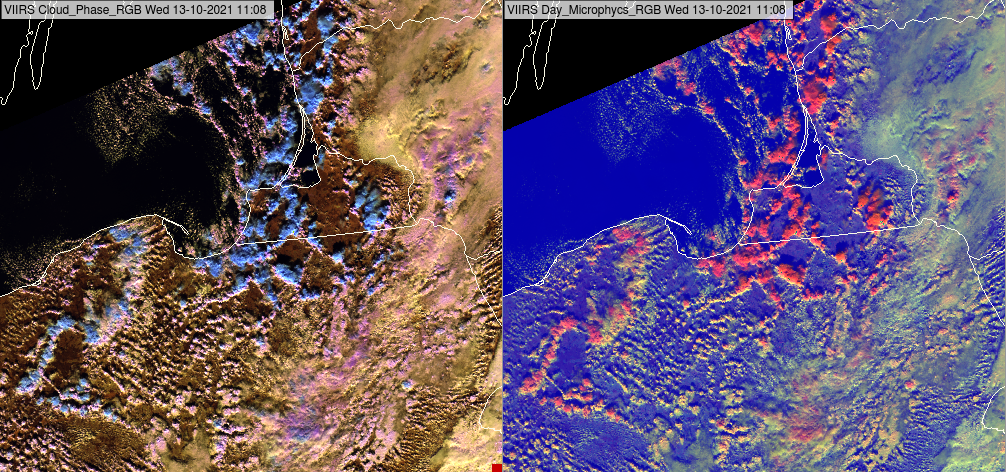
Fig. 3: VIIRS Cloud Phase RGB and Day Microphysics RGB (created with NIR1.6) taken on 13 October 2021 at 11:08 UTC.
Figure 4 shows towering cumulus clouds behind a waving front.
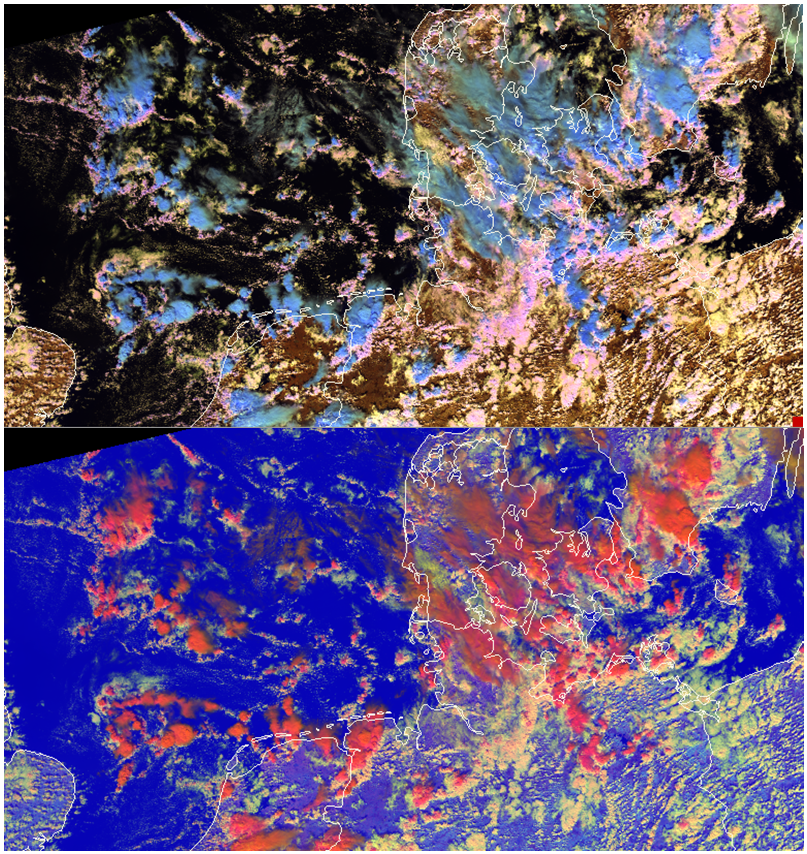
Fig. 4: VIIRS Cloud Phase RGB and Day Microphysics RGB (created with NIR1.6) taken on 13 August 2019 at 11:58 UTC.
Note that:
• The actual colour shades depend on the sun-viewing geometry as well (solar and satellite directions).
• Thick ice clouds covered by small ice crystals usually appear light blue.
Explanation of the colours of thick ice clouds covered by large ice crystals in the Cloud Phase RGB (see the recipe):
• The blue signal is large, a thick clouds have high reflectivity in the visible spectral region and it is almost independent on the cloud top microphysics.
• The 1.6 and 2.25 μm reflectivity values are usually much lower, see the graph below. After highlighting the 0-50% reflectivity range, the red and green signals will be around the half of the blue signal. (Additionally, the green signal is usually slightly stronger than the red one, since the absorption of ice at 2.25 μm is somewhat weaker than at 1.6 μm).
Therefore, thick ice clouds covered by large ice crystals appear medium blue (strong blue and medium red and green signals).
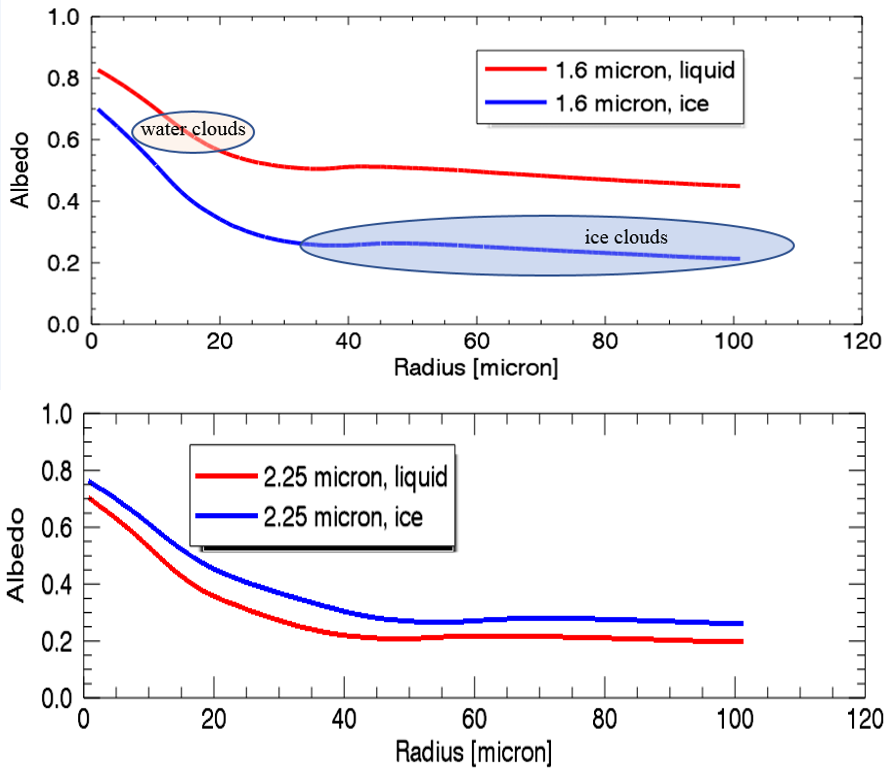
Fig. 5: Simulated reflectivity of thick ice and water clouds as function of the effective radius of the cloud top particles at 1.6 μm (up) and 2.25 μm (bottom) wavelengthes. The typical range of the cloud top particle size of water and ice clouds are indicated in the upper graph.
(Source: Ralf Bennartz, University of Wisconsin–Madison).
Thin fog or low clouds over sea appear usually greyish blue or medium blue at mid-latitudes in the VIIRS Night Microphysics RGB images.
The Night Microphysics RGB is very sensitive to the thin mid- and high-level clouds. They typically have a distinct colour contrast both against thick clouds and cloud-free surface. However, in case of low clouds this is true only in special conditions. Such examples will be presented.
Thin fog/low clouds over sea may appear in many colour shades:
• The colour shade depends on the transparency of the thin fog/cloud, and on its microphysical properties.
• The colour shade depends on the colour of the low cloud.
• The colour shade depends on the colour of the underlaying surface.
---- Above bluish sea the thin water cloud usually appears greyish blue.
---- Above purple/pinkish sea the thin fog/low cloud above it contains more red shades.
• The colour shade of thin fog/low clouds depends on the cloud top temperature as well. Warmer cloud tops have more blue shade, colder cloud tops have less blue shade.
• In case of much colder fog/low clouds above warm sea, the thin part of the cloud will have a definite colour contrast both against sea surface and the thick part of the cloud. In that case the thin fog/low clouds usually appear medium (greyish) blue.
Below examples show these colour shade variations.
Thin fog/low clouds over bluish background (warm sea with not too dry atmosphere above) appear blue or greyish blue. In the presented cases the cloud temperature was close to the sea temperature: the sea surface brightness temperature (BT) was 15 - 19°C, while the cloud top temperature was 15 - 16°C.
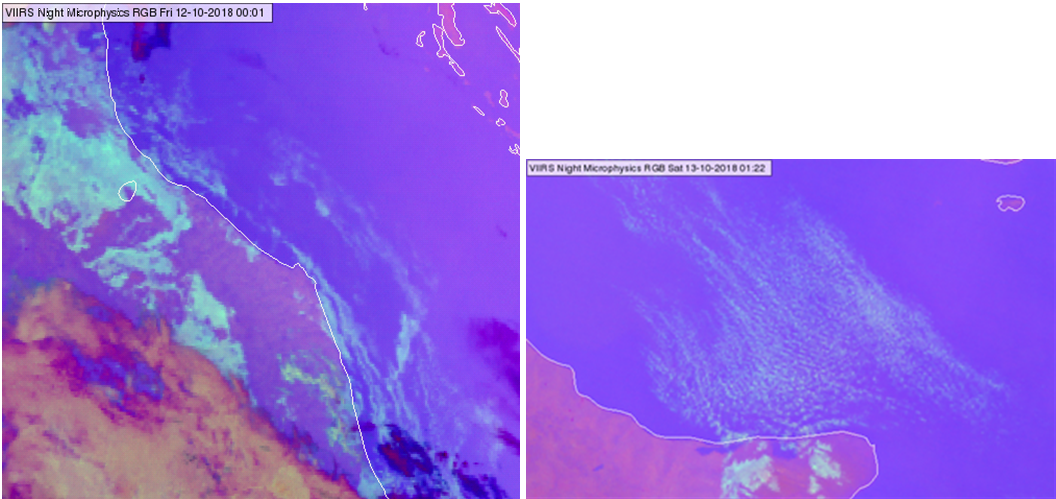
NPP, VIIRS Night Microphysics RGB image over the coast of Italy taken on 12 and 13 October 2018 at 00:01 and 01:22 UTC
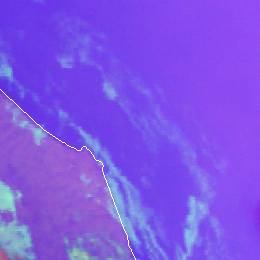
The next image shows an example when the sea had more red shades (colder temperature or dry atmosphere above), and again the cloud temperature was close to the sea temperature (BT~10°C). In this case the thin fog/low clouds have more red shades, they may appear pinkish grey.
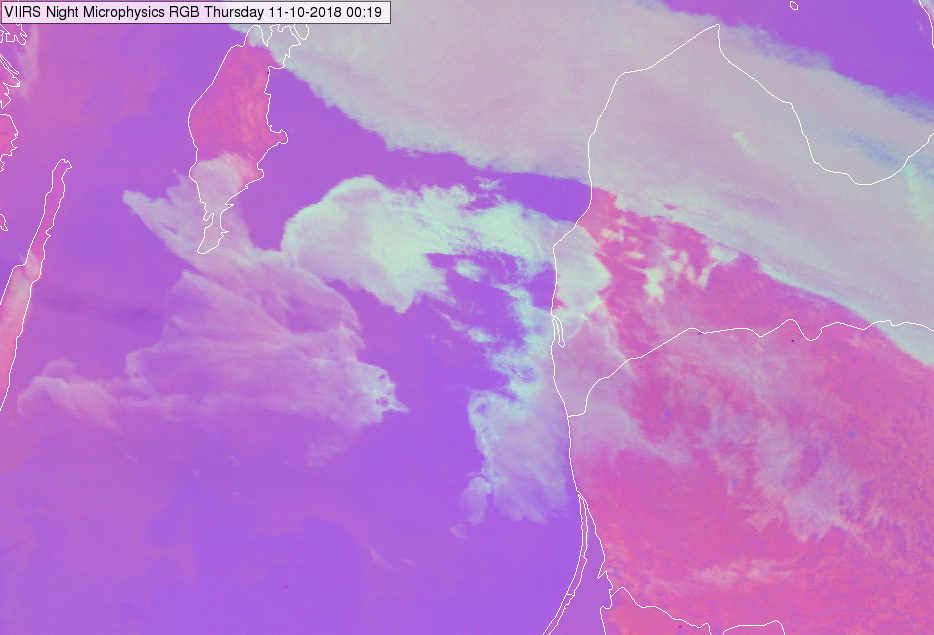
NPP, VIIRS Night Microphysics RGB image over coast of the Baltic Countries taken on 11 October 2018 at 00:19 UTC
The next images show examples of the special condition mentioned in the second paragraph, when the low-level thin clouds are best seen.
If a much colder fog/low cloud is advected above warm sea then its thin part usually appears medium blue or greyish blue with a definite colour contrast both against cloud-free sea and thick parts of the cloud (blue against purple, and blue against green of pinkish grey). In the examples below the sea BT was around 17°C, while the cloud top temperature was around 3-4°C.
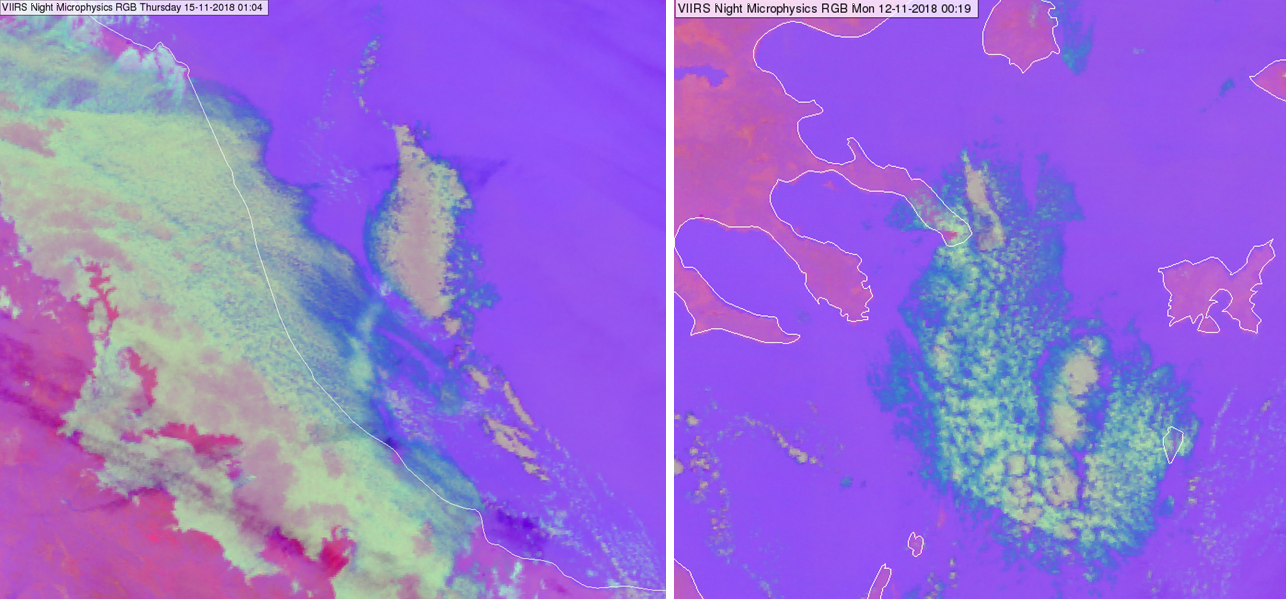
NPP, VIIRS Night Microphysics RGB image over coast of Italy taken on 15 November 2018 at 01:04 UTC (left) and over Greece and Aegean Sea taken on 12 November 2018 at 00:19 UTC (right)
A similar case is seen in the next image over the Black Sea. The sea BT was around 15°C, while the cloud top temperature was around 3-4°C.
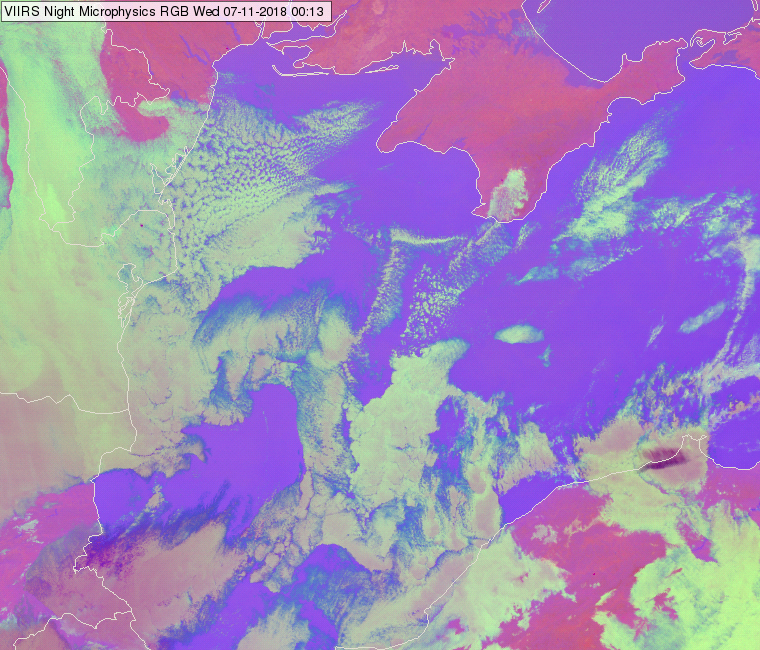
NPP, VIIRS Night Microphysics RGB image over the Black sea region taken on 07 November 2018 at 00:13 UTC
However, if the sea surface is cold then this effect is much weaker. In the example below the sea BT was between 1 and 4°C, while the cloud top BT was -6 to -8°C. In that case (high temperature difference, but cold sea) the thin part of the fog/low cloud will not have such a definite colour contrast against the sea and the thick part of the cloud.
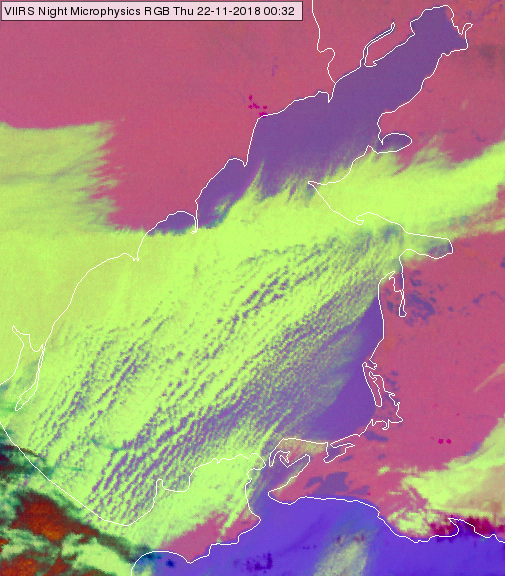
NPP, VIIRS Night Microphysics RGB image over Sea of Azov taken on 22 November 2018 at 00:32 UTC
Explanation of the colour of thin fog/low water clouds over sea at mid-latitudes in the Night Microphysics RGB (see the recipe):
In case of a thin cloud the measured radiance is a mixture of the radiance coming from below and the radiance emitted by it. Additionally, the BT differences in the red and green components decrease in case the thin fog/low cloud is much colder than the warm sea below it.
• In case the thin fog/low cloud is NOT much colder than the warm sea below it, the colour of the thin cloud will be a ‘simple weighted mixture’ of the colour of the sea and the colour of the (thick) cloud. (The weights depend on the transparency of the cloud.)
--- In case of bluish sea thin fog/low cloud usually appear bluish grey.
--- In case of pinkish/purple sea the thin fog/low cloud may appear pinkish grey or grey.
• If the fog/low cloud is much colder than the warm sea below, then the (IR12.0 - IR10.8) brightness temperature difference decreases and the red component will be less than medium strong. The (IR10.8 - 3.7) brightness temperature difference also decreases. In that case the thin cloud became greyish blue or medium blue with a distinct colour contrast both against thick clouds and cloud-free surface.
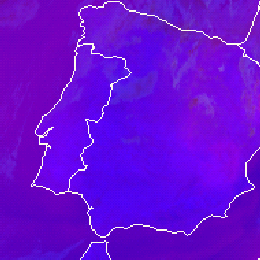
Land surfaces are depicted in medium blue or violet colours in the Severe Storm RGB. Note that if the land is covered by snow the colour will change considerably.
The Severe Storms RGB was developed to highlight the characteristics of the thick ice clouds. The other phenomena are just ‘background’. Cloud-free land and water are blue or violet in this RGB type, having good colour contrast with the colours of ice clouds (red, yellow). See for example the image below.
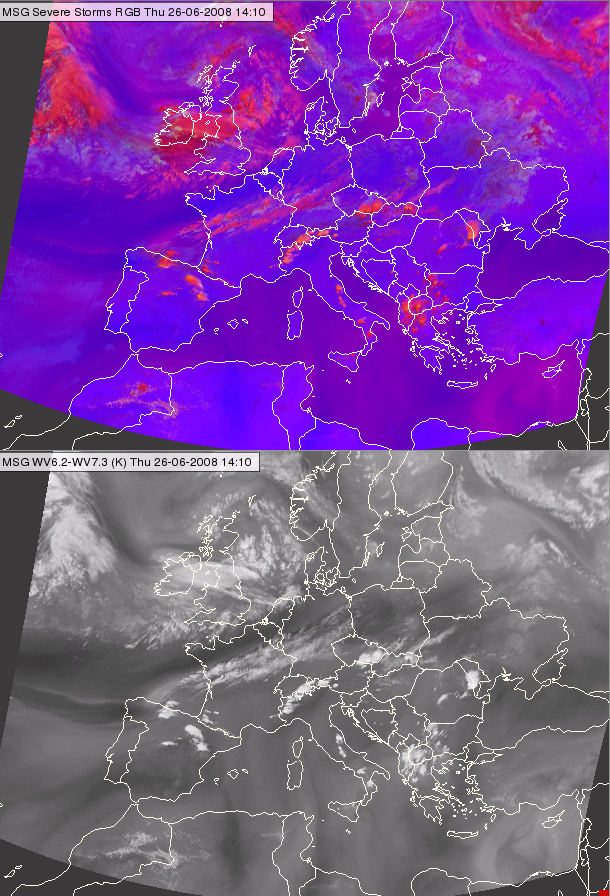
Meteosat SEVIRI Severe Storm RGB image (up) and the (WV6.3-WV7.2) difference image (down) for 26 June 2008 14:10 UTC
In the red colour beam the (WV6.2-WV7.3) channel difference is visualised. The structure of the (WV6.2-WV7.3) channel difference appears also in the cloud free areas - with reddish tones in the blue background. In the figure above both the RGB and the WV channel difference are shown. Land is medium blue on areas with less reddish tones, and violet on areas with more reddish tones.
Explanation of the colours of land surfaces not covered by snow (see the recipe):
• The (WV6.2 – WV7.3) difference is negative for cloud free areas. This results low to medium signal in the red colour beam, (higher signal for dry than for wet mid troposphere).
• The (IR3.9 – IR10.8) difference is around zero for land surfaces resulting almost zero signal in the green colour beam.
• The (NIR1.6 – VIS0.6) difference is positive, resulting strong signal in blue colour beam, (stronger for desert than for vegetated area).
As a consequence the signal will be low to medium in red, almost zero in green and high in blue colour beams for land surfaces.