
blue

The limb cooling effect appears blue in the Airmass RGB images.
The blue colour in the Airmass RGB usually indicates polar air masses but can also be caused by radiation from full disk image edges.
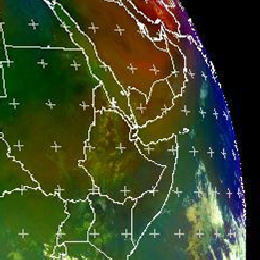
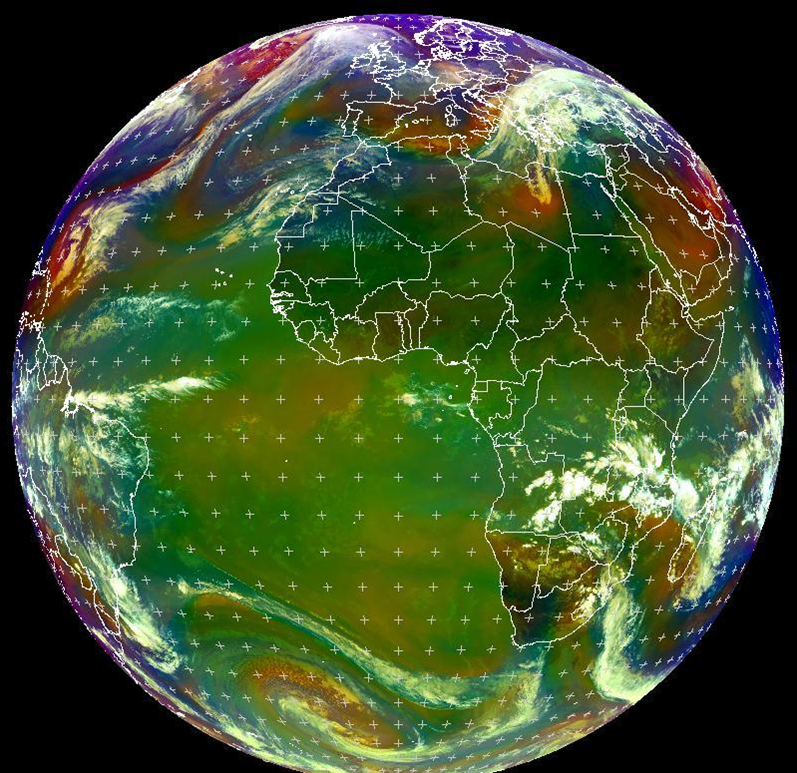
The blue colour in the Airmass RGB stems from the so-called "limb cooling effect". If the whole disk of the Airmass RGB is plotted, one sees that the blue colour prevails at the image edge even in the tropical regions. Radiation from the image edge (full disk image) traverses a longer path through the troposphere until it reaches the satellite instrument. Therefore, the measured radiances, especially in the WV bands, are far smaller than from regions near the sub-satellite point (see image below).

Explanation of the blue colour of the limb cooling effect in the Airmass RGB (see also the recipe on the left side):
• High humidity values reflected in both the WV6.2 and the WV7.3 channel result in a low contribution of the red colour beam.
• The inclined viewing angle at full disk image edges are reducing the radiation measured at 9.7 micrometer, while the window channel at 10.8 micrometer remains largely unaffected. A larger (negative) brightness temperature difference results in a small green contribution.
• The main contribution comes from the blue colour beam. Because of the inclined viewing angle, brightness temperatures measured at 6.2 micrometer are rather low.
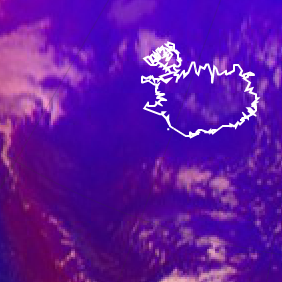
Polar air masses appear blue in the Airmass RGB images.
The blue colour in the Airmass RGB indicates polar air masses characterised by a low tropopause.
Due to higher upper level tropospheric humidity, the brightness temperature difference (BTD) WV6.2-WV7.3, which determines the red colour beam, is large. The scale for the red colour beam is chosen this way, that large BTD lead to small contributions of the red colour. Hence, the red contribution is not 0, but certainly low.
The green colour beam gives no contribution in case of polar air masses. Green stems from the BTD of channels IR9.7 and IR10.8. The larger the difference between both BTD, the smaller the green contribution. The channel IR9.7 is responsive to ozone gas concentration in the lower stratosphere. Polar regions are characterised by a low tropopause level and, hand in hand, by a lower altitude of the ozone rich stratospheric air. As the air mass is ozone rich in the levels where IR9.7 has its contribution maximum, the resulting BTD is large (largely negative).
The main contribution comes from the blue colour beam. Because of the colder atmosphere and the inclined viewing angle, brightness temperatures measured at 6.2 micrometer are rather low.
The blue colour in the Airmass RGB can also come from the so-called "limb cooling effect". If the whole disk of the Airmass RGB is plotted, one sees that the blue colour prevails at the image edge even in the tropical regions. Radiation from the image edge (full disk image) traverses a longer path through the troposphere until it reaches the satellite instrument. Therefore, the measured radiances are far smaller than from regions near the sub-satellite point (see image below).

Explanation of the colour of polar airmasses in the Airmass RGB (see also the recipe on the left side):
• Polar air masses are characterised by their blue colour in the Airmass RGB. This results from a combination of a low tropopause level (cold airmass) and high ozone concentration in the level of highest instrument sensitivity.
• The blue colour can also be caused by the "limb cooling effect" which can be observed in tropical regions at the edge of the full disk scan
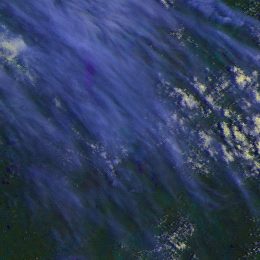
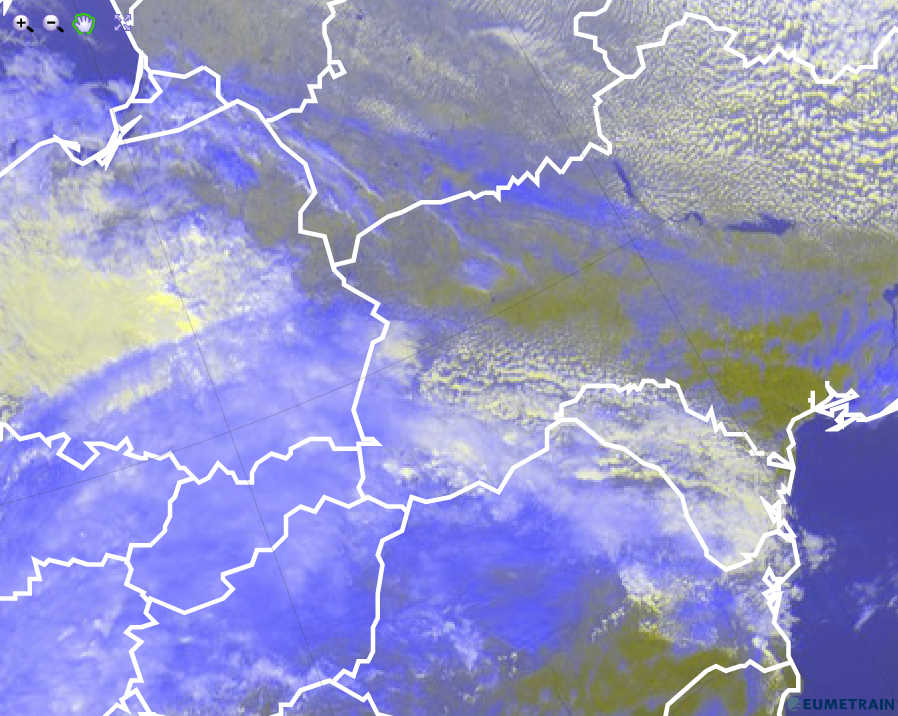
Thin high-level clouds appear bluish in the AVHRR Cloud RGB images.
Note that the AVHRR Cloud RGB contains information on transparency and temperature, but it has no information on cloud phase.
The images below show thin high-level clouds over sea, land and water clouds.
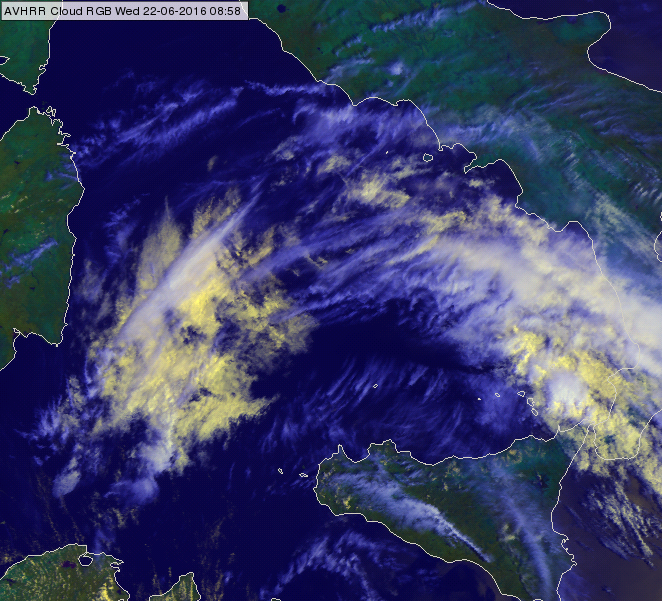
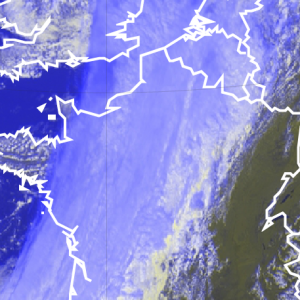
MetOp-B, AVHRR Cloud RGB of the Tyrrhenian Sea region for 22 June 2016 at 08:58 UTC
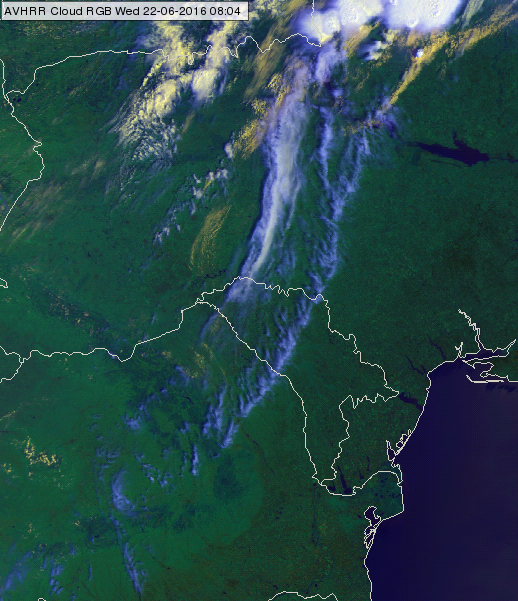
MetOp-A, AVHRR Cloud RGB over Ukraine, Moldova and Romania for 23 June 2016 at 08:04 UTC
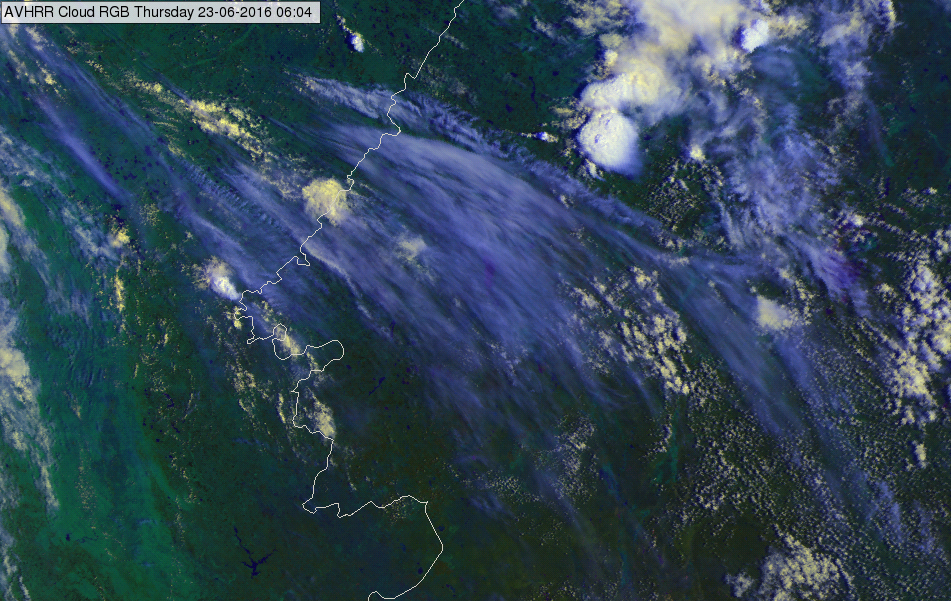
MetOp-A, AVHRR Cloud RGB over the border of Russia and Kazakhstan for 23 June 2016 at 06:04 UTC
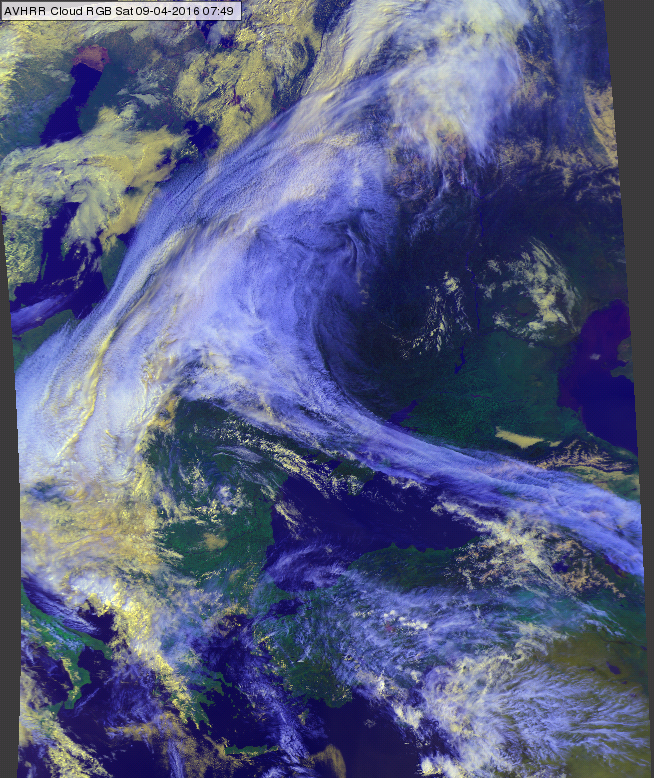
AVHRR Cloud RGB image of eastern Europe for 09 April 2016 at 07:49 UTC
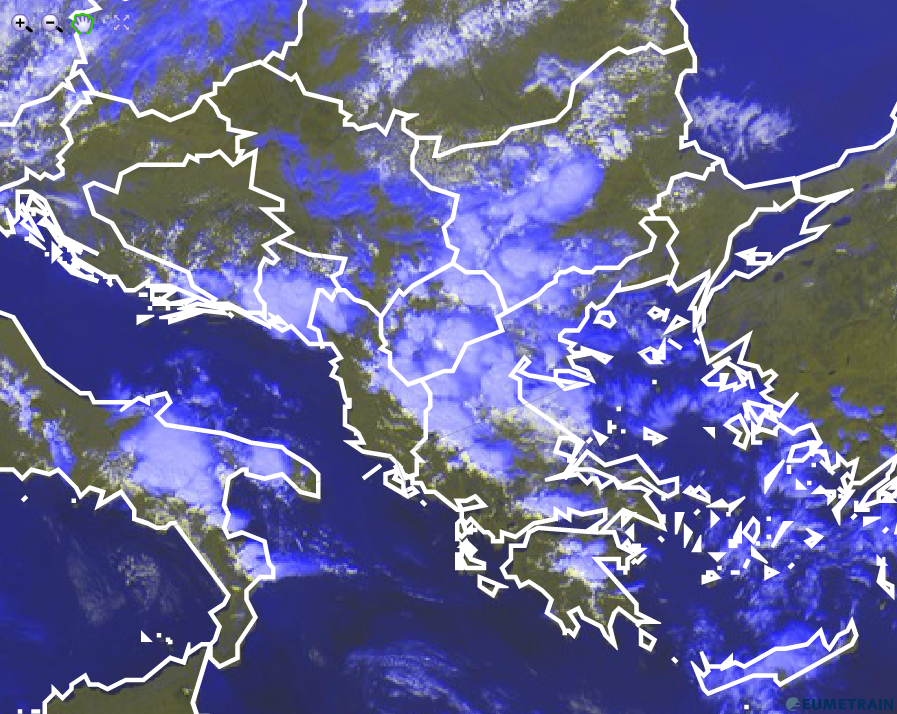
The image below shows a convective system with large, extended thin cirrus anvil.
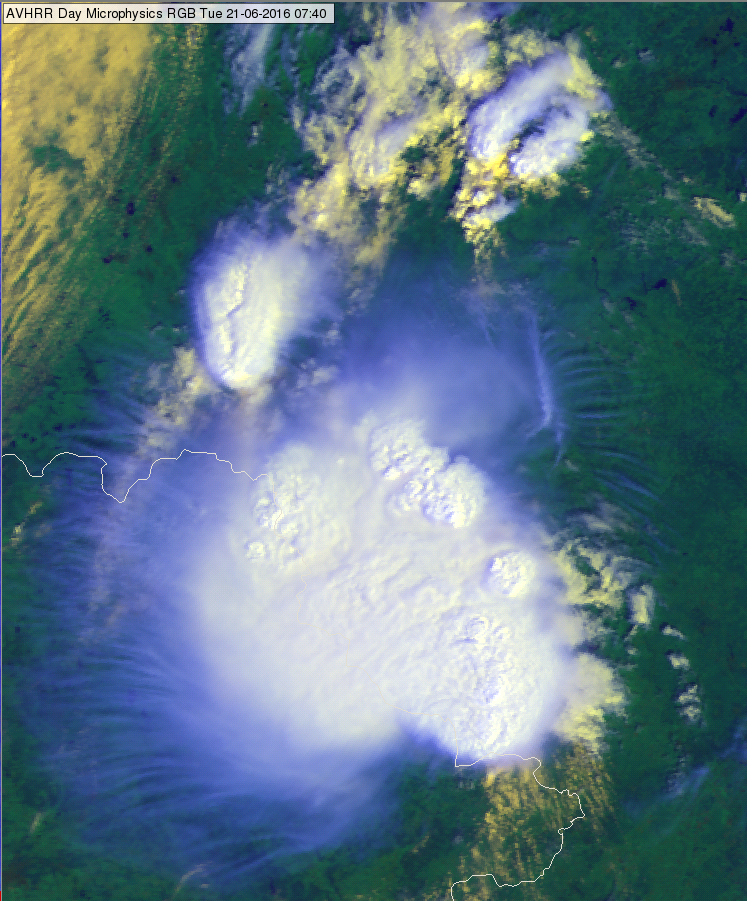
MetOp-B, AVHRR Cloud RGB over the border of Russia and Belarus for 21 June 2016 at 07:40 UTC
Explanation of the colours of thin high-level clouds (see the recipe):
• The reflectivity values of the thin high-level clouds are low both in VIS0.63 and NIR0.87 channels. Thin cirrus clouds do not reflect much – as they are thin.
• The brightness temperature of the cirrus cloud is between the cirrus cloud temperature and the temperature of the underlying surface, (the ‘weighting’ depends on the transparency).
Thin cirrus clouds are usually better seen in the thermal infrared region than in the shortwave channels. As a consequence, thin cirrus clouds appear bluish in the AVHRR Cloud RGB.
The high-level semi-transparent clouds add a bluish tone to the colour of the underlying surface. The colour of the semi-transparent clouds depends on the colour of the underlying surface (land, sea or lower lever clouds) and on its transparency. The thinner the cirrus clouds the closer is its colour to the colour of the underlying surface.
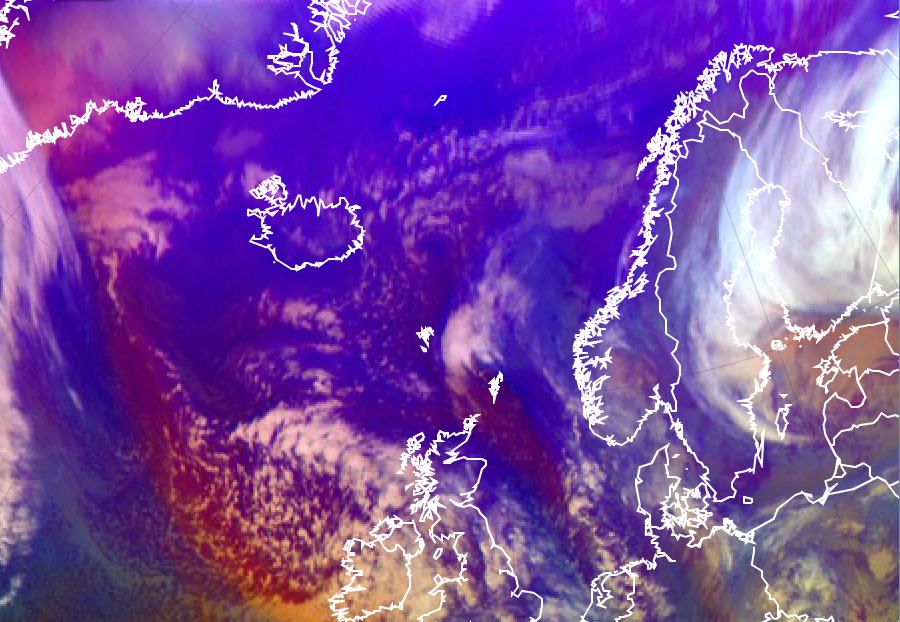
The limb cooling effect appears blue in the Airmass RGB images.
The blue colour in the Airmass RGB usually indicates polar air masses but can also be caused by radiation from full disk image edges.
The blue colour in the Airmass RGB stems from the so-called "limb cooling effect". If the whole disk of the Airmass RGB is plotted, one sees that the blue colour prevails at the image edge even in the tropical regions. Radiation from the image edge (full disk image) traverses a longer path through the troposphere until it reaches the satellite instrument. Therefore, the measured radiances, especially in the WV bands, are far smaller than from regions near the sub-satellite point (see image below).

Airmass RGB for 13 January 2016 13:00 UTC
Explanation of the blue colour of the limb cooling effect in the Airmass RGB (see the recipe):
• High humidity values reflected in both the WV6.2 and the WV7.3 channel result in a low contribution of the red colour beam.
• The inclined viewing angle at full disk image edges are reducing the radiation measured at 9.7 micrometer, while the window channel at 10.8 micrometer remains largely unaffected. A larger (negative) brightness temperature difference results in a small green contribution.
• The main contribution comes from the blue colour beam. Because of the inclined viewing angle, brightness temperatures measured at 6.2 micrometer are rather low.
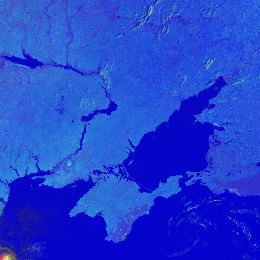
The AVHRR sensor on MetOp measures in the visible channels 0.87 micron and 1.6 micron only small amounts of backscattered solar radiation from water surfaces, because water strongly absorbs the shortwave radiation. Therefore, in the Day Microphysics RGB images (see the recipe) both the red and the green colour beams are weak for these areas. The only colour beam with noteworthy contribution is the blue one visualizing the 10.8 micron channel. As a consequence the Day Microphysics RGB depicts the open water surfaces in medium or somewhat darker blue shades depending on the water skin temperature (the warmer – the darker).
The image below shows the area of Black and Caspian Seas on 03 September 2014 at 07:34 UTC. Several rivers, like Volga, Dnieper are well seen.
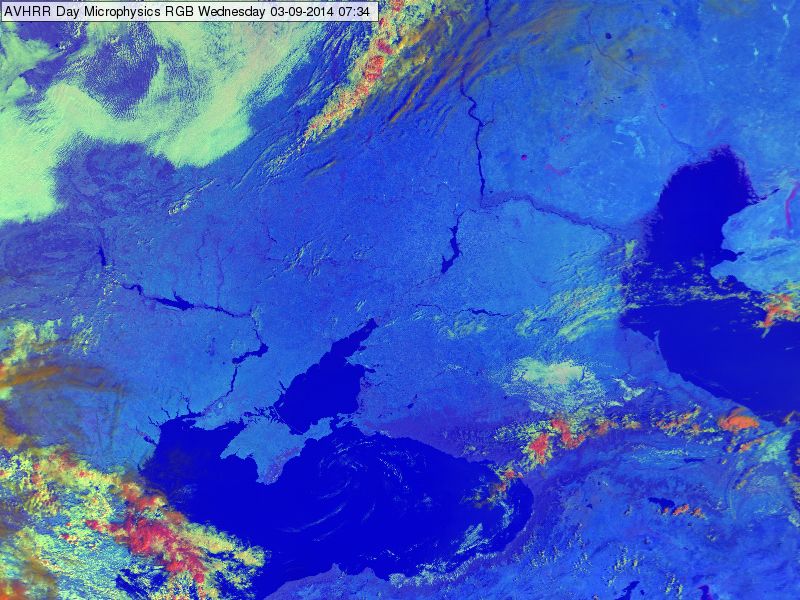
MetOp AVHRR Day Microphysics RGB image, 03 September 2014 07:34 UTC
The following image shows the area of the Adriatic, Aegean Seas and the western coast of the Black Sea. Also the river Danube is well recognizable.
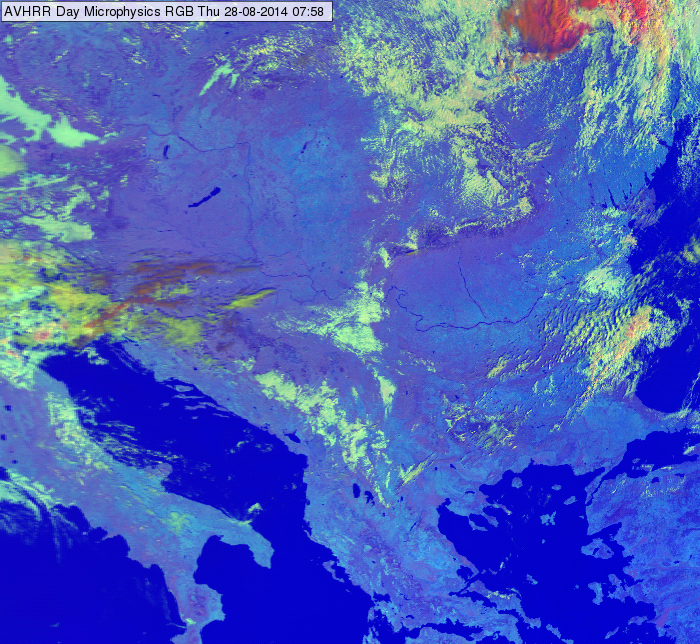
MetOp AVHRR Day Microphysics RGB image, 28 August 2014 07:58 UTC
Note that water covered by ice or by vegetation has different colours in the Day Microphysics RGB images. If the lake is covered by vegetation (e.g. reed) its colour shifts towards violet, if it is covered by ice (partly or totally), its colour shifts towards magenta.
On the sunglint area, the color may alter considerably. Sunglint is the mirror-like reflection of the Sun off a water surface in a satellite image. Over such areas the red and green color signals will not be negligible any more. The intensity of the solar reflection depends on the water surface roughness (magnitude of the waves). The color may alter only slightly by shifting towards cyan, or can change considerably, even into magenta. An example is shown in the image below, where the sunglint area is indicated by the yellow circles.
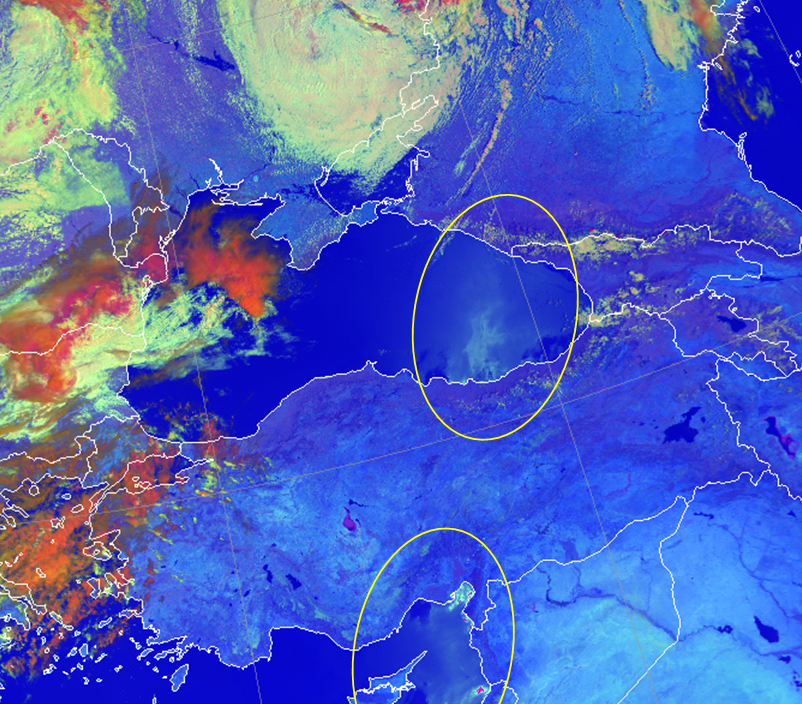
MetOp AVHRR Day Microphysics RGB image, 27 June 2014 07:40 UTC. Sun glint areas over water inside yellow circles.

Polar air masses appear blue in the Airmass RGB images.
The blue colour in the Airmass RGB indicates polar air masses characterised by a low tropopause.
Due to higher upper level tropospheric humidity, the brightness temperature difference (BTD) WV6.2-WV7.3, which determines the red colour beam, is large. The scale for the red colour beam is chosen this way, that large BTD lead to small contributions of the red colour. Hence, the red contribution is not 0, but certainly low.
The green colour beam gives no contribution in case of polar air masses. Green stems from the BTD of channels IR9.7 and IR10.8. The larger the difference between both BTD, the smaller the green contribution. The channel IR9.7 is responsive to ozone gas concentration in the lower stratosphere. Polar regions are characterised by a low tropopause level and, hand in hand, by a lower altitude of the ozone rich stratospheric air. As the air mass is ozone rich in the levels where IR9.7 has its contribution maximum, the resulting BTD is large (largely negative).
The main contribution comes from the blue colour beam. Because of the colder atmosphere and the inclined viewing angle, brightness temperatures measured at 6.2 micrometer are rather low.

Airmass RGB for 13 January 2016 12:00 UTC
The blue colour in the Airmass RGB can also come from the so-called "limb cooling effect". If the whole disk of the Airmass RGB is plotted, one sees that the blue colour prevails at the image edge even in the tropical regions. Radiation from the image edge (full disk image) traverses a longer path through the troposphere until it reaches the satellite instrument. Therefore, the measured radiances are far smaller than from regions near the sub-satellite point (see image below).
Airmass RGB for 13 January 2016 13:00 UTC
Explanation of the colour of polar airmasses in the Airmass RGB (see the recipe):
• Polar air masses are characterised by their blue colour in the Airmass RGB. This results from a combination of a low tropopause level (cold airmass) and high ozone concentration in the level of highest instrument sensitivity.
• The blue colour can also be caused by the "limb cooling effect" which can be observed in tropical regions at the edge of the full disk scan.
Cloud free vegetated land depicts in blue in the Day Microphysics RGB images.
The red colour beam (VIS0.8) is smaller compared to the blue colour contribution. The reflectivity in the VIS0.8 channel depends mainly on the sun angle.
The reflection of short wave solar radiation measured by channel IR3.9 is higher for bare soils (sandy desert) than for vegetated surfaces. Vegetated surfaces have a small albedo at 3.9 micrometer.
The intensity of the blue colour beam increases with temperature. Vegetated surfaces do not reach such high temperatures as sandy deserts do, therefore, the blue colour contribution is around average.
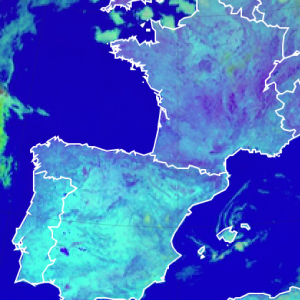
With all 3 colour beams not contributing very much over vegetated soils, the combination of them results in a darker blue, sometimes aiming into violet when the red beam contribution of channel VIS0.8 is of the same amount then IR10.8. When vegetation cover become scarse, the combined colour turns into a lighter blue (see Spain in the image below).
HRV Cloud RGB from 7 April 2015, 12:00 UTC
Explanation of the blue colour of vegetated soils in the Day Microphysics RGB (see the recipe):
• With all 3 colour beams contribution with an average value, the red and the blue colour slightly dominate. This results in a darker blue to violet colour for vegetated soils.
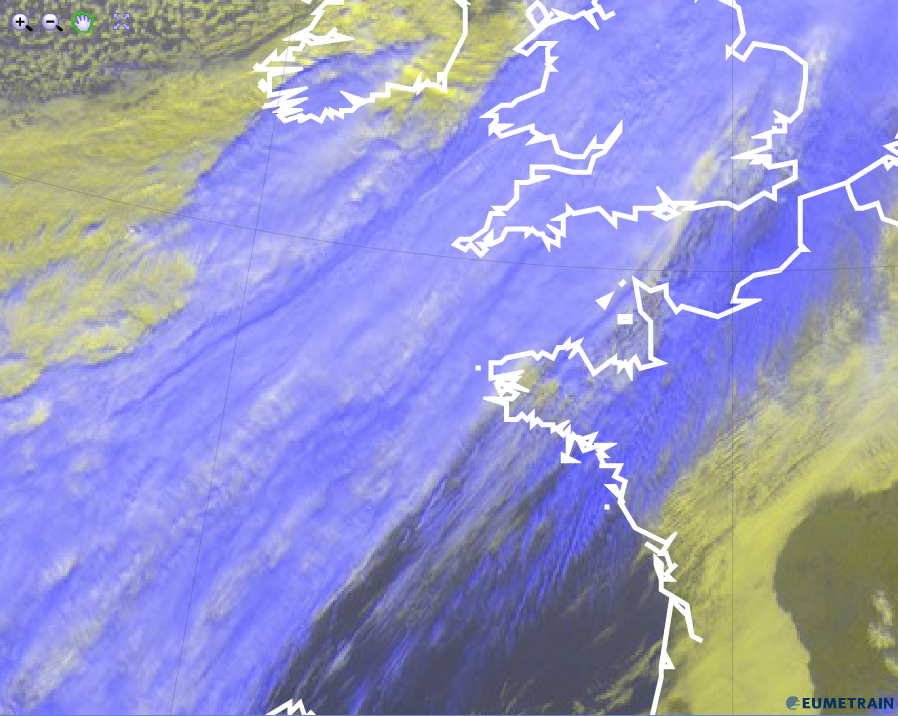
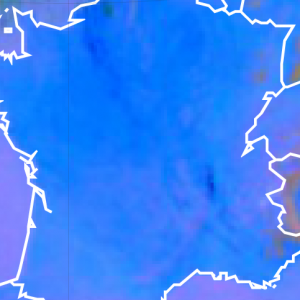
High reaching opaque clouds appear blue in the HRV Cloud RGB images.
For frontal cloudiness and other types of high reaching clouds (e.g. convective cells), the blue colour prevails. The blue is somewhat lighter than for Cirrus clouds due to the stronger reflectivity of opaque clouds for short wave radiation. Moreover, fronts are often superimposed by a Cirrus layer which makes the cloud top appear very cold.
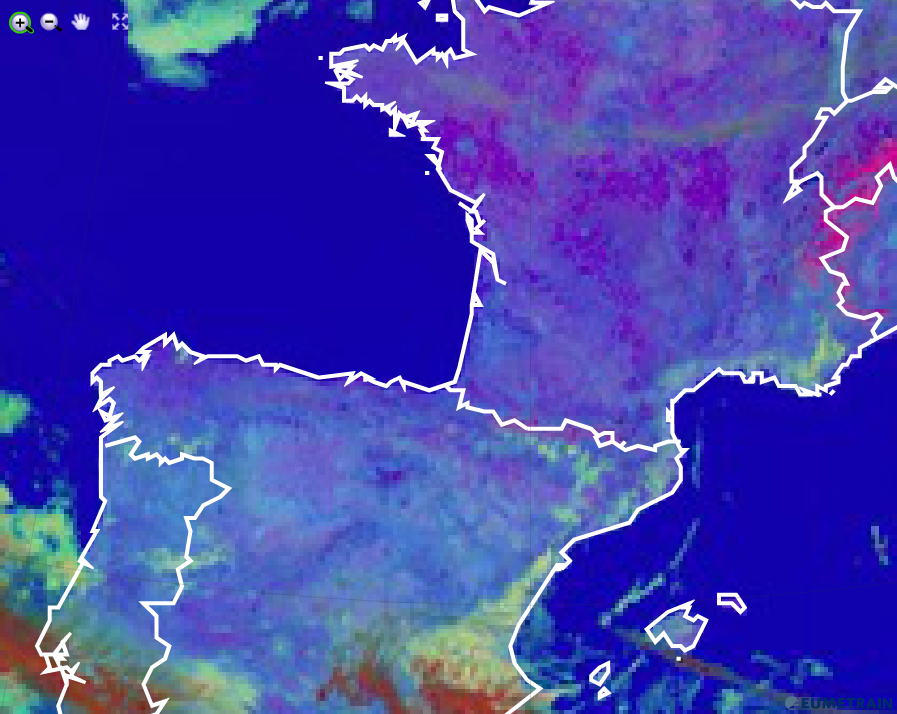
On the image below, pre-fontal Cirrus cloudiness (France and Gulf of Biscay) can be discriminated from the frontal cloud band by its darker blue in contrast to the lighter blue for the clouds within the front (England and Atlantic).
Shadows on the cloud top produced by different heights of the frontal cloudiness can result in dark blue stripes, as can be seen on the rear side of the cold front.
Depending on the thickness of the Cirrus veil above a high reaching opaque cloud, the blue colour can turn into a whitish blue when this veil is thin, and vice-versa into a darker blue when the Cirrus layer is thicker.
HRV Cloud RGB from 26 January 2016, 12:00 UTC
As can be seen in the image below, towering CBs show a lighter blue at the center and a darker blue around the cell. While the latter stems from the cirrus anvil, the former is the multi-layered cloud.
HRV Cloud RGB from 9 May 2015, 12:00 UTC
Explanation of the blue colour of high opaque clouds in the HRV Cloud RGB (see the recipe):
• Due to very cold temperatures, the blue contribution from channel IR10.8 dominates over the HRV channel contribution.
• Depending on how much Cirrus is atop of the high opaque cloud, the blue colour can vary from light blue (no Cirrus present) to darker blue (thick Cirrus layer).
Thin and cold Cirrus clouds appear blue in the HRV Cloud RGB images.
Radiation measured by the HRV channel of the SEVIRI instrument does not contribute in case of cirrus clouds because it is negligible. The contribution from visible channels is strongly related to the optical thickness of a cloud. Cirrus clouds, mainly composed of ice crystals, are more or less transparent for short wave radiation. Cirrus clouds do not reflect short wave solar radiation.
The blue colour prevails in the HRV Cloud RGB for high Cirrus clouds because these high level clouds are very cold. In contrast to short wave radiation, IR radiation from the earth is absorbed by the ice crystals.
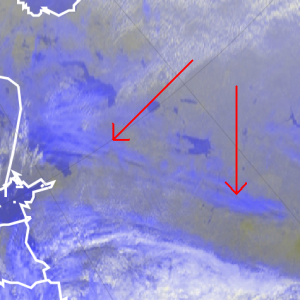
The Cirrus clouds can be found as jet cloud fibres (see left hand image, red arrows) or on top of frontal cloudiness (e.g. a warm front). The image below shows an extended warm front over eastern Europe. Atop of the warm front, cirrus cloudiness depicts in blue tones.
HRV Cloud RGB from 1 October 2014, 12:00 UTC
In case of convection, the Cirrus anvil can be clearly discriminated from the rest of the cloud cell (see image below).

HRV Cloud RGB from 9 May 2015, 12:00 UTC
Explanation of the blue colour of Cirrus clouds in the HRV Cloud RGB (see the recipe):
Only the IR10.8 micrometer channel contributes notably to the HRV Cloud RGB in case of Cirrus clouds. Thin ice crystal clouds are transparent for short wave solar radiation.
Warm cloud free land depict in a blue colour in the Dust RGB images.
The red colour beam reflects the brightness temperature difference (BTD) IR12.0 - IR10.8. The difference depends on the emissivity of the surface but also on the total water content of the troposphere. Accordingly, the BTD can vary from negative values to positive values (see recipe on the left side). The BT of channel IR12.0 is lower in regions with high humidity and the BTD more negative. The red colour contribution is stronger in case of a dry atmosphere and smaller when the atmosphere is more humid.
As the emissivity of vegetated ground is a little lower at 8.7 micrometer than at 10.8 micrometer, their BTD is small but positive. As for the green component a strong gamma correction (with 2.5 gamma) is applied, the intensity of the green signal is medium.
The warmer the surface, the stronger the blue colour contribution. On hot summer days (see image below) the blue colour contribution dominates the scenery.
The Dust RGB image below shows France on a hot summer day.
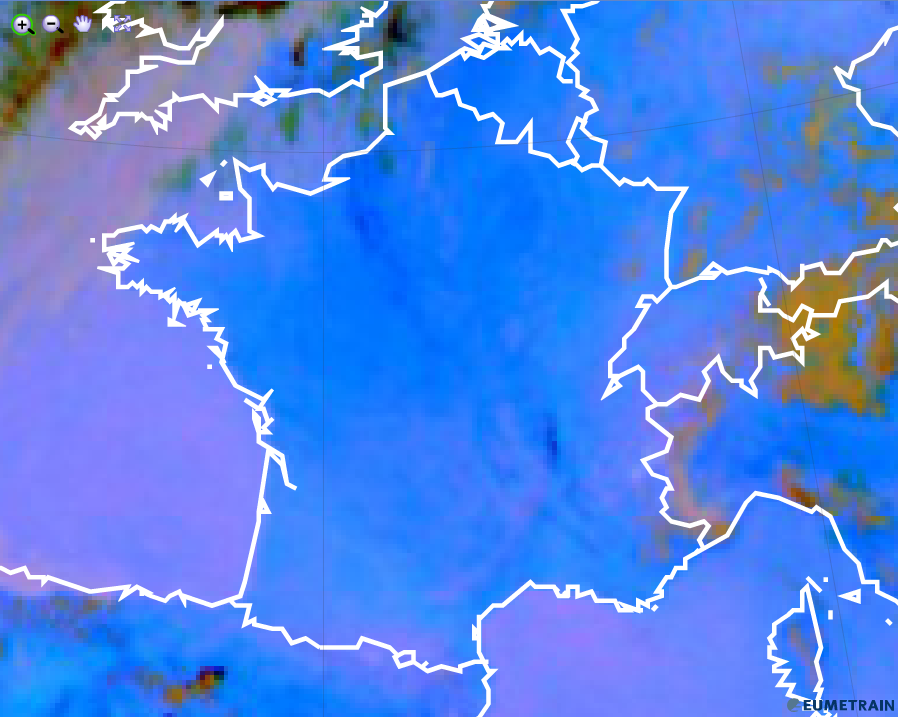
Dust RGB from 21 August 2015, 12:00 UTC
The Dust RGB below shows a dryer region over the eastern Ukraine (reddish blue) while the western part is more humid (blue). The influence of the atmospheric total water content is clearly visible in this example.
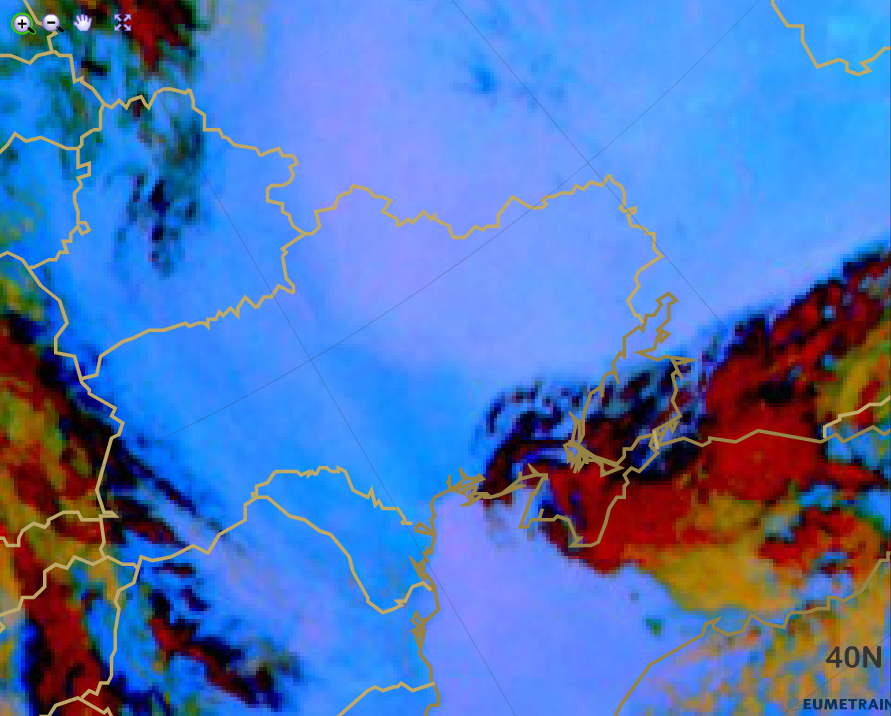
Dust RGB from 25 August 2015, 12:00 UTC
Explanation of the blue colour of warm, cloud free land in the Dust RGB (see the recipe):
In case of warm, cloud free (vegetated) land, the blue (IR10.8) colour beam contributes most (with a little bit of green), while the red contribution strongly varies. The resulting colour is either a deep blue or some kind of reddish blue depending on the surface properties.