Synoptic Situation
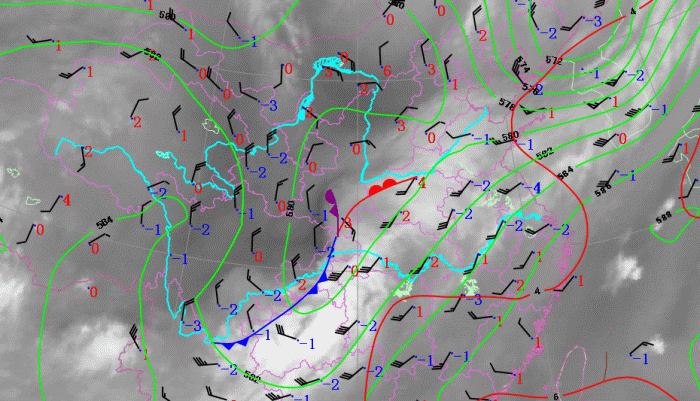
Figure 5: WV6.7 image and weather observation at 00:00(Green: height at 500hPa, Red: height at 100hPa, Wind: 500hPa, Numbers: Difference of Bright temperature at 500hPa in Last 24hs)
A south-west to north-east cloud band with shallow "S" shape were lied on the front of pressure trough on high level(500hPa). At past 24 hours, atmosphere were been cooler(blue values shown in Figure 5) on the trough rear and almost all of weather station in the south portion of cloud band (white color in WV image). On the other hand, the north portion of cloud band(light grey clouds in WV image) were lied on the north of low pressure center with warmer atmosphere(Red values). So the cloud band were consisted with a cold front and a warm front(the white cloud band on WV image were a cold front and the light grey clouds were warm front). The dark area behind of the cloud band is a occlusion with wind cyclone as figure 5 shown. At the joint of warm front and cold front, a dark strip were existed with cyclonic wind filed and weak warm air advection. So there was a younger occlusion system.
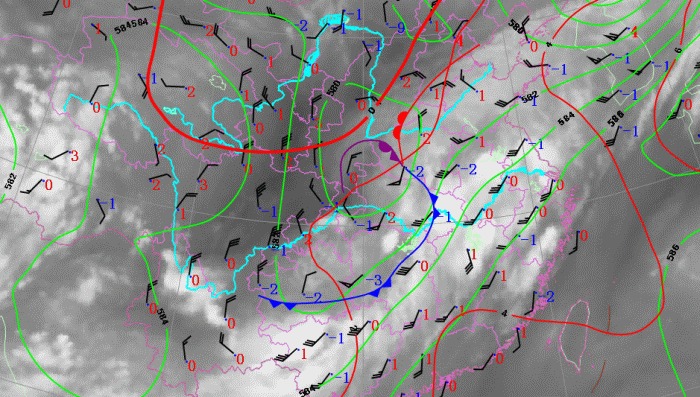
Figure 6: WV6.7 image and weather observation at 12:00(Green: height at 500hPa, Red: height at 100hPa, Wind: 500hPa, Blue Word: Difference of Bright temperature in Last 24hr)
It is shown in figure 6 than upper level winds were more strengthen than before at 12:00. The frontal system cloud band were broaden and moved to south-east with loosen structure. Low pressure system were weaken as north-east motion and the former dark strip were also weakened. But the cyclonic system were still exist with stronger wind speeds. So the occlusion system were developed. At the leading edge of frontal system cloudiness band, more convective system were occurred.
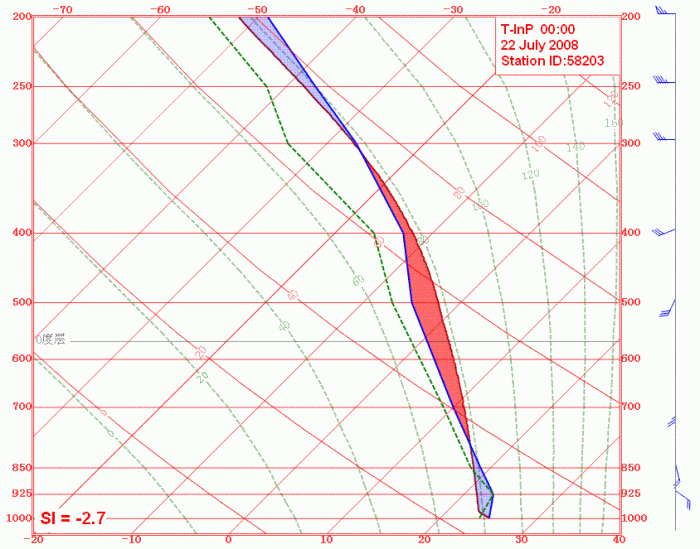
Figure 7: TlnP diagram of station 58203 in convective cloud area
As above analysis, the severe weather were convection at the leading edge of cold front with development of cyclonic system-occlusion and the atmosphere layer was unstable(Showalter Index = -2.7) in this region.