Intensification and mature stage
On the afternoon of January 17, the cyclone approached the British Isles and the exit of the jet stream. The Meteosat HRV imagery showed that there were already deeper clouds embedded in the cyclone's head and the IR10.8 μm brightness temperature of the cloud tops was decreasing (by about 10 K within 3 hours). The model outputs also indicated a strengthening of the ascending motion at mid-levels, near the cyclone's centre (Fig. 3.1).
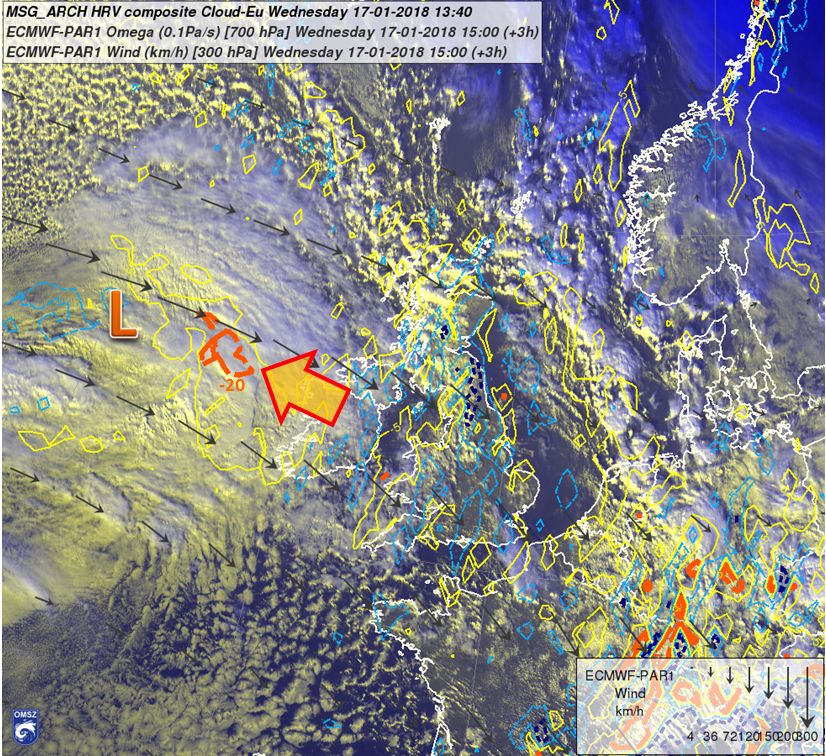
Figure 3.1: METEOSAT HRV Cloud RGB (background) on 17 January, at 13:40 UTC, and ECMWF forecast of 700 hPa vertical motion (yellow and orange lines at -5, -20, blue at 5 Pa/s), 300 hPa wind (arrow, km/h), valid for 17 January 15 UTC. The large arrow points toward the area of deep clouds below the cyclone's head, where stronger ascending motion was indicated by the model output (orange lines) and by a decrease in the IR10.8 μm brightness temperature (not shown). Note that the cloudiness of the head is not compact but sustains from several bands of clouds. The low-level cloudiness of the cold airmass on the northern flank of the head has a typical cellular (Bénard cells) structure.
The 600-925 hPa layer was relatively stable (the mean lapse rate was less steep than wet-adiabatic) but there was a conditionally unstable layer in the upper troposphere (300-600 hPa lapse rate around 7 K/km), which can induce elevated convection (i.e., starting in the mid-troposphere and triggered by large-scale upward motion). In the upper-air fields and on the Airmass RGB composite imagery (Fig. 3.2), one could clearly distinguish between the region of cold air mass with high PV (PV+) on the cyclonic side of the jet stream and warm air mass with low PV (PV-) on its anticyclonic side.
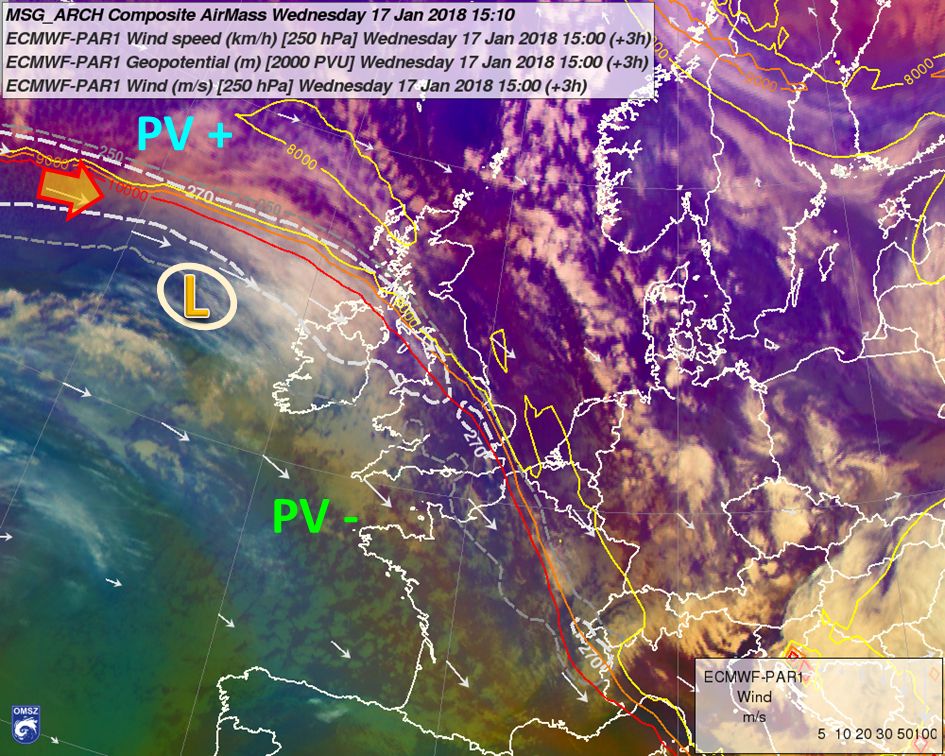
Figure 3.2: METEOSAT Airmass RGB image (background) and ECMWF forecast of 2.0 PVU (Potential Vorticity Unit) height (coloured, solid lines, m), 250 hPa wind speed (dashed lines at 250 and 270 km/h) and wind (arrows, m/s), valid for 17 January 15 UTC. The large arrow indicates the position of the jet streak (maximum wind speed in the upper-air jet). The 2.0 PVU height lines (solid coloured lines, m) mark the folding of the tropopause and distinguish between the regions of cold air mass with high PV (PV+) and warm air mass with low PV (PV-) at upper levels. The cold air mass is bluish in the Airmass RGB, while the warm air mass seems rather to be greenish. The centre of the surface low (marked by the letter L) was just south of an upper-air wave, which started to form on the boundary between the two air masses.
An important signature for cyclogenesis was that the jet axis moved southward and became closer and closer to the surface cyclone. This approach was accompanied by a steeper decrease in mean sea level pressure in the cyclone's centre (Fig. 3.3). The upper-air (300 hPa) cyclonic vorticity advection (CVA) also intensified as the cyclone moved from the right entrance of the jet streak toward its left exit and, shortly after 18 January 00 UTC, reached its maximum (not shown, personal communication with Ab Maas, former forecaster at KNMI).
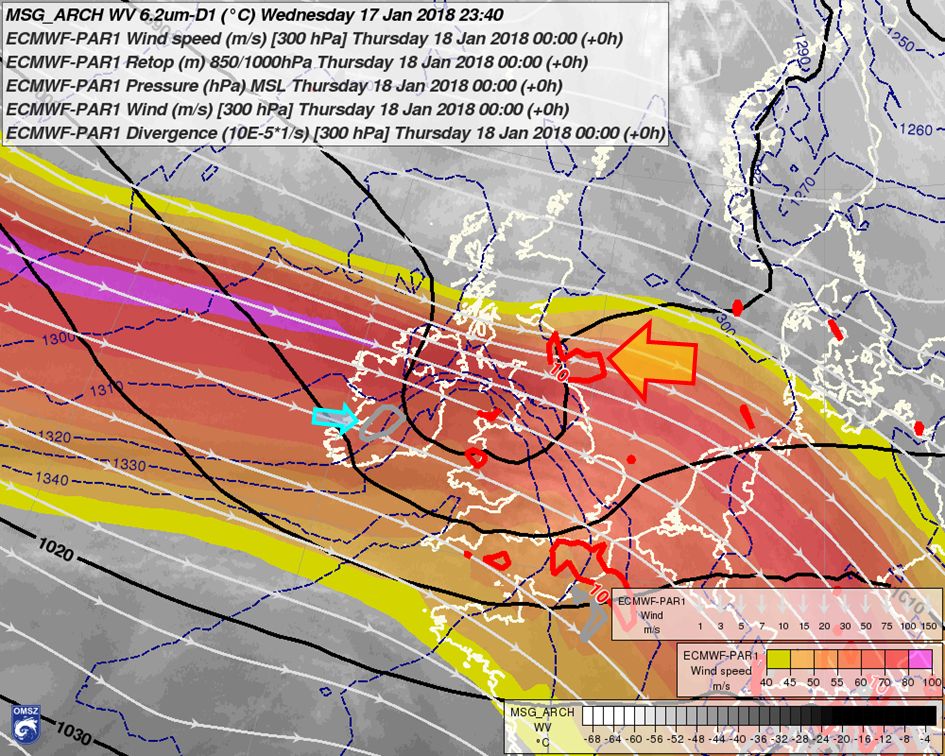
Figure 3.3: As in Fig. 2.9 but valid for 18 January 2018 00 UTC, when the upper-air jet approached the surface cyclone. Upper-air divergence could be found at the front of the cyclone (large arrow), while convergence (grey -10 x10-5 1/s isoline) was found at its rear. Note that the structure of the relative topography (RT) lines became different in comparison with Fig. 2.9, which is valid for a time 12 h earlier. Near the cyclone centre, their orientation changed to a more meridional direction and the RT gradients became weaker on the cold part of the frontal wave due to frontolytic effects. The low-level potential temperature gradients (see Fig. 3.8) vanished in the region with convergent upper-air flow as well.
On January 18, a wave developed on the upper-air PV field (Fig. 3.4). This wave could be clearly identified also on vertical cross-sections through the centre of the cyclone (Fig. 3.5).
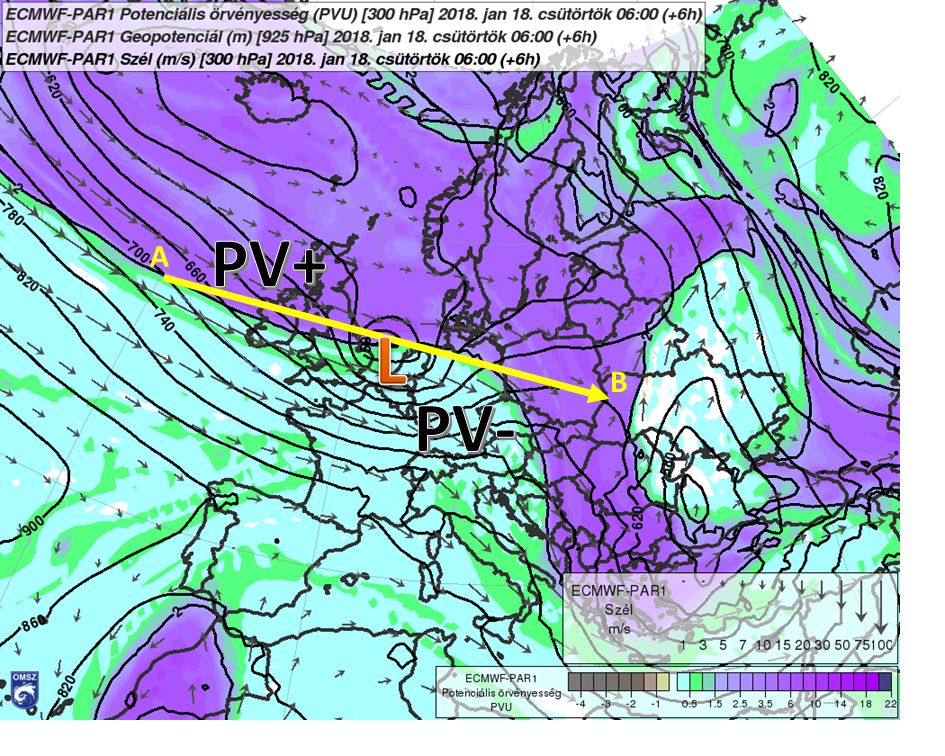
Figure 3.4: ECMWF forecast of 300 hPa potential vorticity (PVU, colour shades), wind (arrows, m/s) and 925 hPa geopotential height (lines, gpm), valid for 18 January 2018 06 UTC (+6h forecast). The lilac colour indicates the high PV in the stratosphere, while the tropospheric low-PV airmass is in light bluish or greenish colours. An upper-air wave started to develop around the cyclone, where the positive (PV+) anomaly extended southward, while the negative (PV-) anomaly extended northward. The A-B line shows the position of the cross-section in Fig. 3.5.
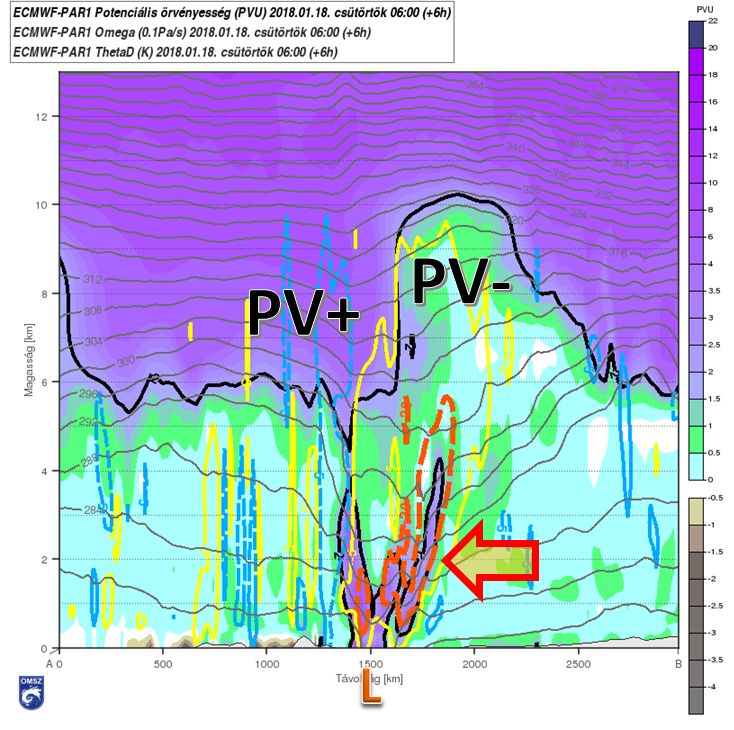
Figure 3.5: Vertical cross-section through the ECMWF potential vorticity (PVU, colour shades), potential temperature (grey lines every 4 K), vertical motion (yellow and orange lines at -5, -20, blue at 5 Pa/s), valid for 18 January 2018 06 UTC (+6h forecast). There was strong ascending motion at the front of the positive PV anomaly (large arrow). In adiabatic flow, PV is conserved, and its local changes are due to advection, which is mainly observed at high tropospheric levels and in the stratosphere. The increase in PV (over 2 PVU) at low levels, visible in this cross-section, was not related to upper-air anomalies and indicated non-adiabatic processes (e.g. latent heat release).
Upward vertical motion (slanted eastward) occurred ahead of and beneath the PV+ anomaly. At low and mid-levels, there were also PV anomalies indicating diabatic processes (possibly due to latent heat release and friction). The deepening of the upper-air wave, close to the jet exit, and strongly divergent flow accompanied by strengthening upward motion, could explain the rapid deepening of the surface cyclone (by approximately 1 hPa each hour). Such rapid deepening is often attributed to baroclinic instability, which is usually explained by an upper-air PV anomaly approaching a surface baroclinic wave (Fig. 3.6).
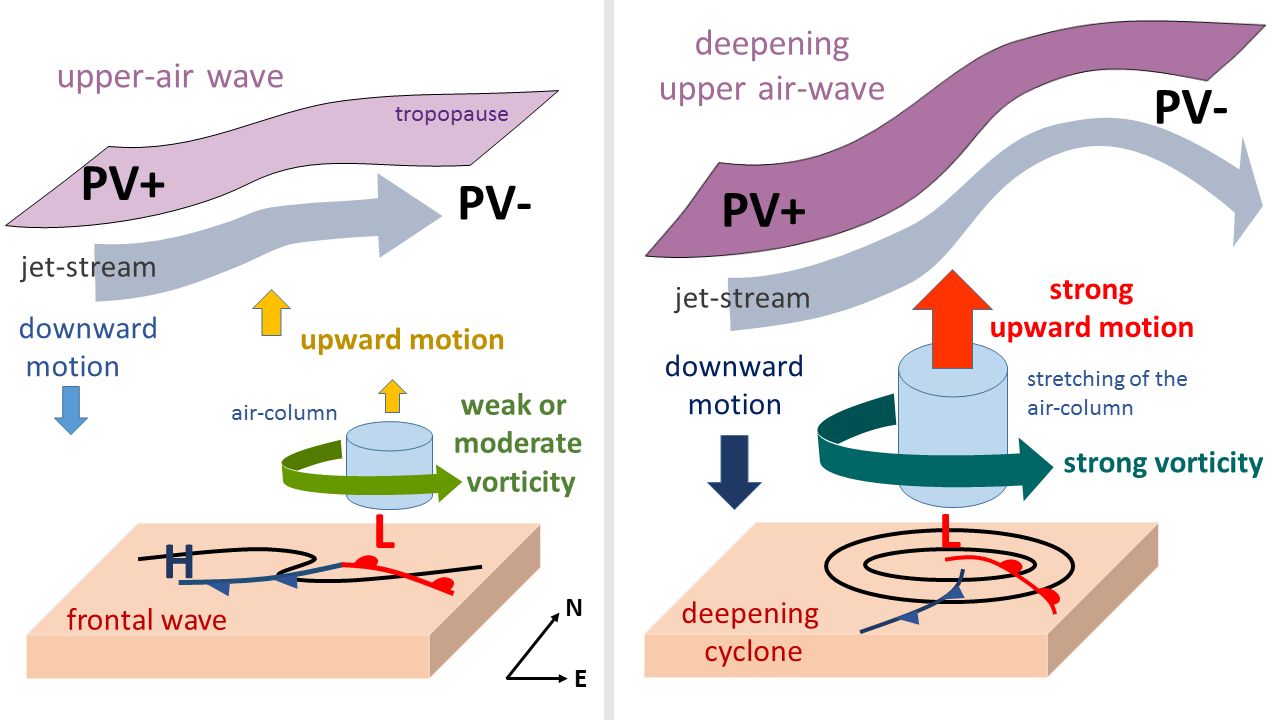
Figure 3.6: Schematic depiction of cyclogenesis due to an upper-air PV anomaly approaching a surface baroclinic wave (after Hoskins et al., 1985, adapted for the presented case). The approach of the jet stream and upper-air anomaly causes stretching of the air column between two isentropic levels (and ascending motion). Potential vorticity conservation (considering adiabatic processes) would require an increase in vorticity in response to the decrease in static stability. Using another approach, a decrease in geopotential height due to an increase in vertical velocity aloft can be derived from the geopotential height tendency equation.
Another remarkable aspect of this phase of the cyclone evolution was that, besides intensification of the ascending motion, the descending motion also intensified and the cross-isobaric storm-relative wind component became even better defined (Fig. 3.7).
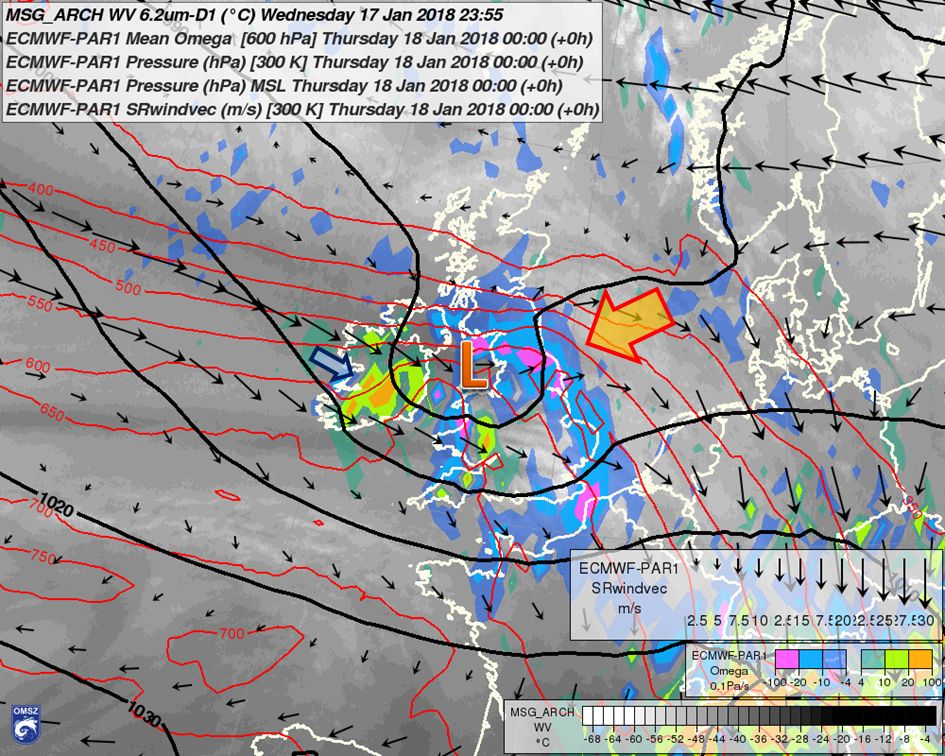
Figure 3.7: As in Fig. 2.6b, but for 18 January 2018 00 UTC. Note the increase in both ascending (large arrow) and descending (small arrow) vertical motion and the better-defined cross-isobaric component of the 300 K storm-relative wind.
The jet streak was directly over the cyclone's centre, and the upper-air flow was convergent at the rear and divergent at the front of the cyclone. The downward motion below the convergent part of the jet usually has a frontolytic effect (Schultz et al., 1998), which could be recognized in the potential temperature field (Fig. 3.8), close to the occlusion point, in the cold-frontal area.
As previously mentioned, it is interesting also to look at the cyclonic vorticity advection (CVA) at the maximum-wind height (about 300 hPa), in combination with the surface low. While the low moved over the Atlantic toward the North Sea, the centre moved from the right entrance of the jet streak toward the left exit. At the time when the low arrived at the left exit, somewhere between 00 UTC and 03 UTC on the 18th, the 300 hPa CVA ahead of the low was at its maximum, as was the intensification of the low.
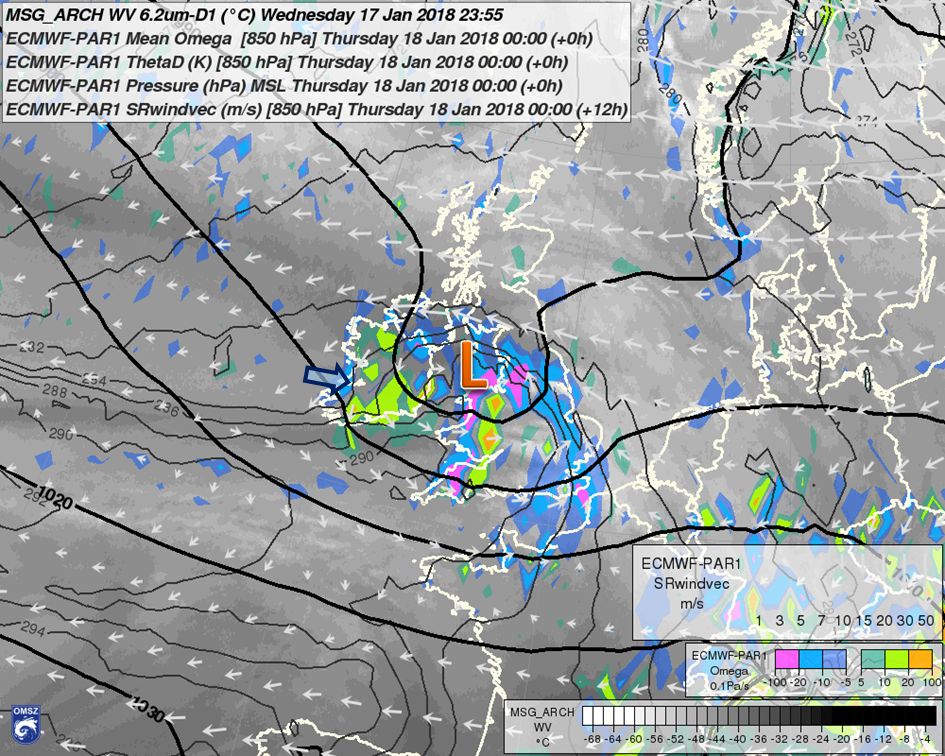
Figure 3.8: METEOSAT WV6.2 image (background), ECMWF mean vertical motion (Omega at 800, 850 and 900 hPa, colour shades, Pa/s), 850 hPa potential temperature Theta (thin lines, every 2 K), mean sea level pressure (thick black lines, hPa), surface cyclone-relative wind at 850 hPa (arrows, m/s), valid for 18 January 2018 00 UTC (analysis). The small arrow points toward a region of strong downward motion at mid-levels, where the 850 hPa temperature gradient vanished. This is a typical feature of the Shapiro-Keyser (1990) cyclone model. There was convergence in the upper-air levels (refer to Fig. 3.3).
Due to above-mentioned frontolysis, the cyclone resembled the Shapiro-Keyser (1990) model with the cold front detached from the warm front and an occlusion (Fig. 3.9).
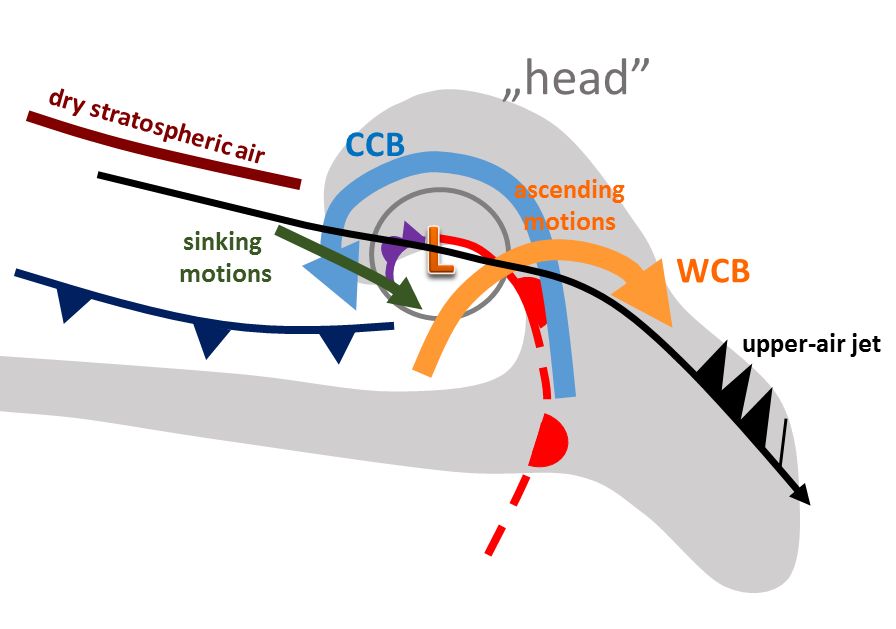
Figure 3.9: A schematic depiction of airflows and belts during the mature stage of the cyclone around 18 January 2018 00 UTC and subsequent hours. The meanings of the abbreviations are the same as in Fig. 2.10b. Note the cold front detached from the system as in the Shapiro-Keyser cyclone model. The occlusion is depicted as a cold front in some conceptual models (pointing toward the cyclone's centre).
It is often expected that cyclones with this structure are more likely to produce severe weather than in the case of the classic Norwegian model. On the morning of 18 January, the cyclone was in its mature stage and a slot of dry air close to its centre was easily recognizable on the Airmass RGB satellite images (Fig. 3.10).
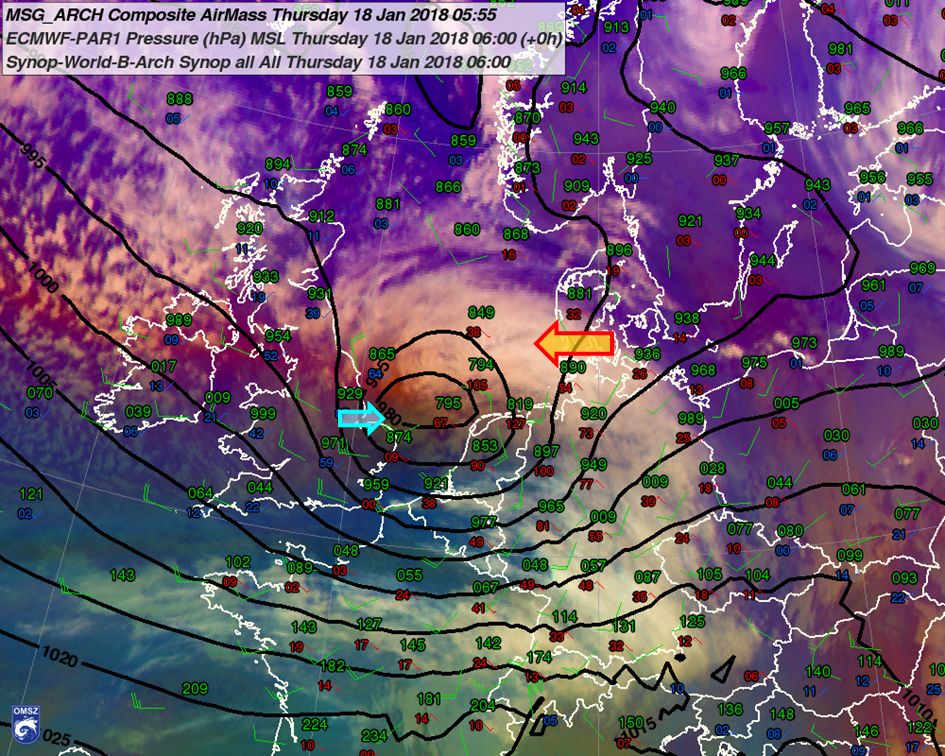
Figure 3.10: METEOSAT Airmass RGB image (background), ECMWF analysis of mean sea level (MSL) pressure (solid lines) and records of surface meteorological stations (MSL pressure with tenths of hPa precision, pressure tendency in tenths of hPa/3h, wind barbs m/s), valid for 18 January 06 UTC. The cyclone was in its mature stage, after rapid deepening (the MSL pressure was 978 hPa in the centre at this time; it dropped approximately 1 hPa every hour). The cyclone's head (marked by the large arrow) had the shape of a large comma. Dry upper air (in reddish colour in the RGB image, emphasized by the small arrow) penetrated the centre of the cyclone just north of the upper-air jet axis. Note also a belt of dry area over the western part of the English Channel and northern France, over the cyclone's cold front.
This dry air slot was related to airflow in the upper-air PV anomaly, already in the stratosphere (7-9 km height, not shown), on the cyclonic side of the jet. However, very dry air was already present at mid-levels as well, at 2-5 km height, south of the cyclone's centre, which had developed earlier and independently from the PV anomaly (remember the dry slot described in the previous section and depicted on vertical cross-sections in Fig. 2.8). Its presence could also explain why there was mostly only shallow cloudiness in the warm sector of the cyclone and in its cold-frontal region.