Development of Oclusion - like cloud features
During the periods discussed so far, there was rather persistant upper level trough with cold air features developing. During the period discussed in this chapter there exists an occlusion-like cloud spiral in the area of the Alps widening to the NE to Romania and Poland. Although during this phase the upper level trough is cut-off, a rather extended low pressure centre with several sub centres develops over central Europe. This is a transition phase before an even deeper and much more compact cut-off low develops over central Europe which is discussed in the following two chapters.
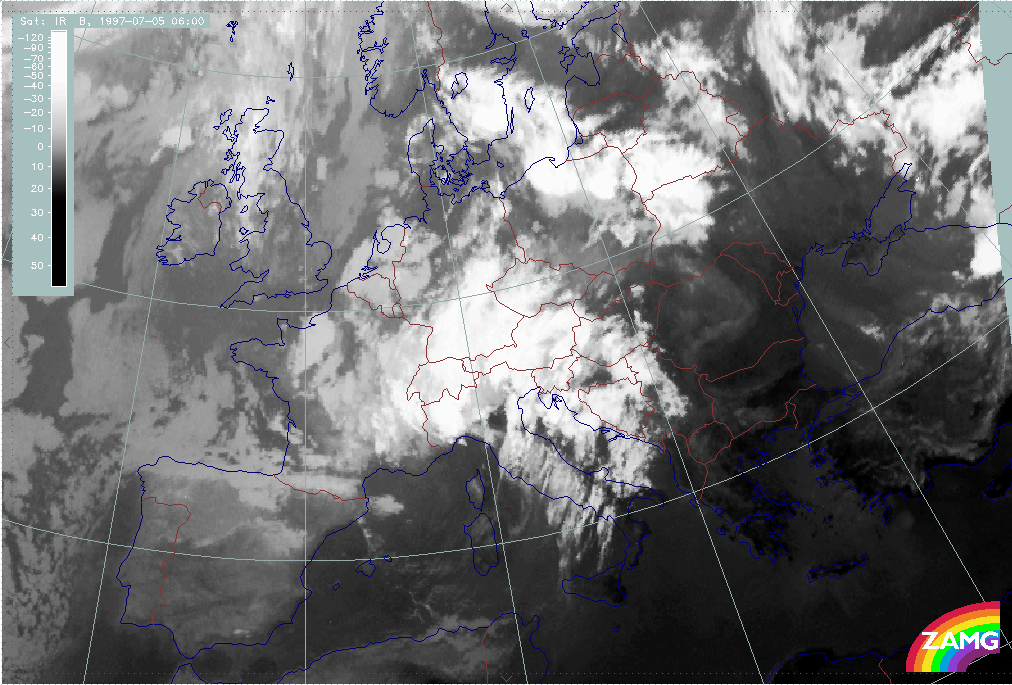
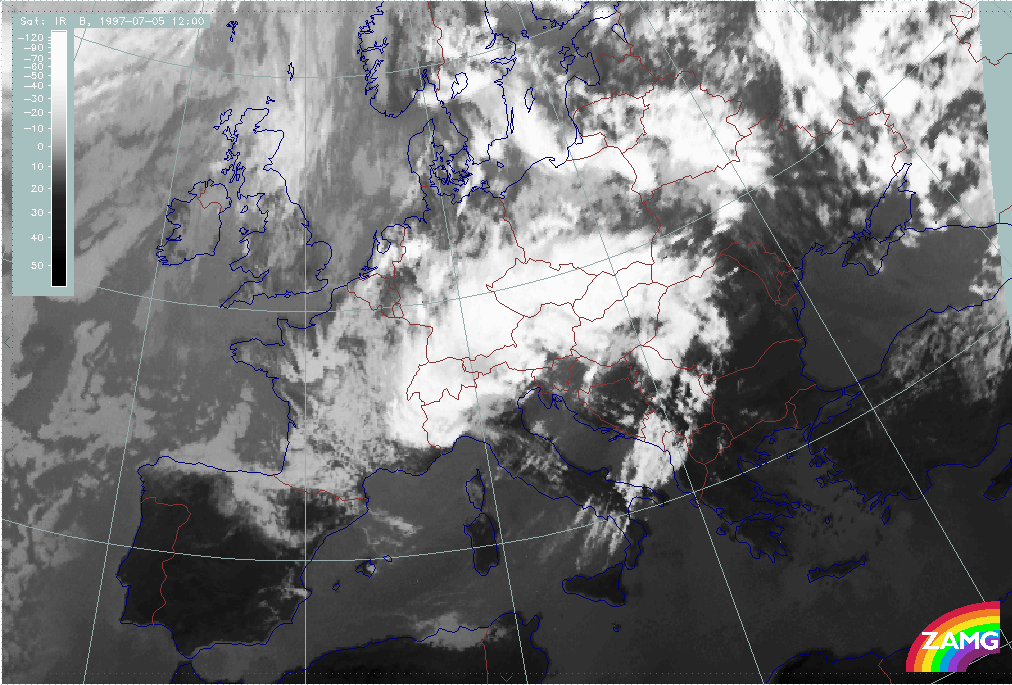
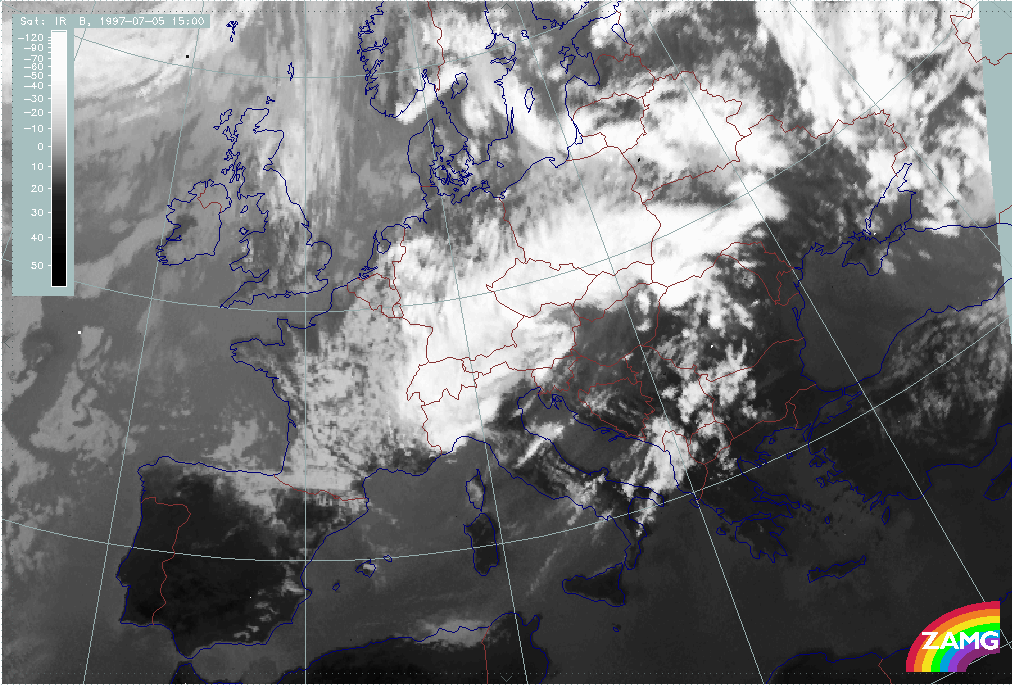
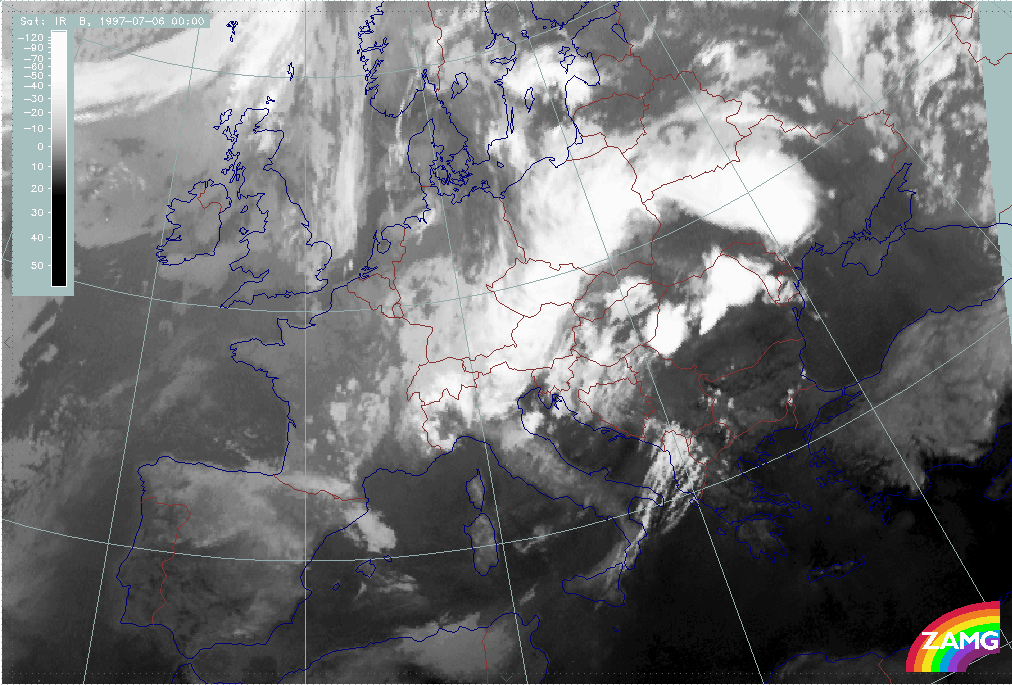
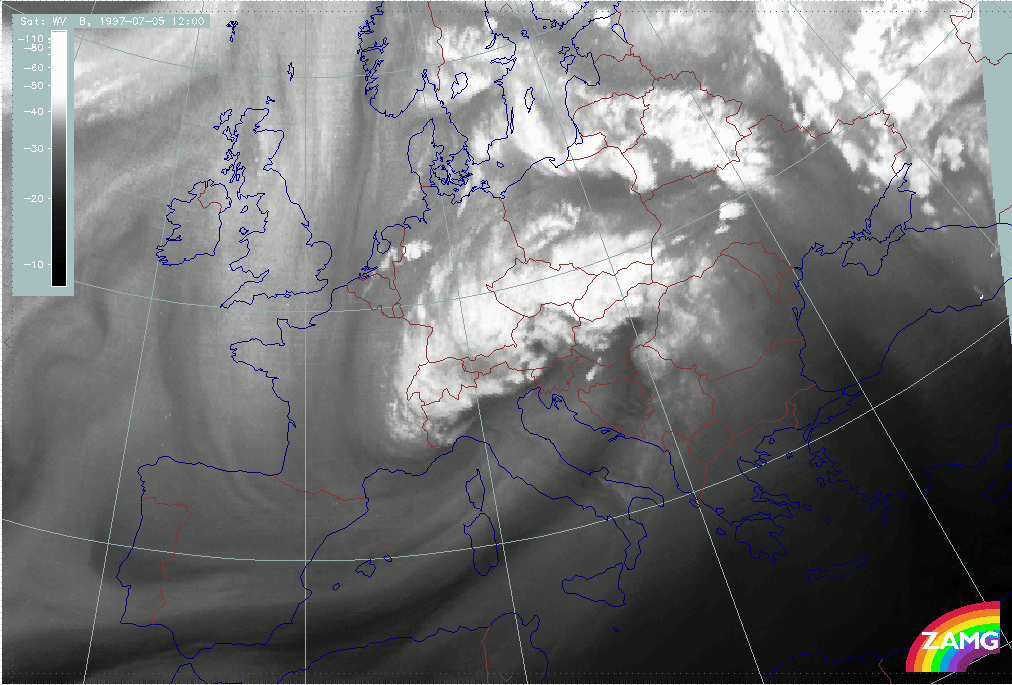
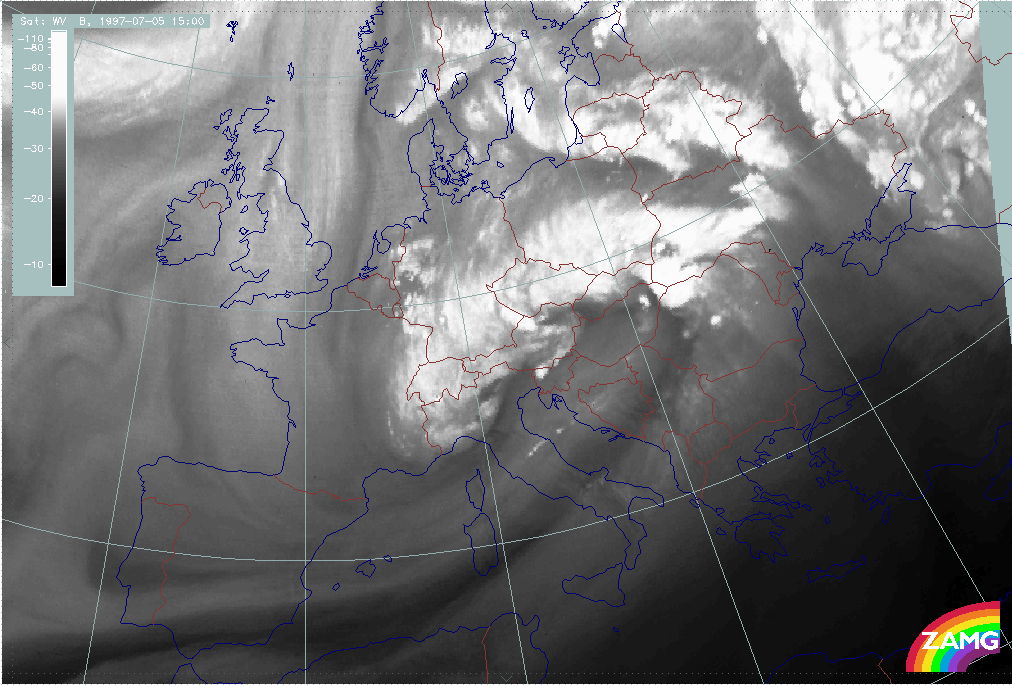
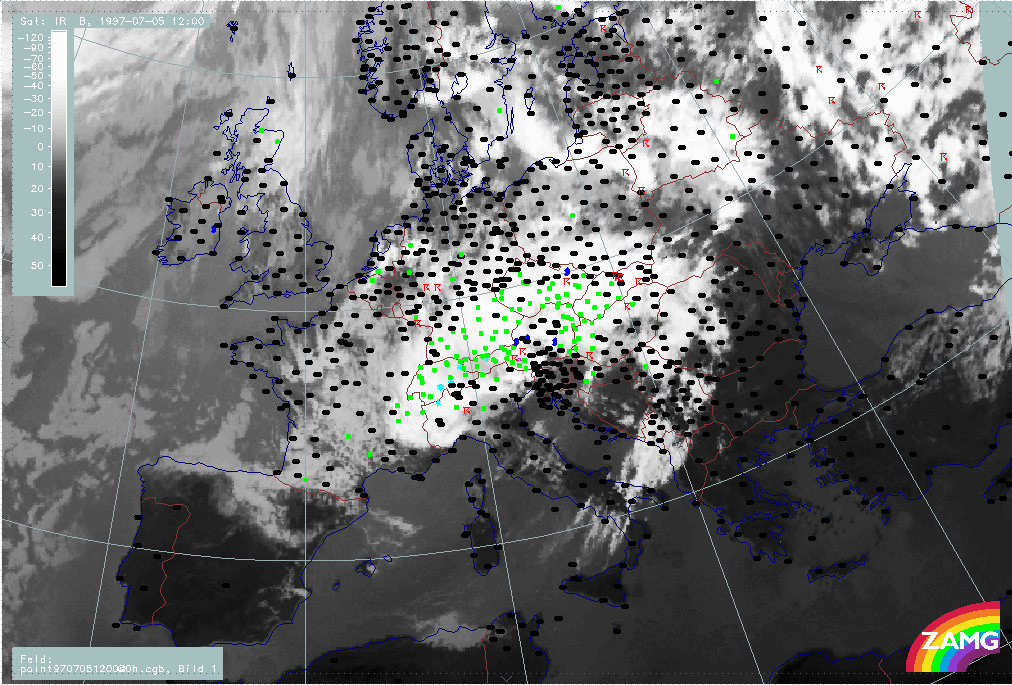
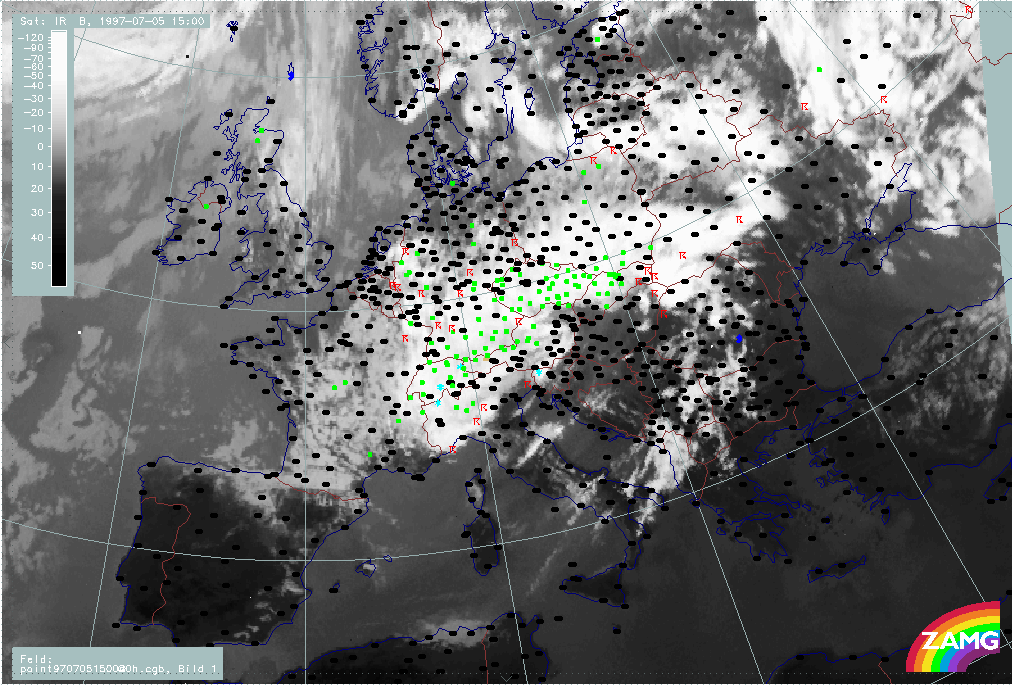
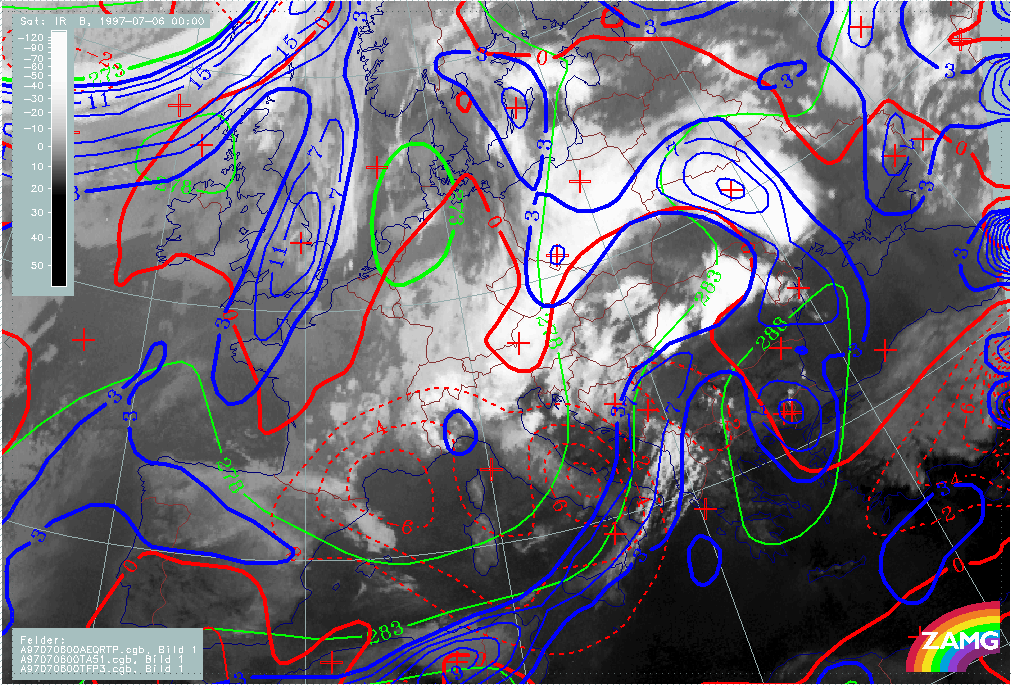
The 3-hourly sequence of IR images shows some separate phases. During the period 05 July/06.00 till 05 July/18.00 UTC an Occlusion - like spiral propagates more and more to the East (Romania) and from there to the North (White Russia and Poland). From the very beginning there is the impression of two circulation centres within this spiral, dividing the cloud band into an eastern part which is more connected to the former frontal cloud band and moves across Balkan Peninsula to Poland, and a western part, which has developed directly from the cold air features and moves from E. France and Switzerland across Austria.
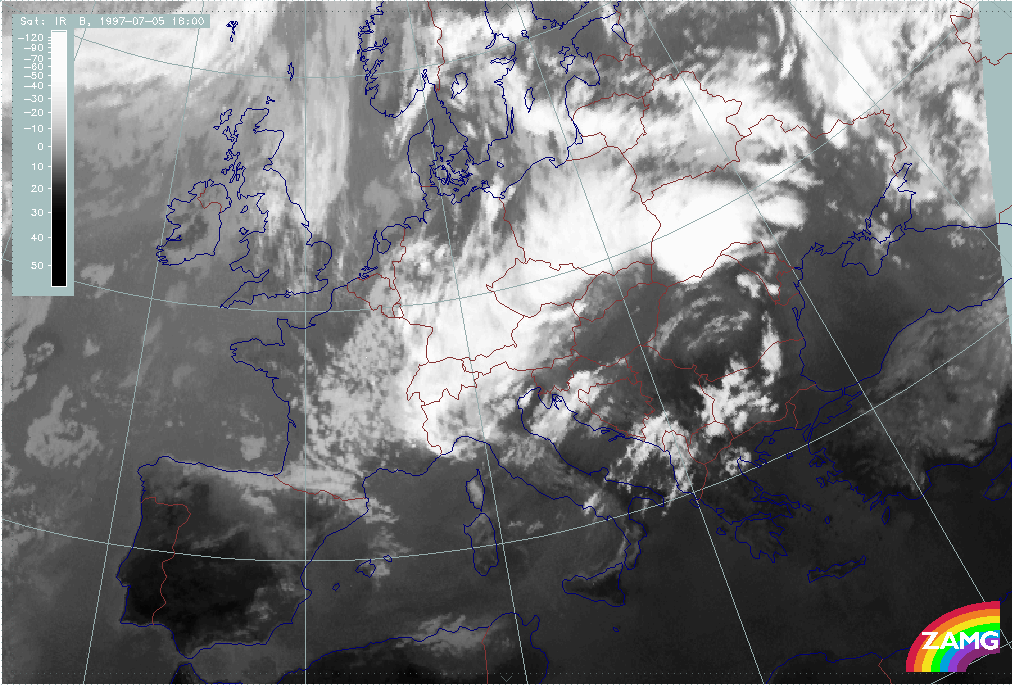
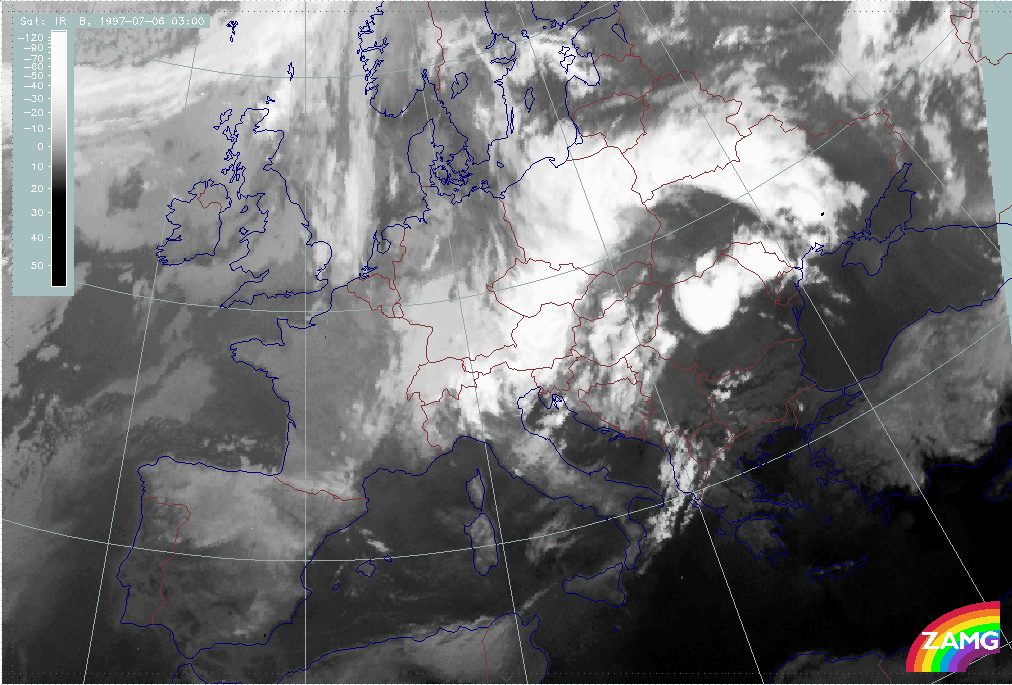
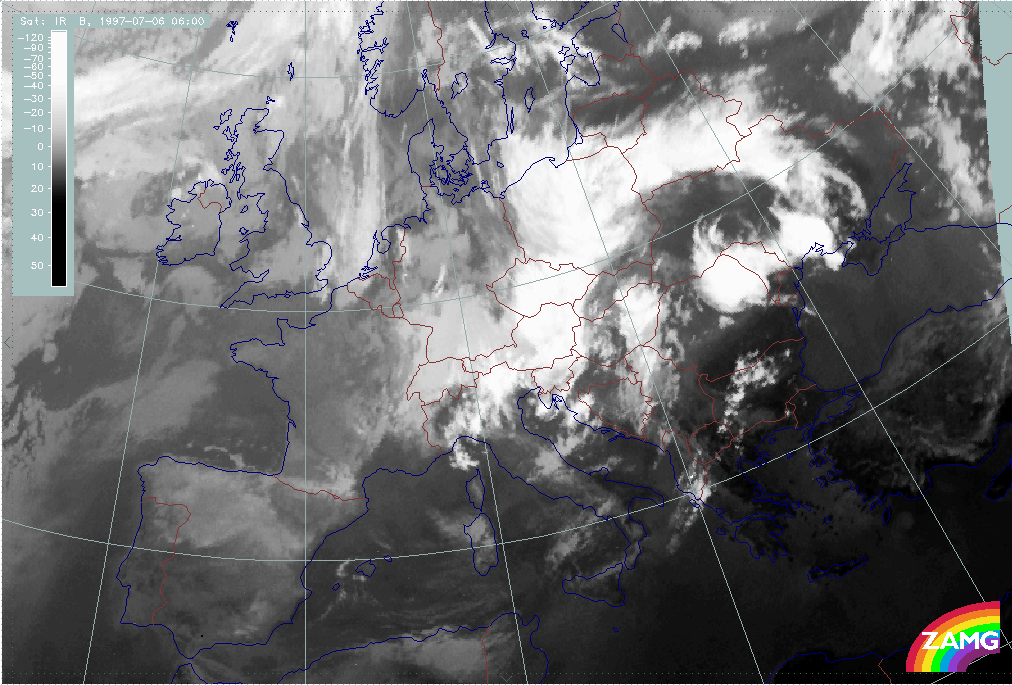
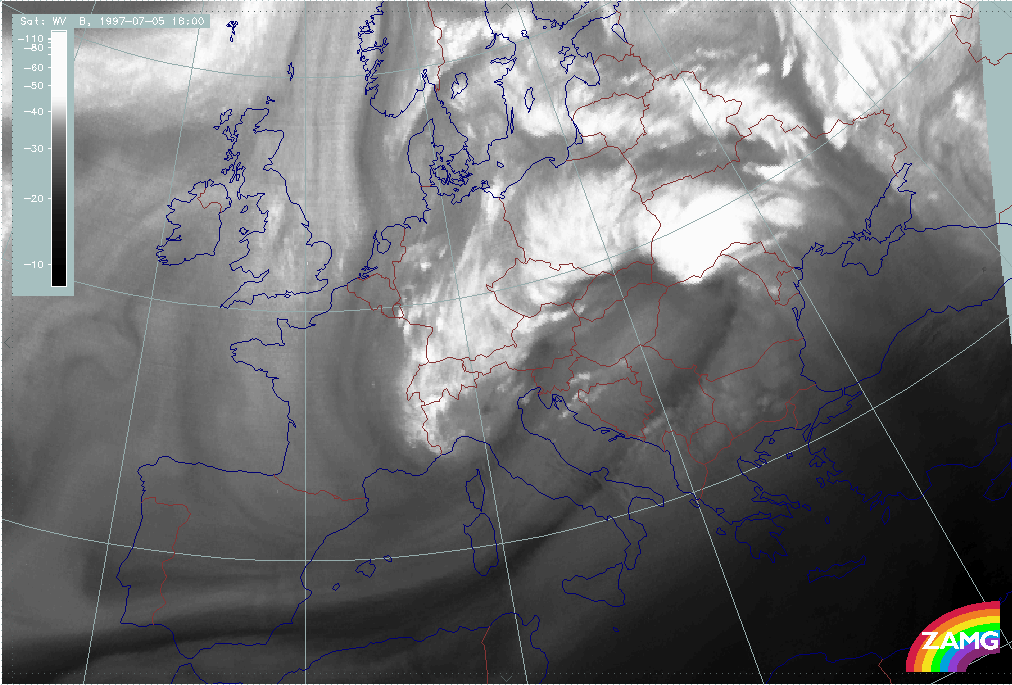
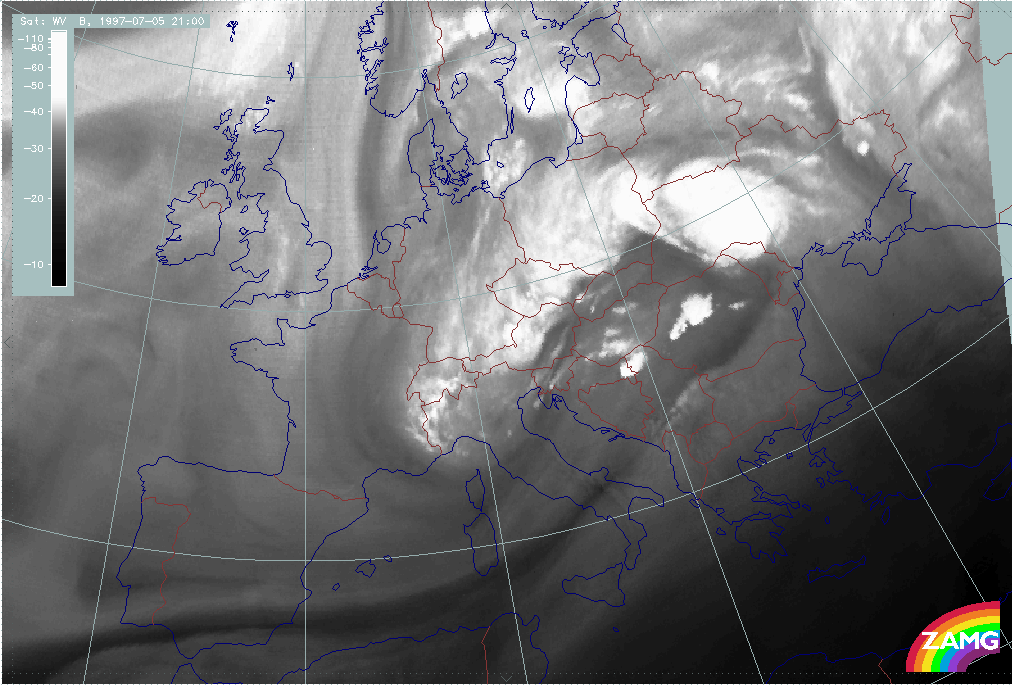
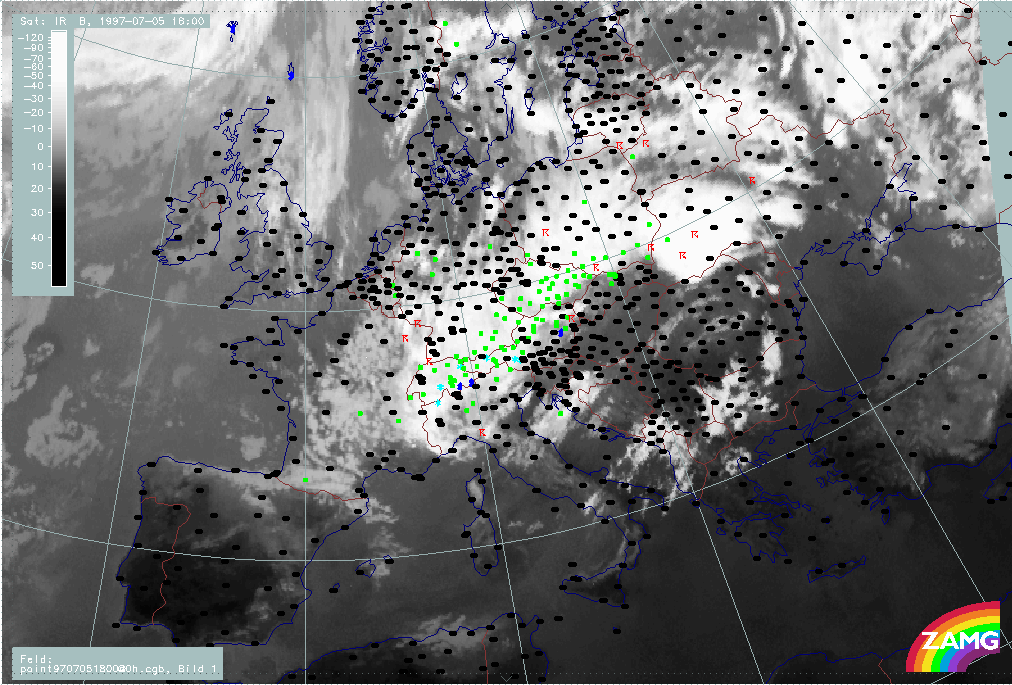
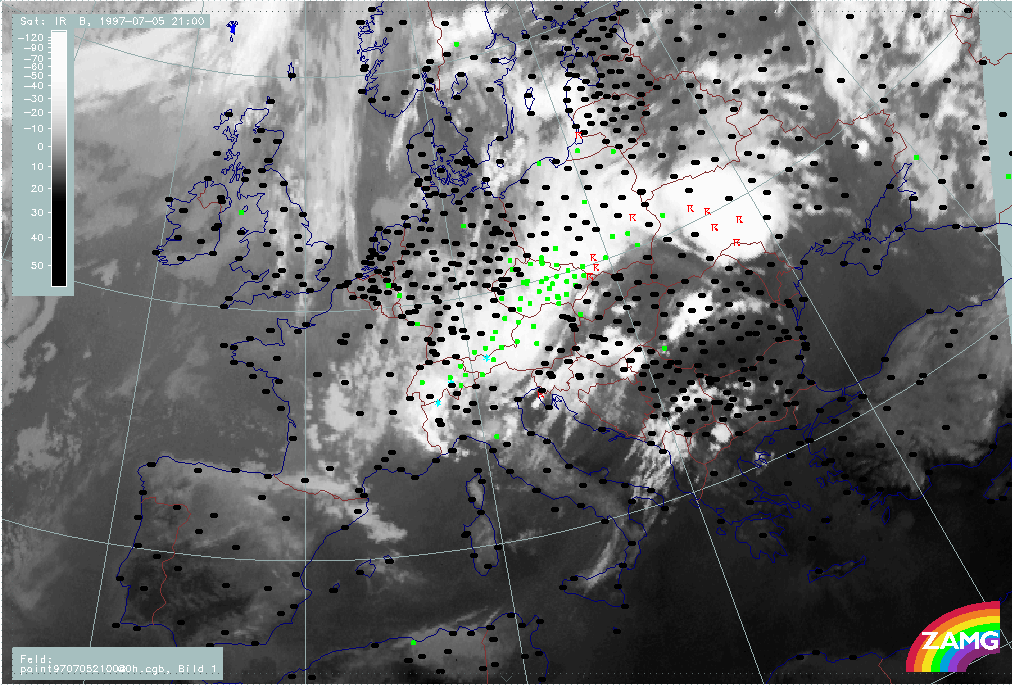
From 05 July/18.00 UTC until the end of this period at 06 July/06.00 UTC, the Occlusion - like cloud band does not change dramatically but only widens and propagates. The most important changes and new developments take place to the south and east, namely intensive convective developments in the eastern part and the development of a cloudy area to the E of the western part of the Occlusion band, namely, over the northern Adriatic Sea moving from there on across the northern Balkan Peninsula. The latter development is very dramatic and represents a cut off process which is described in detail in the next chapter.
|
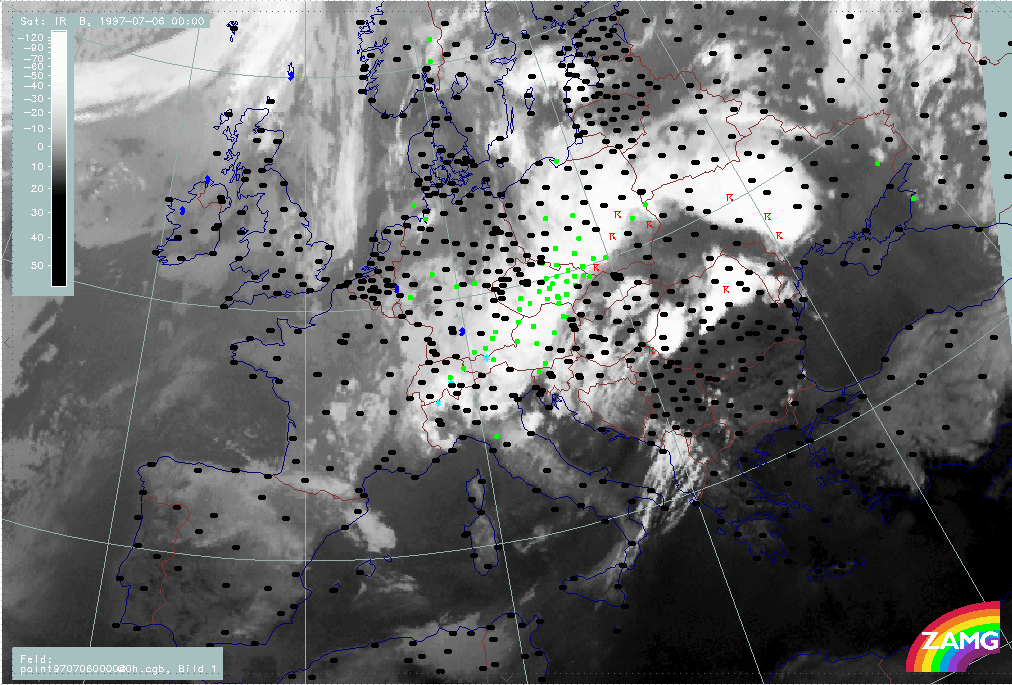
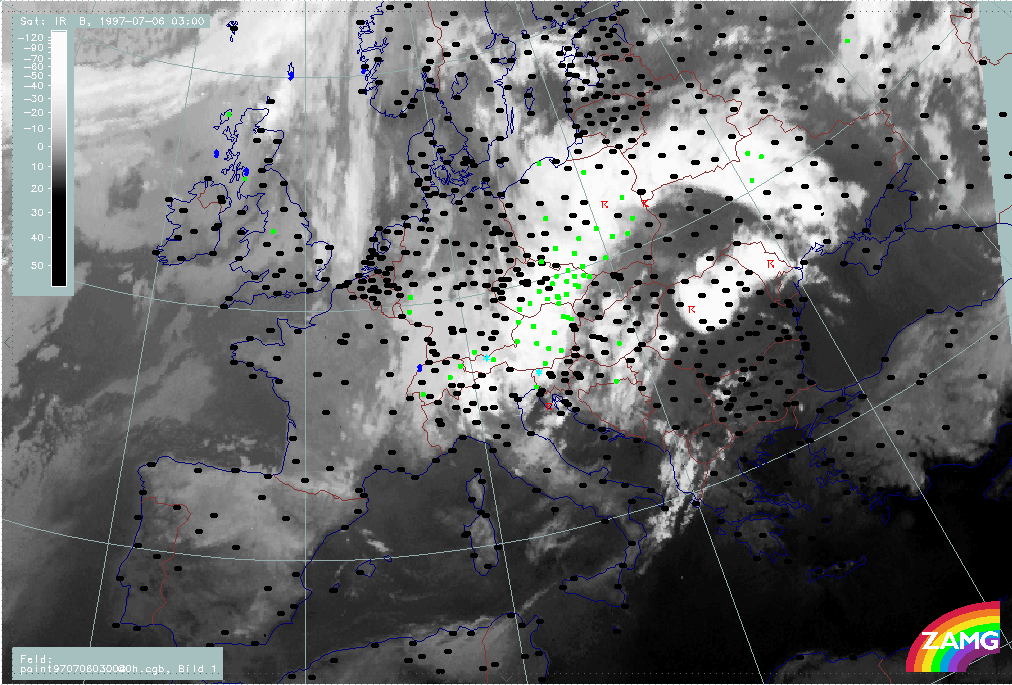
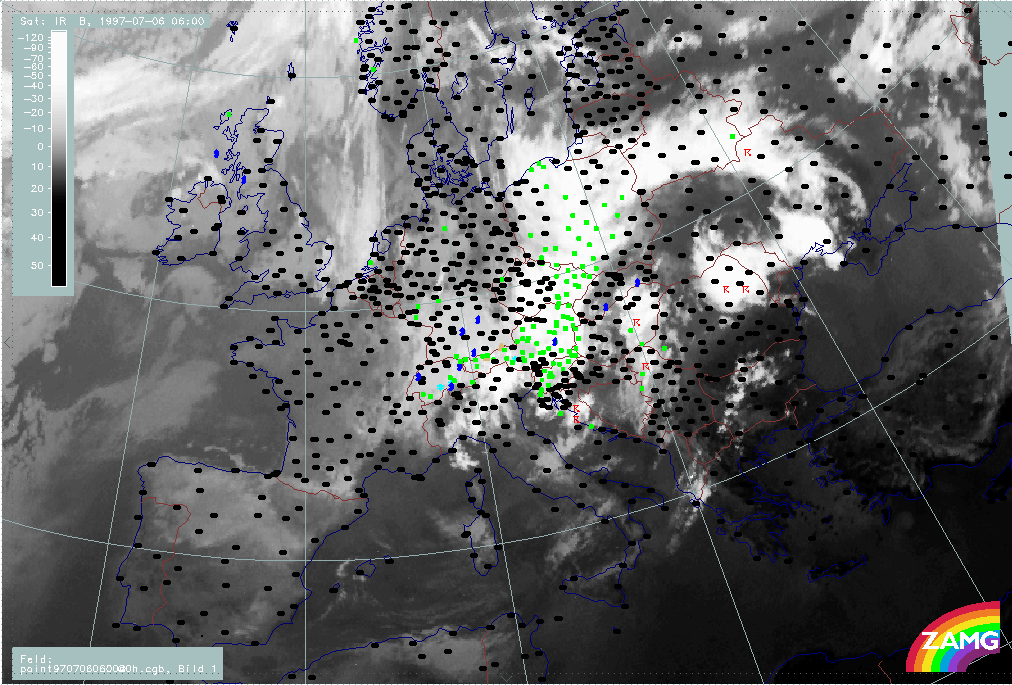
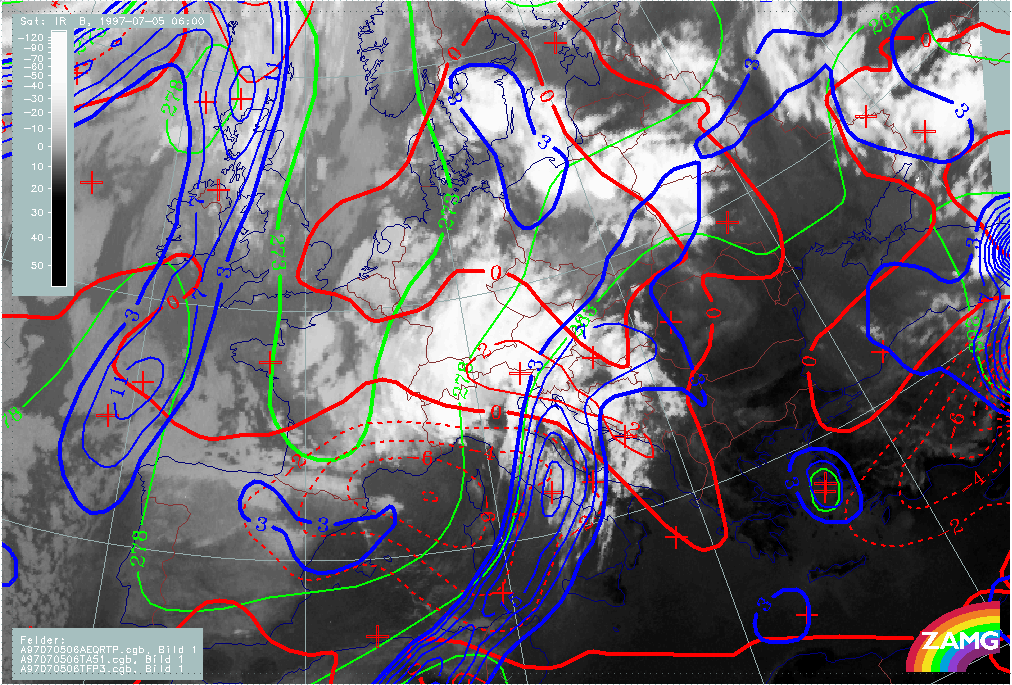
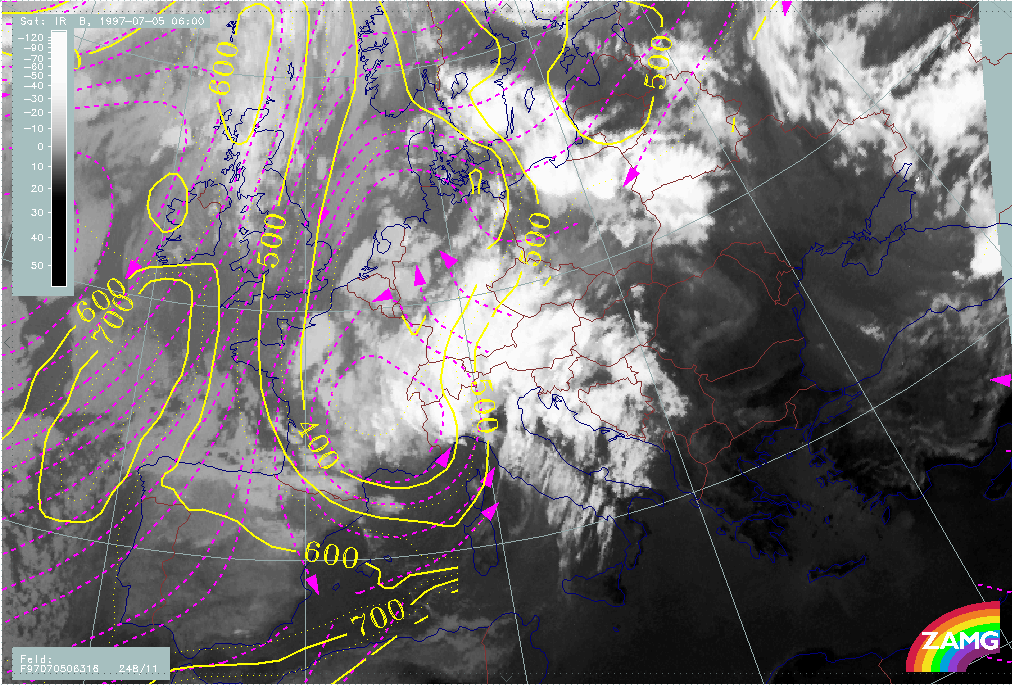
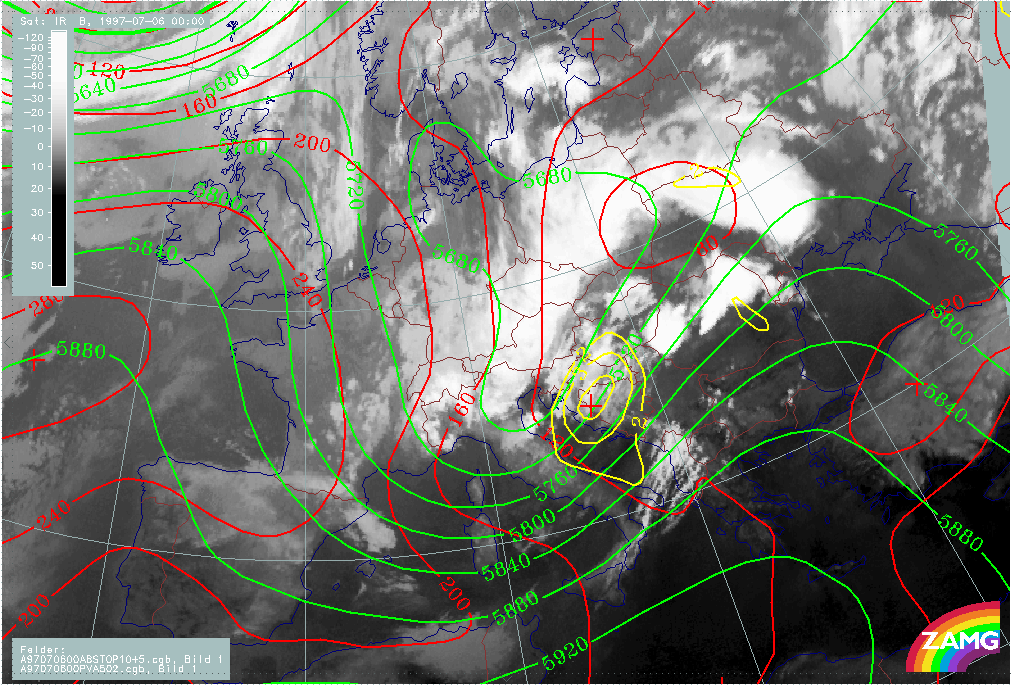
05 July 1997/06.00 UTC - Meteosat IR image; 05/06.00 - 06/06.00 UTC 3-hourly image loop
|
|
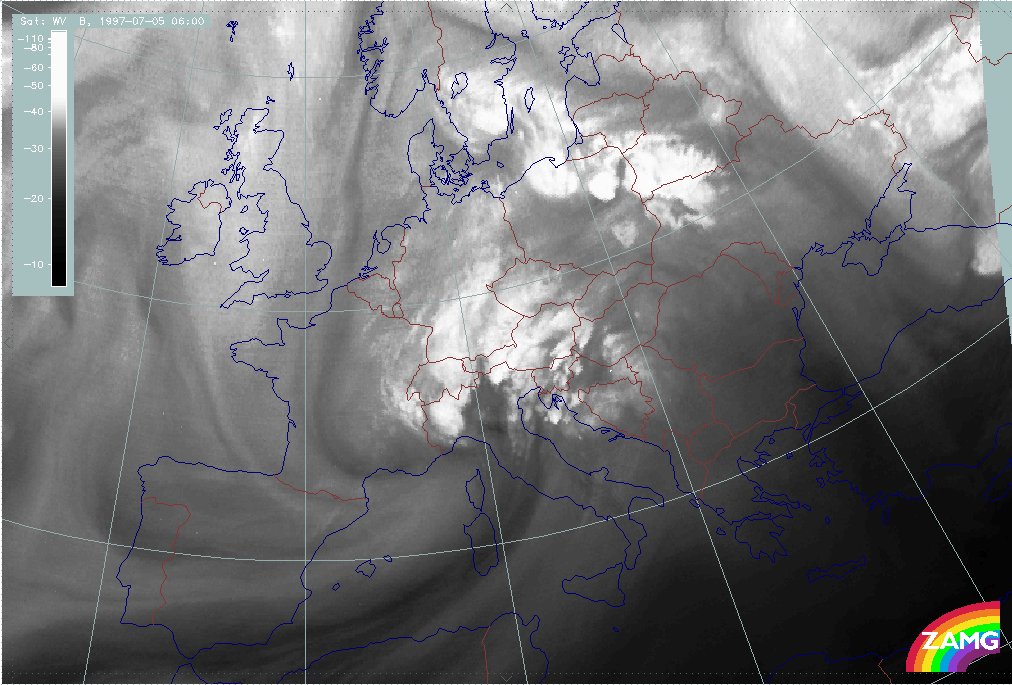
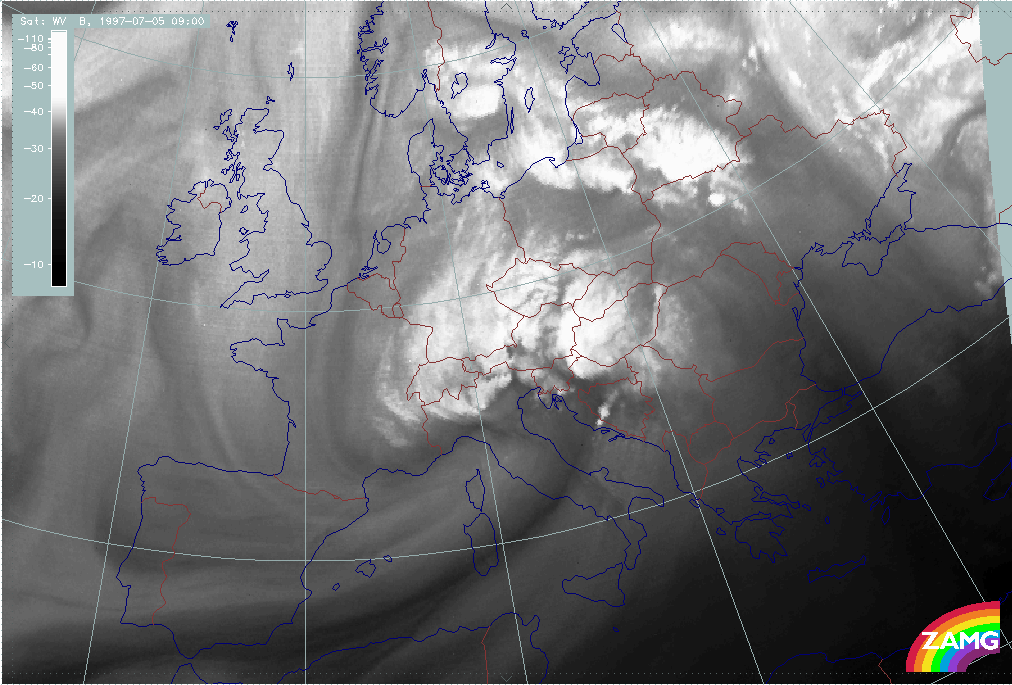
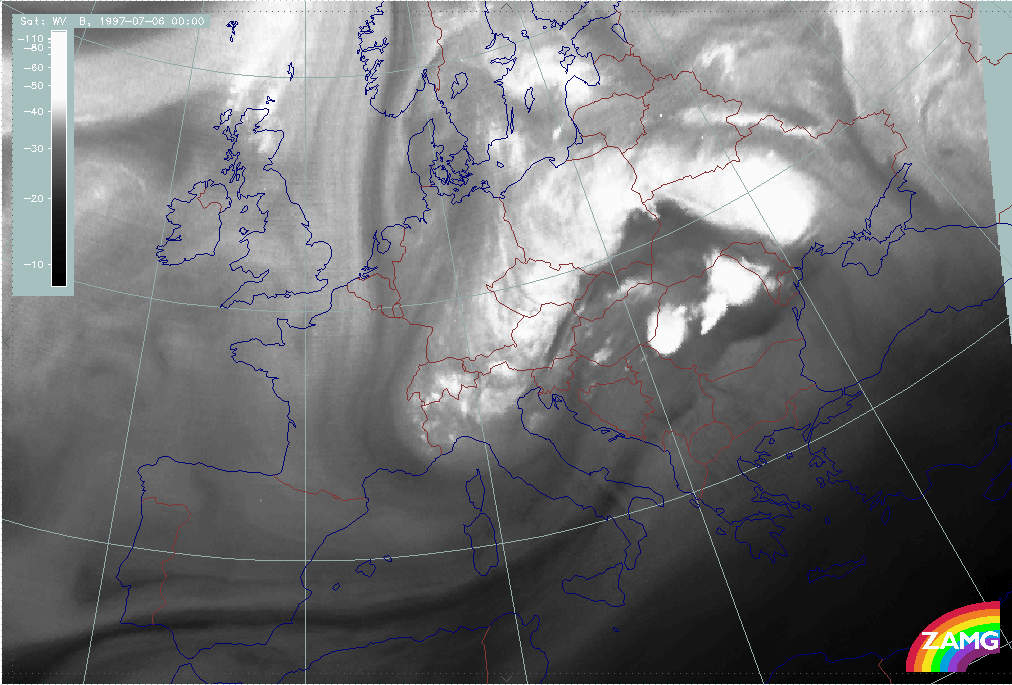
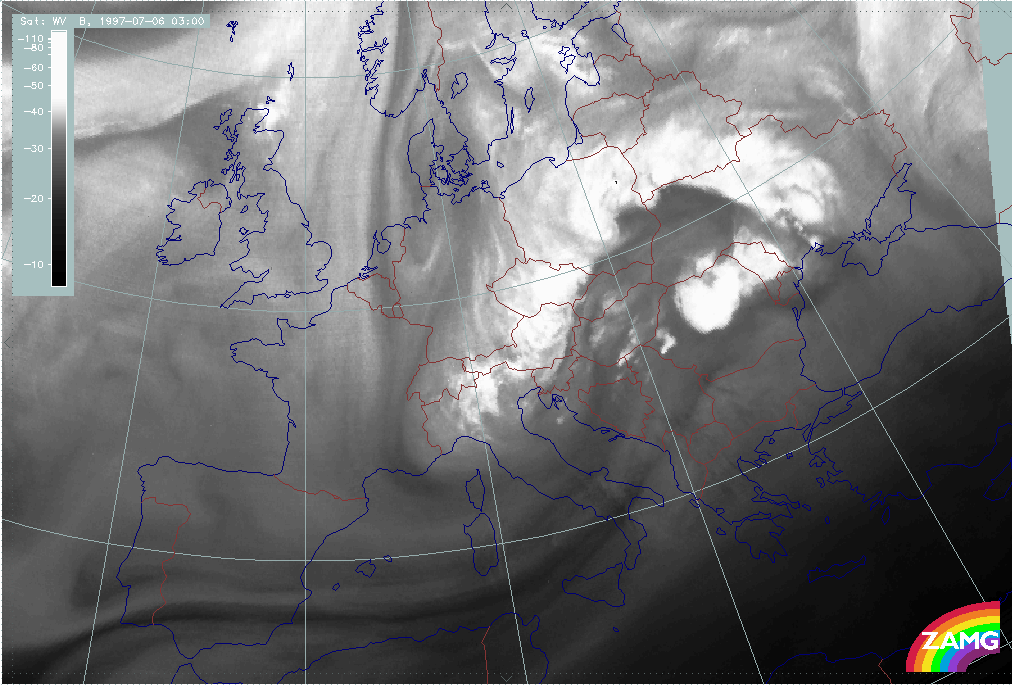
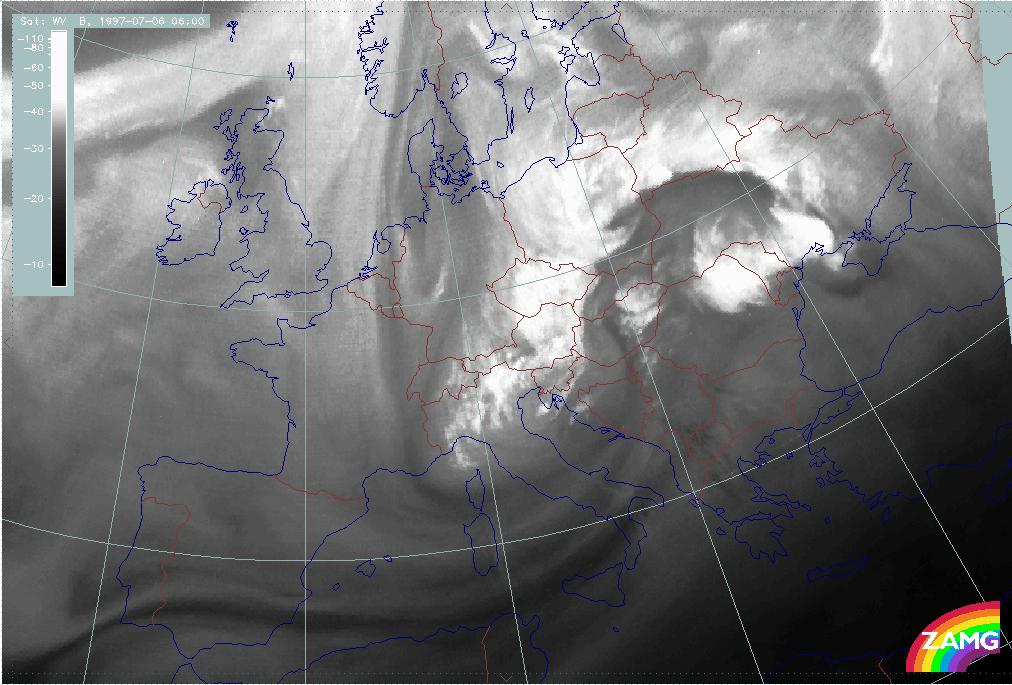
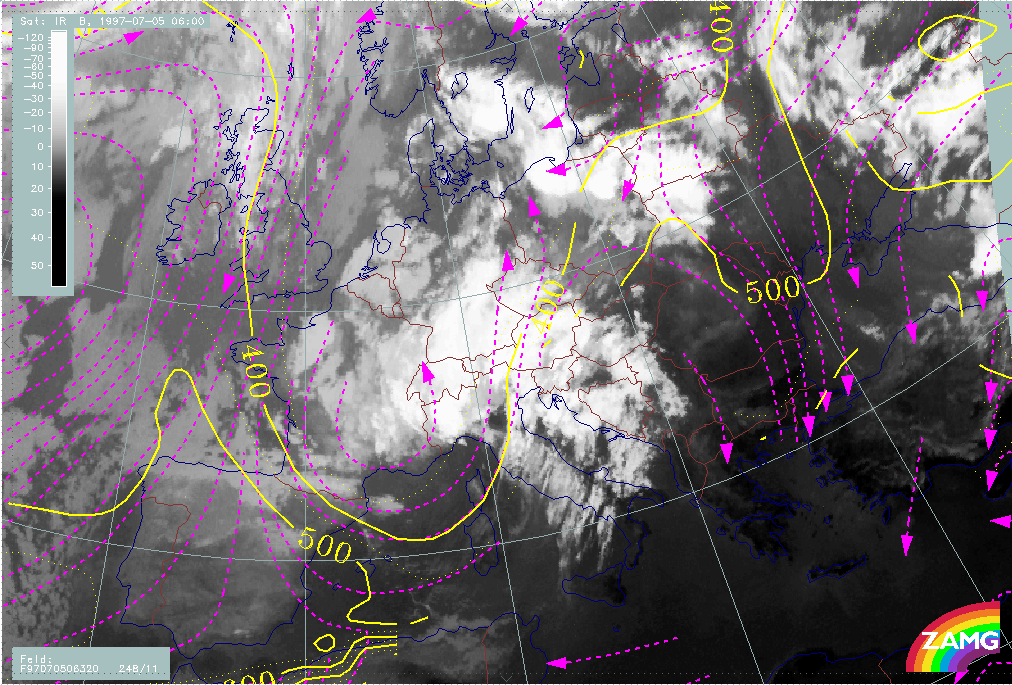
In this case a 3-hourly sequence of WV images gives some additional input as it shows the existence of two spiral centres much more clearly with the help of two Black Stripes indicating intruding dry air. There is, indeed, an eastern circulation centre which is associated with the frontal cloud band. From this point of view, the eastern cloud band might represent an occlusion development. But there is also a western circulation centre with dry air coming from the consecutive upper level trough. This can be seen very clearly till about 05 July/18.00 UTC. From then on, the features become more complicated in the area of the development of a cut off low.
During this phase an extended ULL with several sub-centres exists over middle Europe; furthermore, a very steady WV spiral is recognisable over N. Germany and Denmark.
|
05 July 1997/06.00 UTC - Meteosat WV image; 05/06.00 - 06/06.00 UTC 3-hourly image loop
|
|
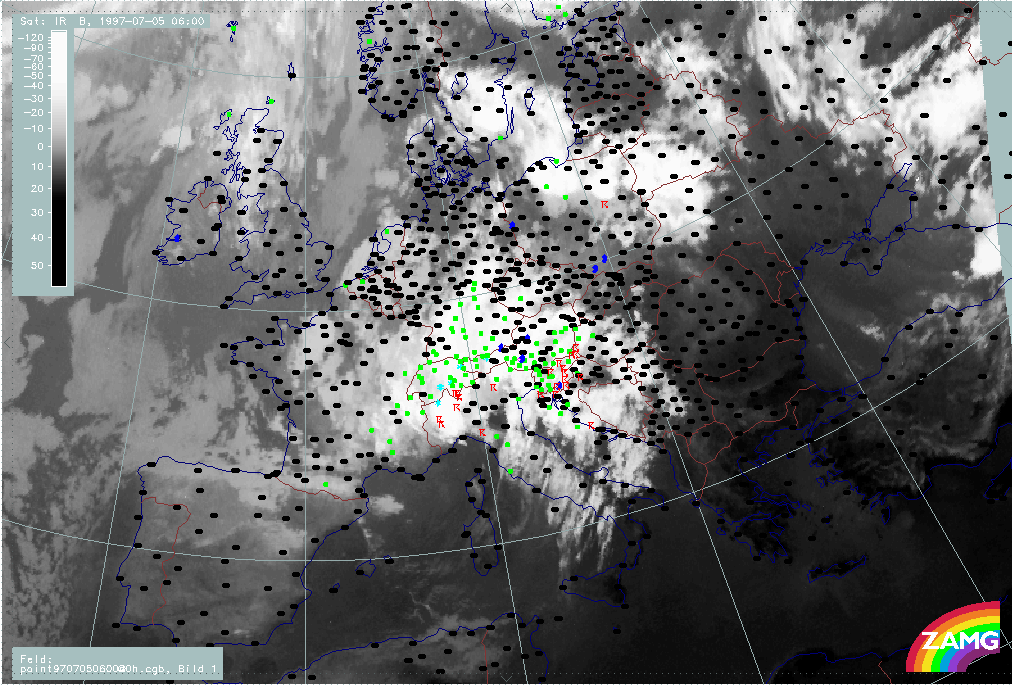
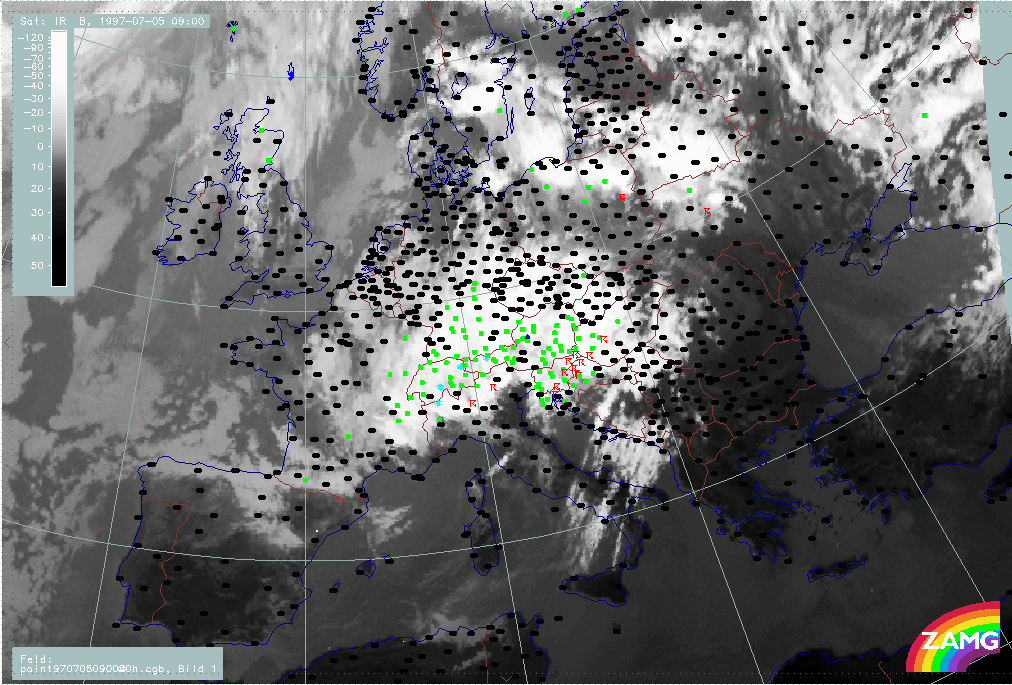
The third sequence shows the precipitation events superimposed on the IR images. There is a lot of precipitation associated with the occlusion (like) cloud band. The countries most influenced by rain are:
- Switzerland: during the whole period but with less extension from 06 July/00.00 UTC onwards
- Austria: during the whole period but with different regions involved
- Germany: on 05 July with the intensity maximum moving from north to the south
- Czech Republic: From 05 July/12.00 UTC to the end of the period
- Poland: from 05 July/12.00 UTC to the end of the period but moving from southern areas to the north
|
05 July 1997/06.00 UTC -Meteosat IR image; weather events (green: rain and showers, blue: drizzle, cyan: snow, red: thunderstorm with precipitation, purple: freezing rain, orange: hail,
black: no actual precipitation or thunderstorm with precipitation); 05/06.00 - 06/06.00 UTC 3-hourly image loop
|
|
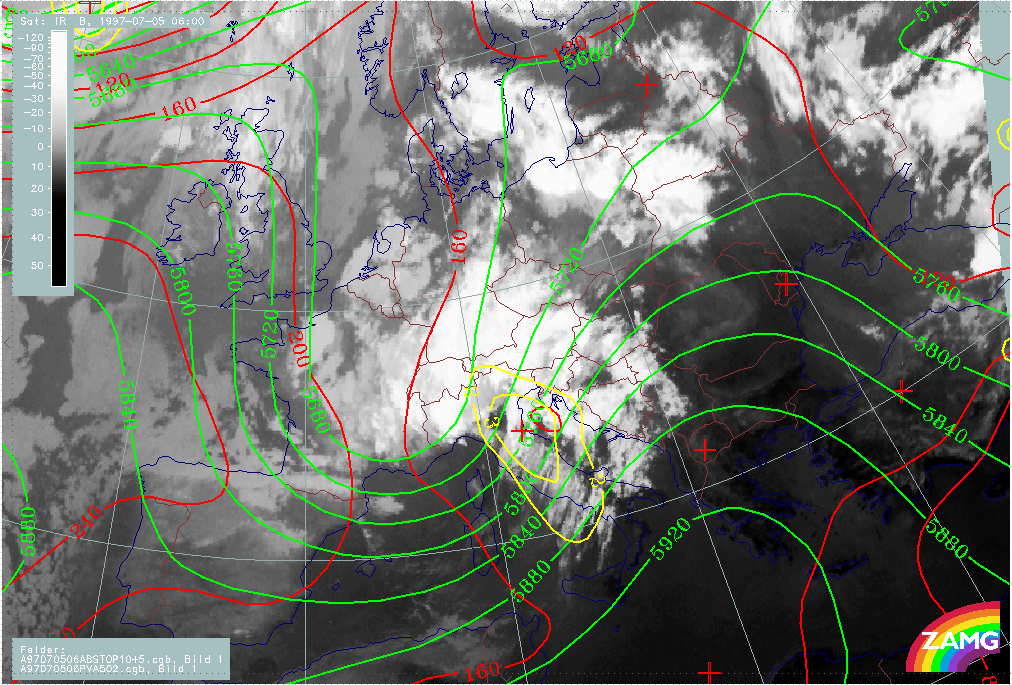
The example from 05 July/06.00 UTC represents the initial stage. The Occlusion - like spiral which extends from the W. Alps across Switzerland to Germany is within the upper level trough. However, the cloudiness over Austria, SSE Germany and the Czech Republic seems to be more closely associated with the frontal cloud band. This is supported by the WV images in the sequence. This eastern part of the Occlusion - like spiral can be found within the upper level SW stream.
A further distinction between the eastern and western part can be found in the thickness contours, which form a ridge area with remarkable WA in the eastern part.
|
05 July 1997/06.00 UTC - Meteosat IR image; red: height contours 1000 hPa, green: height contours 500 hPa; yellow: positive vorticity advection (PVA) 500 hPa
|
05 July 1997/06.00 UTC - Meteosat IR image; blue: Thermal Front Parameter (TFP) 500/850 hPa, green: equivalent thickness 500/1000 hPa, red solid: temperature advection - WA 1000 hPa,
red dashed: temperature advection - CA 1000 hPa
|
|
|
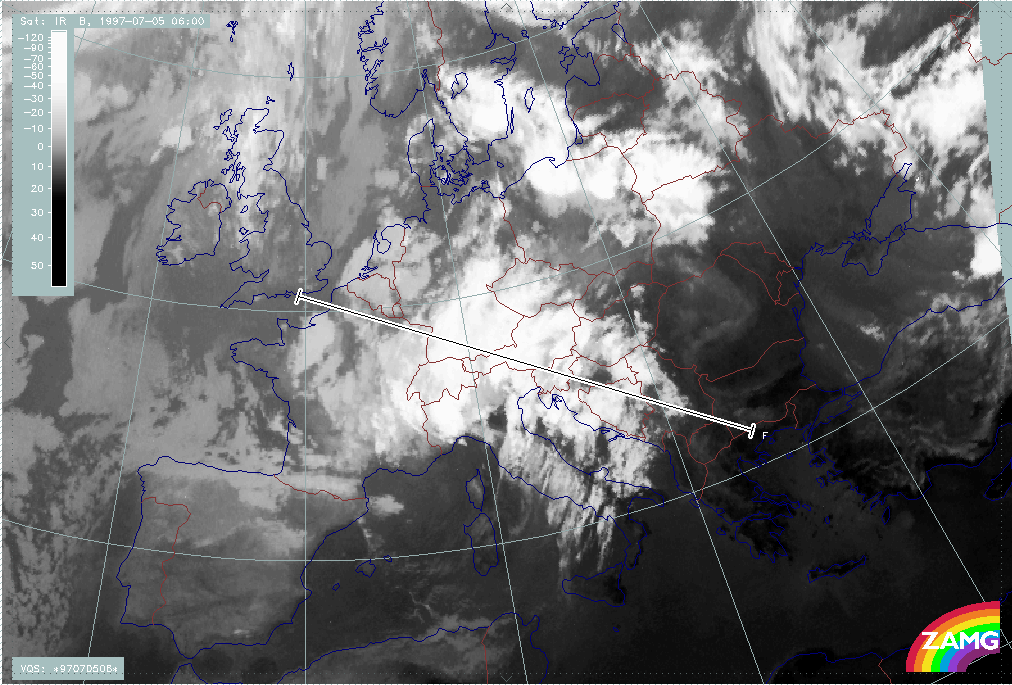
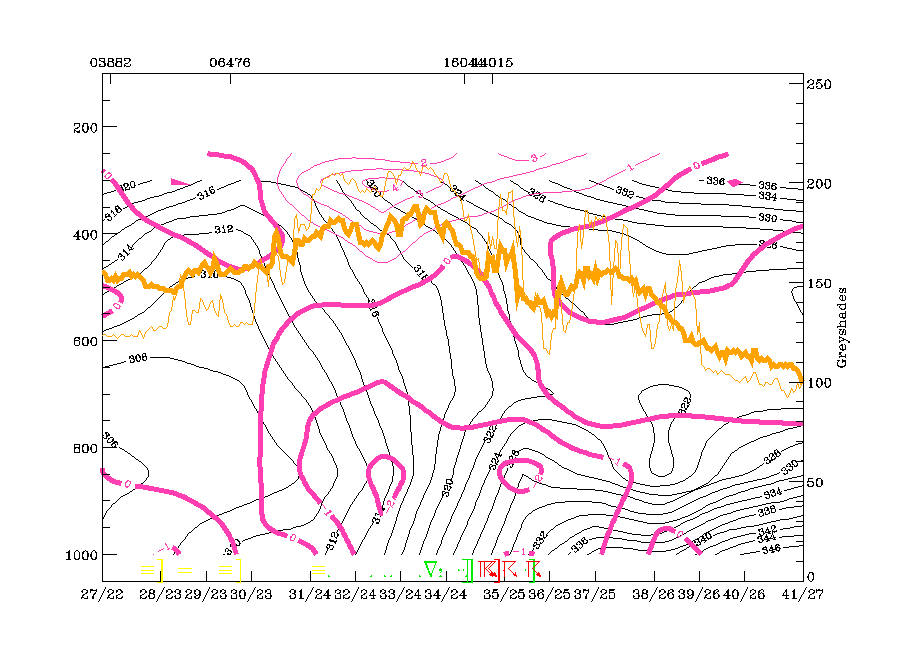
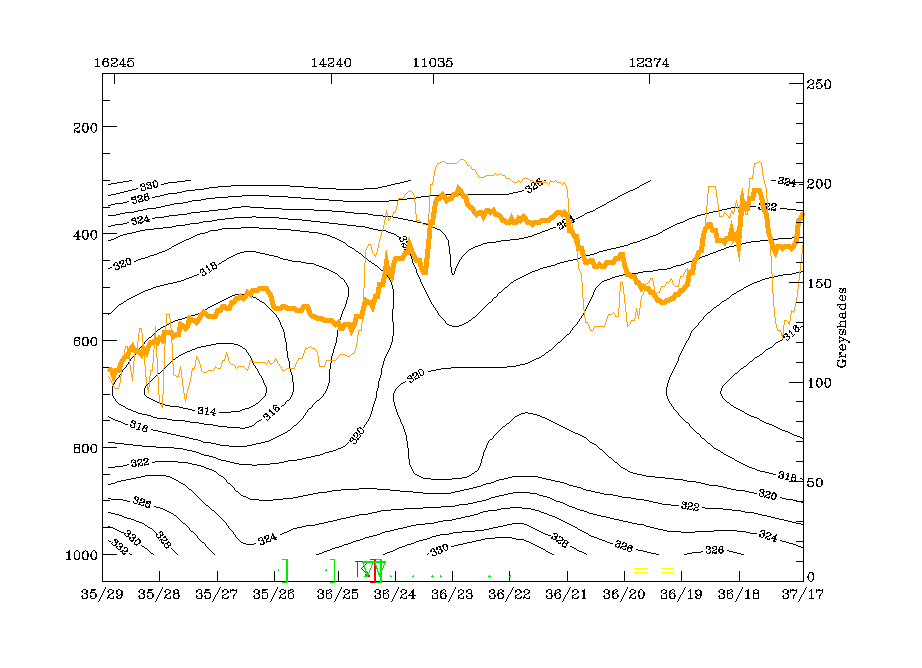
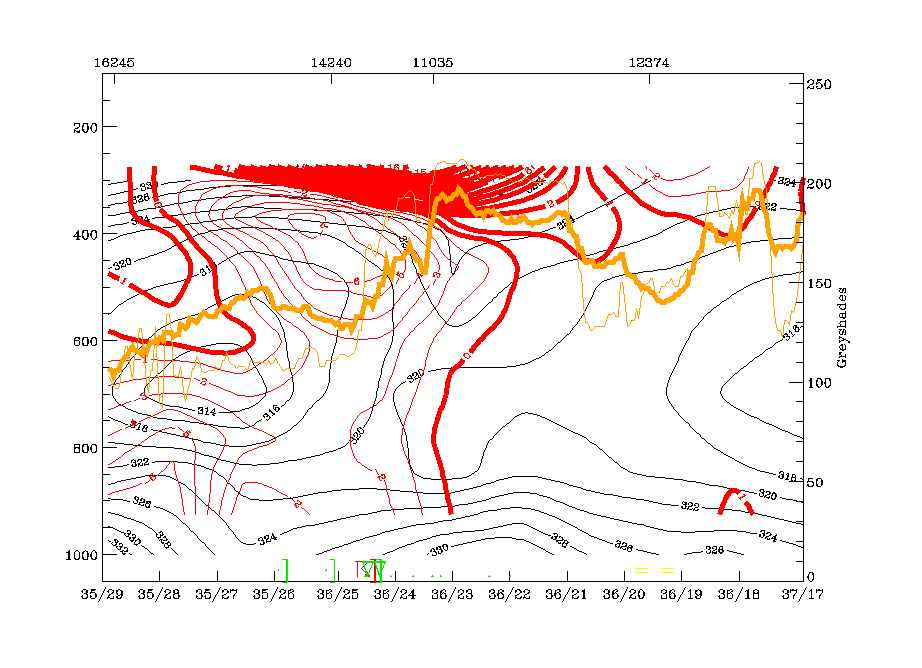
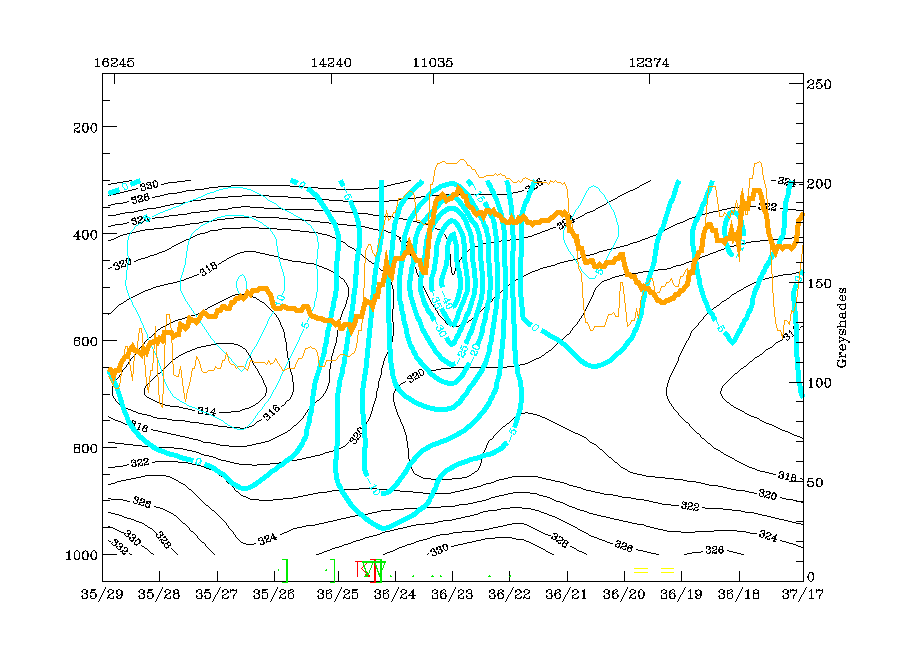
The diagnosis of the cloud band extending from the W. Alps to Germany and its relation with the frontal cloud band in the Mediterranean is not completely clear. It is called Occlusion - like because of the impression of a cyclonically curved cloud band, but the genesis within the cold air contradicts a classical Occlusion process. On the other hand the WV image reveals very clearly a double structure with some possible Occlusion development in the eastern part connected to the front. Vertical cross sections might give more insight into this problem. The vertical cross section line F extends from the NW (English Channel) across the Occlusion - like band and the frontal cloud band to the SE over N. Greece.
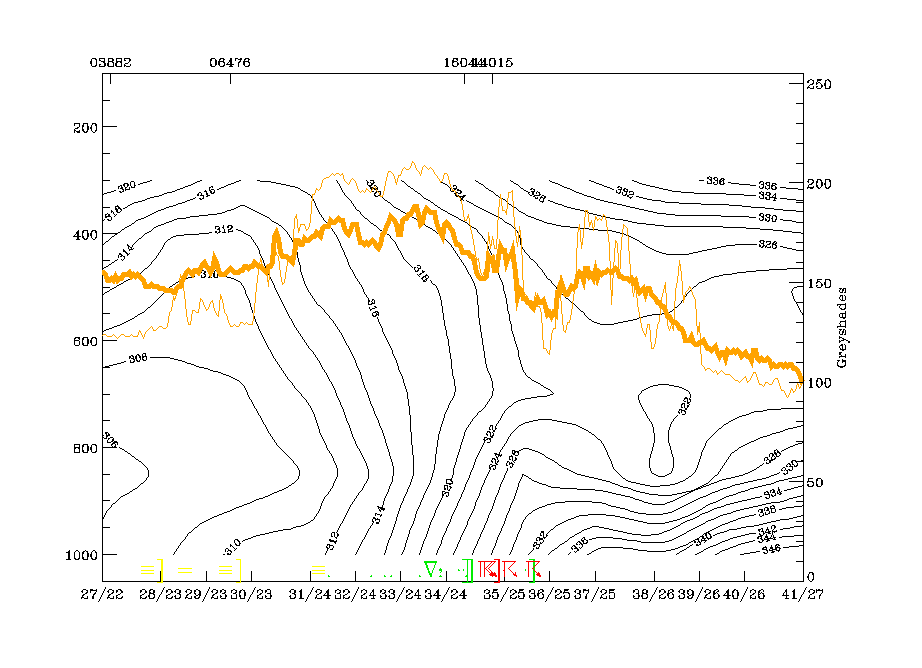
Indeed a double structure can be detected in the isentropes. There are two zones of high gradients in the isentropes: the western one is limited by the 310 and 316K isentropes and belongs to the Occlusion - like cold air band over Germany; it is accompanied by lots of rain. The more eastern one is limited by the 318 and 322K isentropes and belongs to the frontal cloudiness, especially to the area in the frontal cloudiness where an Occlusion process might start. It is accompanied by lots of thunderstorms. The unstable area in front of the frontal cloud band is very dramatic in this cross section. At this point of time no configuration typical for an Occlusion process can yet be detected in the isentropes. Both zones are much more characteristic of Cold Front zones.
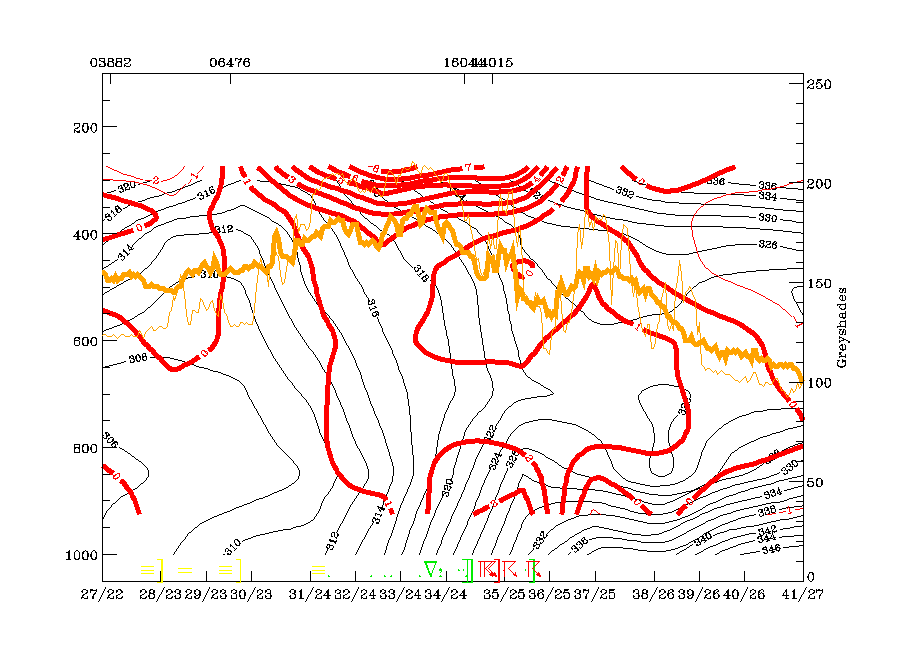
The TA distribution within this vertical cross section does not show very distinct features, but convergence strongly supports the double structure of the fronts: there are two zones of convergence maxima directly related to the two frontal zones. For the Cold Front zone, convergence reaches up to 450 hPa, for the cold air cloud band up to 500 hPa with maximum values around 850 hPa.
Another very distinct sign for the double structure can be found in the fields of vertical motion (omega) which show two separate and very strong maxima for the two frontal systems.
|
05 July 1997/06.00 UTC - Meteosat IR image; position of vertical cross section indicated
|
|
|
|
|
05 July 1997/06.00 UTC - Vertical cross section; black: isentropes (ThetaE), orange thin: IR pixel values, orange thick: WV pixel values
|
05 July 1997/06.00 UTC - Vertical cross section; black: isentropes (ThetaE), red thin: temperature advection - CA, red thick: temperature advection - WA, orange thin: IR pixel values,
orange thick: WV pixel values
|
|
|
|
|
|
05 July 1997/06.00 UTC - Vertical cross section; black: isentropes (ThetaE), magenta thin: divergence, magenta thick: convergence, orange thin: IR pixel values, orange thick: WV pixel
values
|
05 July 1997/06.00 UTC - Vertical cross section; black: isentropes (ThetaE), cyan thick: vertical motion (omega) - upward motion, cyan thin: vertical motion (omega) - downward motion,
orange thin: IR pixel values, orange thick: WV pixel values
|
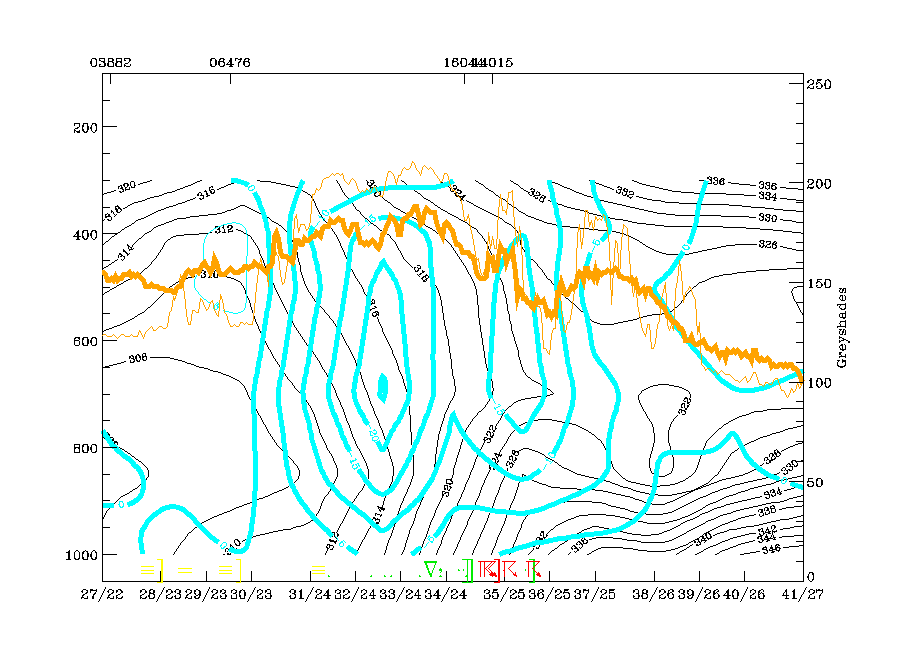
Two isentropic surfaces are selected for investigating relative streams: 316K which is on top of the western frontal zone of high gradients (related to the Occlusion - like cold air cloud band) and 320K, which is within the frontal zone of high gradients typical for the frontal cloud band.
On the lower surface a strong rising conveyor belt accompanies the bright cloudiness of the newly developed cold air cloud band. This conveyor belt shows some explanation for the development of this band.
On the higher isentropic surface a relative stream from behind is superimposed on the frontal cloud band which shows only moderate ascent in the area of the frontal cloudiness.
|
05 July 1997/06.00 UTC - Meteosat IR image; magenta: relative streams 316K - system velocity 248° 11 m/s, yellow: isobars
|
05 July 1997/06.00 UTC - Meteosat IR image; magenta: relative streams 320K - system velocity 248° 11 m/s, yellow: isobars
|
|
|
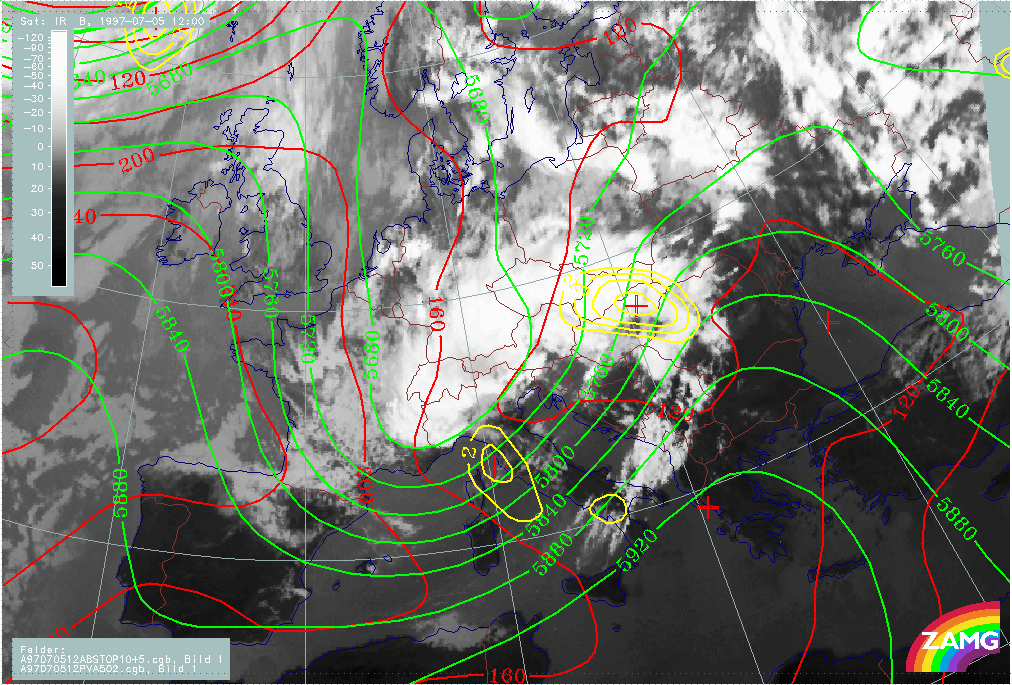
Between 05 July/06.00 and 05 July/12.00 UTC, a dramatic change has taken place in the cloud features. The Occlusion - like cloud band is now fully developed and already shows the two spiral centres which divide the whole band into an eastern and a western part.
This separation, based on cloud structures, is also supported by numerical parameters: The eastern part (Romania - Hungary - Slovakia - Czech Republic - E. Austria) is within a small ridge in the upper level SW stream, while the western part (Germany - Switzerland - W. Alps) is in the centre of the upper level trough being at the tie-off stage. There is remarkable PVA at 500 hPa inthe eastern part.
Another set of parameters indicative of frontal conditions show a thickness ridge as well as a new branch in the TFP connected to the eastern part of the Occlusion - like spiral. The western part belongs to the thickness trough. WA is existing but is rather weak.
|
05 July 1997/12.00 UTC - Meteosat IR image; red: height contours 1000 hPa, green: height contours 500 hPa; yellow: positive vorticity advection (PVA) 500 hPa
|
05 July 1997/12.00 UTC - Meteosat IR image; blue: Thermal Front Parameter (TFP) 500/850 hPa, green: equivalent thickness 500/1000 hPa, red solid: temperature advection - WA 1000 hPa,
red dashed: temperature advection - CA 1000 hPa
|
|
|
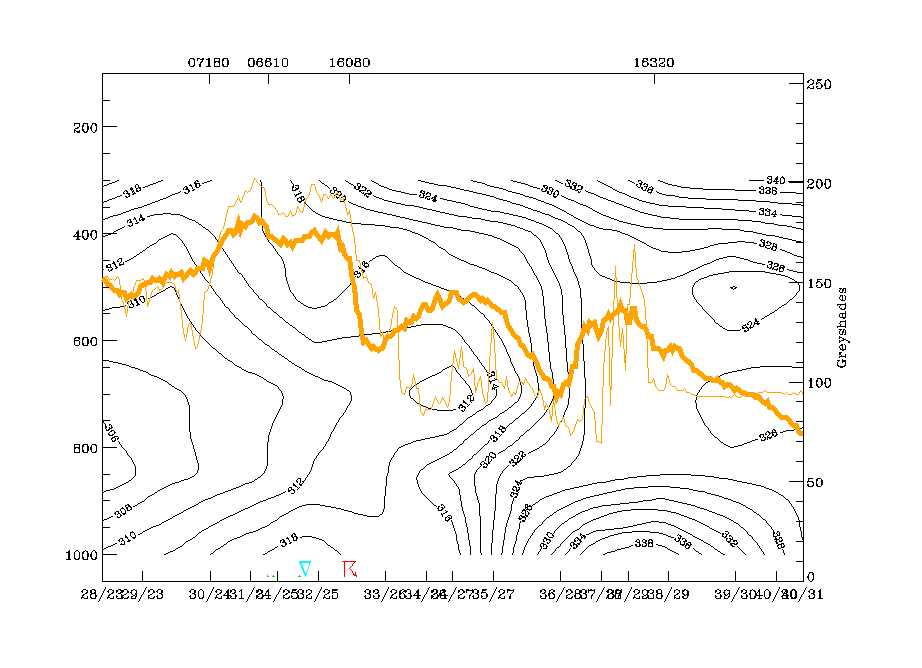
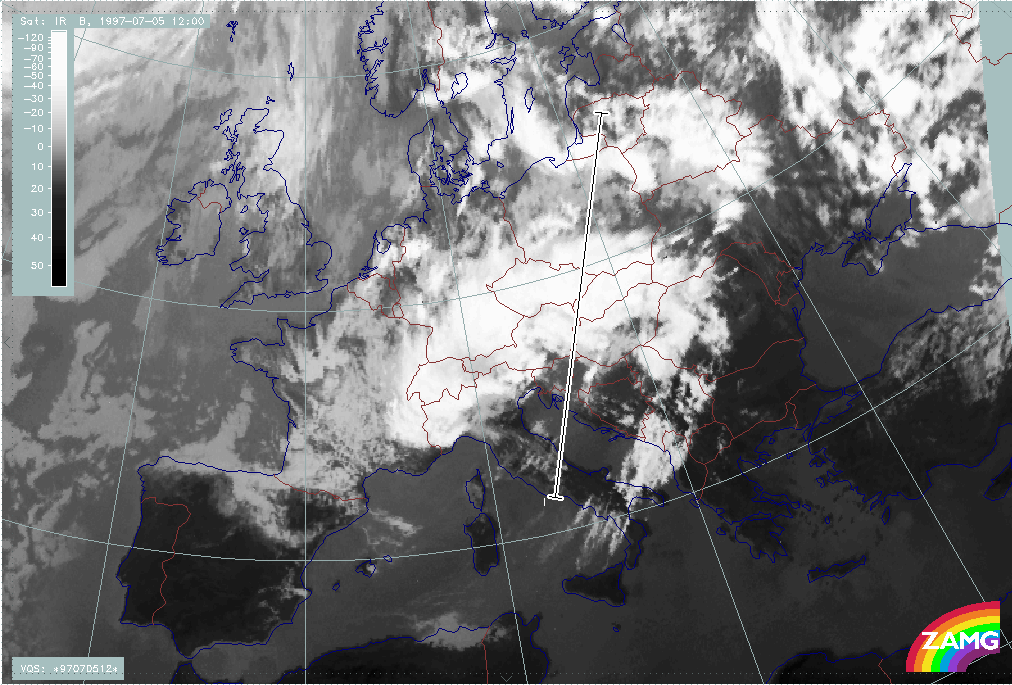
There are two vertical cross sections representing the western and the eastern part of the Occlusion - like spiral.
Vertical cross section line G is representative for the western cloud part. It crosses the cloudiness over Switzerland, and also crosses the southern parts of the rest of the Cold Front cloudiness and Warm Conveyor Belt cloudiness (see chapter Frontal cloud band). In this vertical cross section the westernmost broad peak of IR values (between radiosonde stations 07180 - 16080) represent the cloud band under consideration. The isentropes in this area differ from the situation 6 hours before, as there is no longer a frontal surface reaching the ground. There is an extremely unstable layer from the surface up to about 650 hPa. Above this, an upper level frontal zone can be detected but the isentropic trough configuration between 06610 and 16080 around 500 hPa might indicate the beginning of an Occlusion situation in this high levels: Consequently there are three different regimes on top of each other: a very unstable layer up to 700 hPa, an upper level Cold Front from 400 hPa down to about 700 hPa and an isentropic trough (pool of warm air) between 500 and 400 hPa above.
|
05 July 1997/12.00 UTC - Meteosat IR image; position of vertical cross section indicated
|
05 July 1997/12.00 UTC - Vertical cross section; black: isentropes (ThetaE), orange thin: IR pixel values, orange thick: WV pixel values
|

|
|
The eastern vertical cross section is oriented from S to N and crosses the eastern part of the Occlusion - like cloud spiral.
The isentropes reveal very unstable layers up to about 600 hPa and a trough feature typical for an Occlusion higher than 600 hPa and centred around the radiosonde station 11035 (Vienna). This matches exactly with the intensive cloud peak there. The zero line of TA is very close to the axis of this Occlusion trough, with WA to the north within the cloud band as well as very strong upward motion.
So the main difference to the western vertical cross section is the lack of a Cold Front surface. For the eastern part, conditions of an Occlusion cloud band are fulfilled much better.
|
05 July 1997/12.00 UTC - Meteosat IR image; position of vertical cross section indicated
|
05 July 1997/12.00 UTC - Vertical cross section; black: isentropes (ThetaE), orange thin: IR pixel values, orange thick: WV pixel values
|
|
|
|
|
|
05 July 1997/12.00 UTC - Vertical cross section; black: isentropes (ThetaE), red thin: temperature advection - CA, red thick: temperature advection - WA, orange thin: IR pixel values,
orange thick: WV pixel values
|
05 July 1997/12.00 UTC - Vertical cross section; black: isentropes (ThetaE), cyan thick: vertical motion (omega) - upward motion, cyan thin: vertical motion (omega) - downward motion,
orange thin: IR pixel values, orange thick: WV pixel values
|
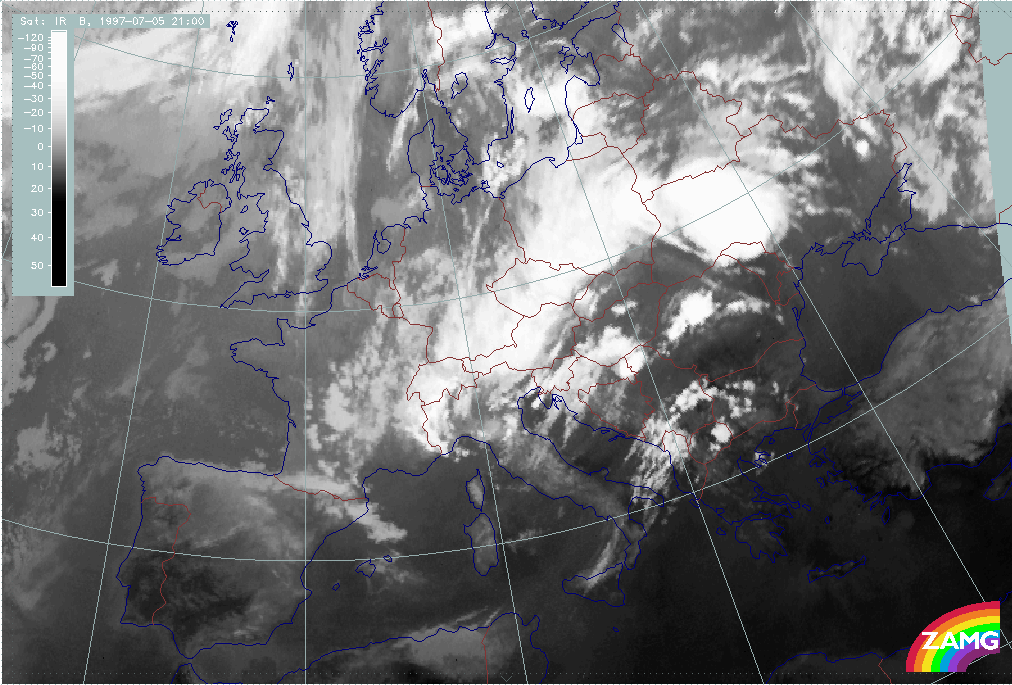
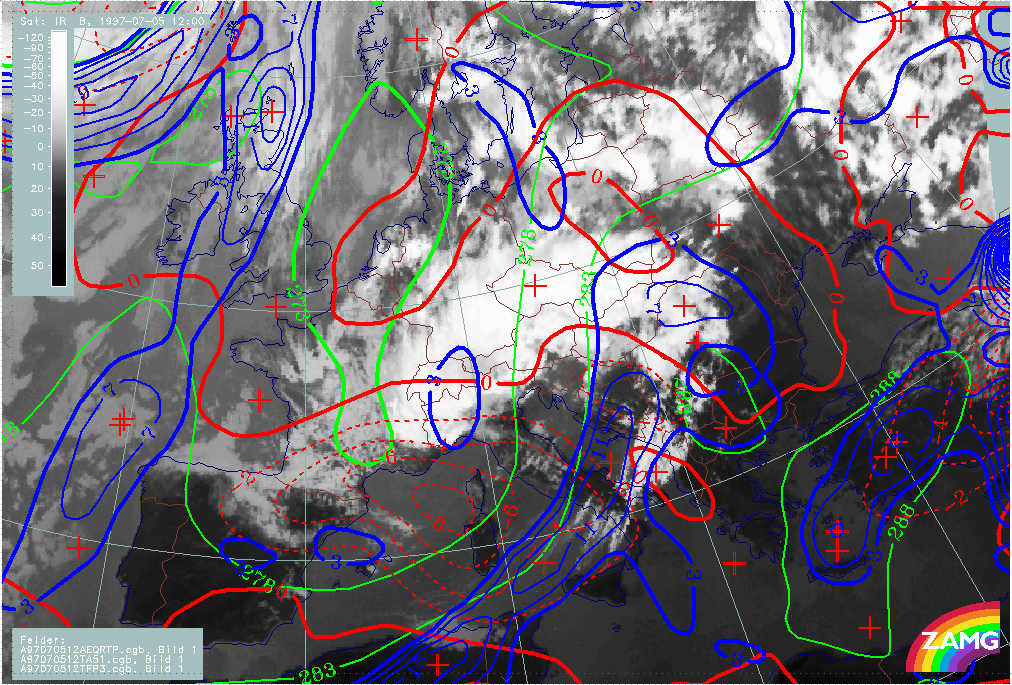
06 July 00.00 UTC is a point of time representating the end phase of this Occlusion - like spiral immediately before the cut off of the main ULL, which is discussed in detail in the next chapter (Main ULL cut-off).
At this point of time an extended ULL is already existing with three sub-centres:
- Over Denmark where there is no remarkable cloudiness but a distinct spiral structure in the WV imagery (compare WV sequence)
- Over Poland which is associated with the surface minimum and the eastern part of the Occlusion cloud spiral
- Over N. Italy where an extensive cut off process is under way.
The frontal parameters thickness, TA and TFP do not show remarkable changes up to this time and still show different physical states for the eastern and the western part of the Occlusion spiral.
|
05 July 1997/12.00 UTC - Meteosat IR image; red: height contours 1000 hPa, green: height contours 500 hPa; yellow: positive vorticity advection (PVA) 500 hPa
|
05 July 1997/12.00 UTC - Meteosat IR image; blue: Thermal Front Parameter (TFP) 500/850 hPa, green: equivalent thickness 500/1000 hPa, red solid: temperature advection - WA 1000 hPa,
red dashed: temperature advection - CA 1000 hPa
|
|
|
Concluding the discussion about the occlusion character of the cloud spiral, the following points can be summarised:
- Although there is one main continuous cloud band, a double sub-structure can be observed in the cloudiness as well as numerical parameters
- The western part does not at all show an Occlusion process but develops from a cold air feature
- Later on, a rather well developed Cold Front character is revealed in this area; but still later advection of warm air from NE gives again some slight impression of an Occlusion at the mature stage
- The eastern part develops from the frontal cloud band and, as such, fulfils the conditions of an Occlusion process
- This is supported by numerical parameters such as thickness
- In the vertical cross section the typical parameter configurations for an Occlusion do exist
- For both systems a thick, very unstable layer can be observed.