Cold air features
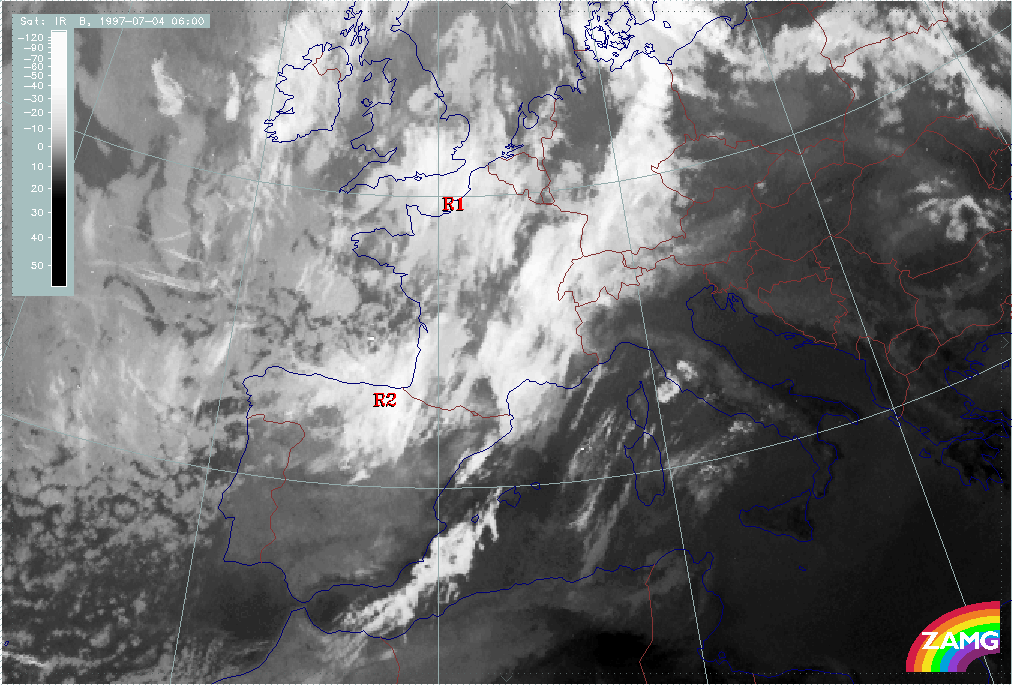
This chapter deals with the first development phase of the cloud features in the cold air and within the upper level trough. The 3-hourly image sequence shows developments taking place over W. France and moving from there eastward to E. France, Switzerland and Germany.
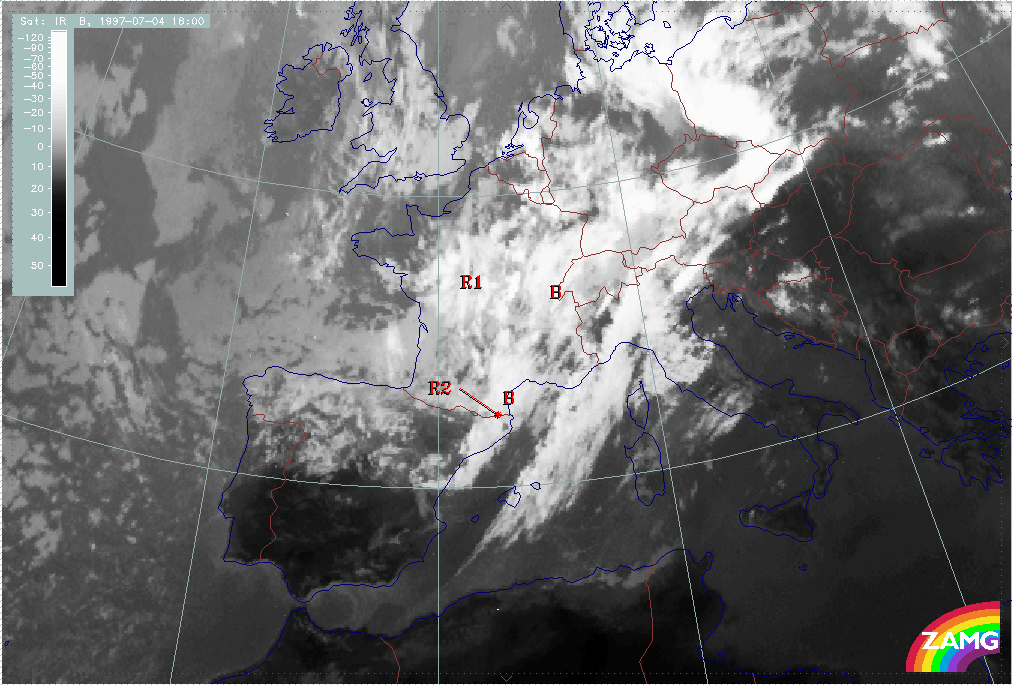
Initially, on 04 July/06.00 UTC, two intensified cloud areas R1 and R2 can be observed. They consist of multi-layered cloudiness with some convective elements embedded. Up to 04 July/12.00 UTC, both areas R1 and R2 can be followed easily; the convective character of the whole trough area behind the frontal cloud band increases as well as the convective character of both enhanced cloud areas R1 and R2. This convective character continues to strengthen during the next hours.
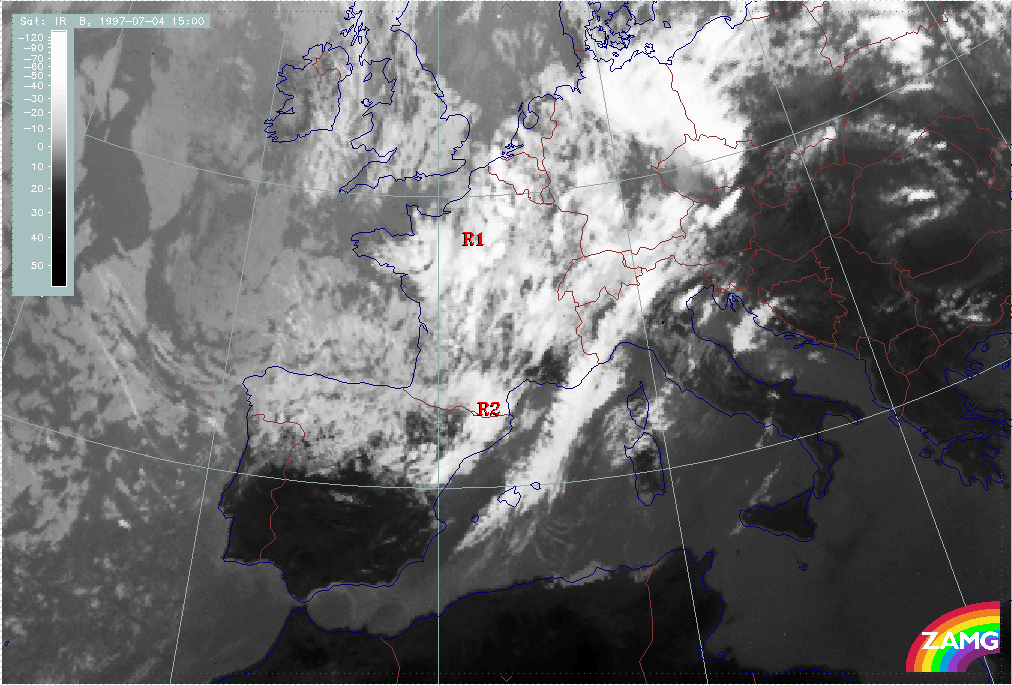
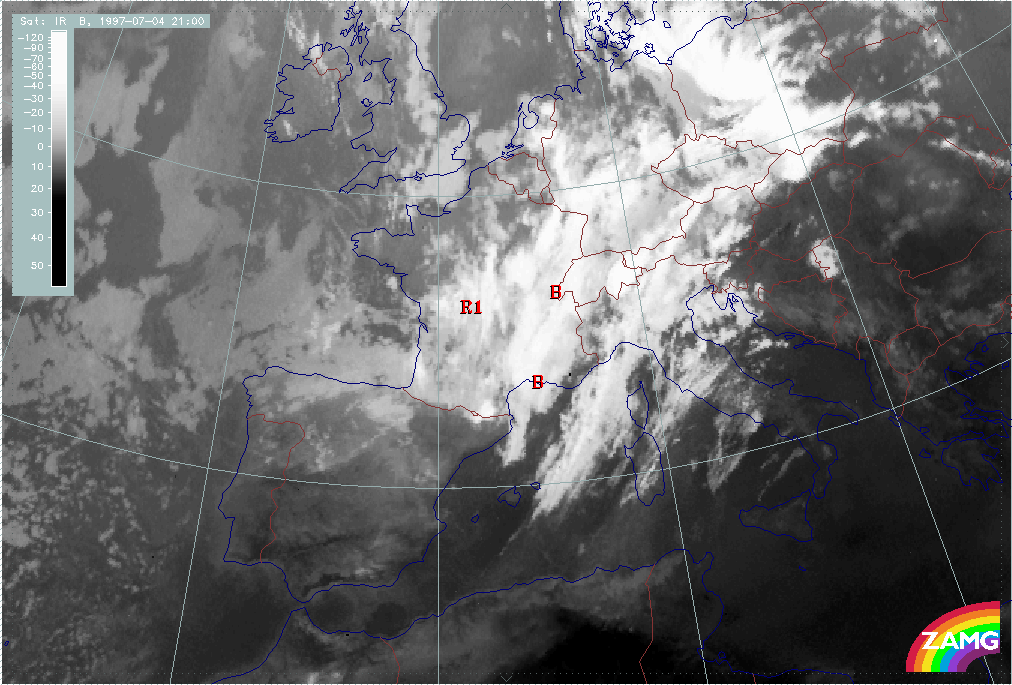
From 04 July/15.00 UTC till 04 July/21.00 UTC, a band-like feature (B) develops behind the frontal cloud band; it is built up from two main centres: the convective area R2 and a more northern new development over the W. Alps immediately behind the frontal cloud band. At 21.00 UTC the cloud band is continuous and extends from S. France across W. Switzerland into Germany. At the same time the enhanced cloud area R1 has moved southward into central France.
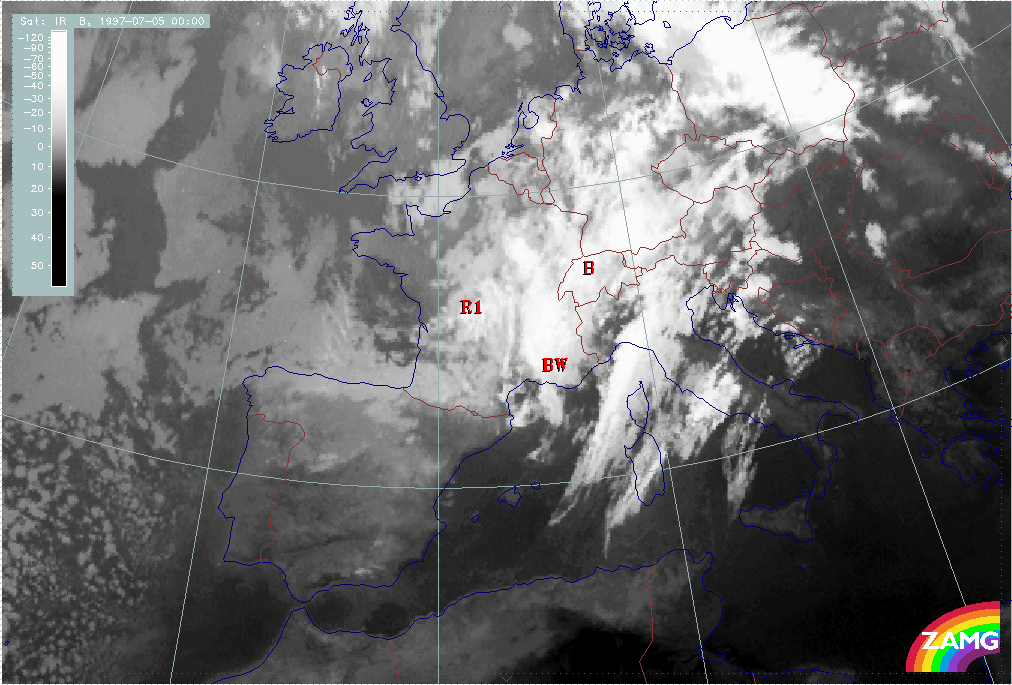
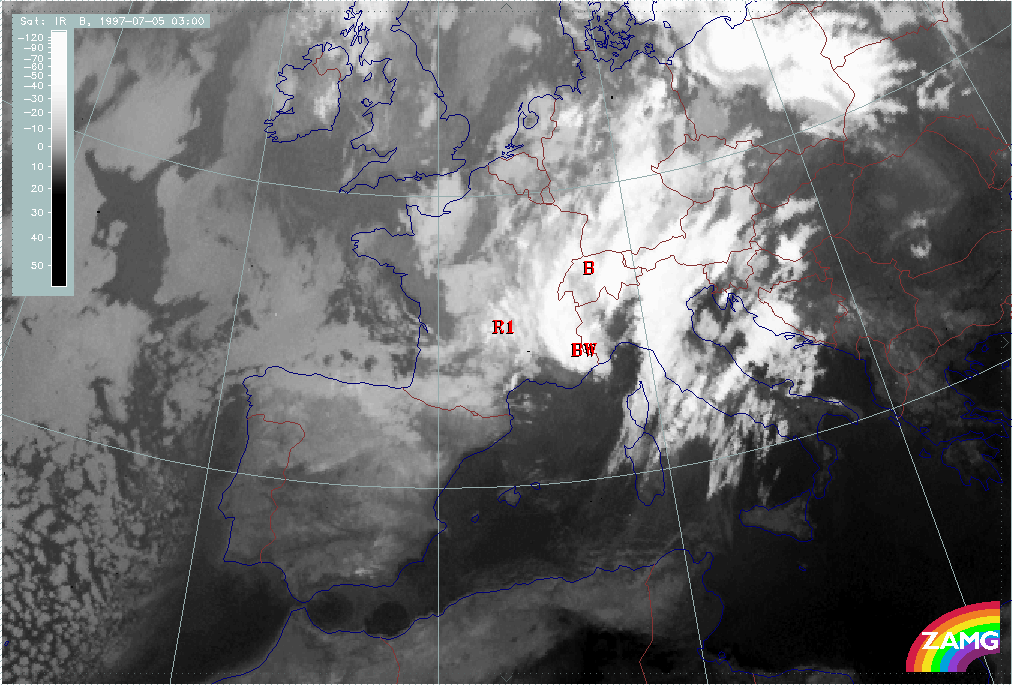
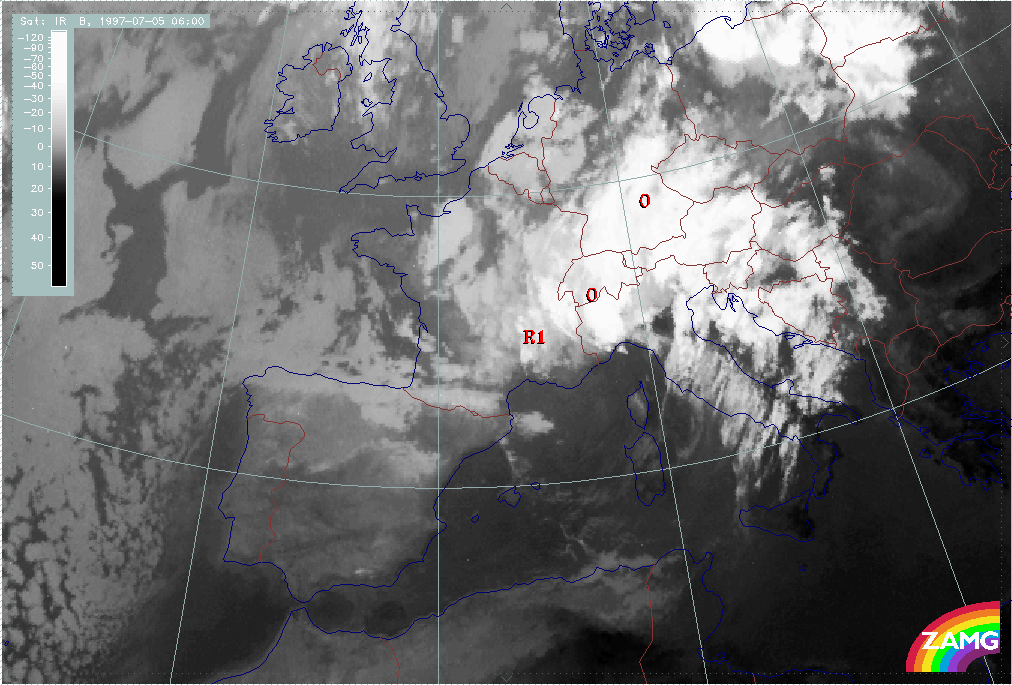
During the last time period from 04 July/21.00 UTC to 05 July/06.00 UTC, a cyclonic curvature within the band structure B develops, which at 05 July/00.00 UTC gives the impression of a Wave structure developing within B (BW); but the following images show the formation of a cyclonic cloud spiral from B, BW which in the last image of this sequence (05 July/06.00 UTC) gives an impression that an Occlusion process had taken place, indicated by (O) in the relevant image. But, bearing in mind that the cloud band B has developed behind and separate from the frontal cloud band, a classical Occlusion process (either from the Warm Conveyor Belt type or from the cold conveyor belt type) has to be excluded. In the image of 05 July/03.00 UTC, the development of cloudiness between the frontal cloud band and cloud band B can be observed over E. Switzerland.
During the whole period, the enhanced convective area R1 can be followed, although it is decaying.
|
04 July 1997/06.00 UTC - Meteosat IR image; 04/06.00 - 05/06.00 UTC 3-hourly image loop
|
|
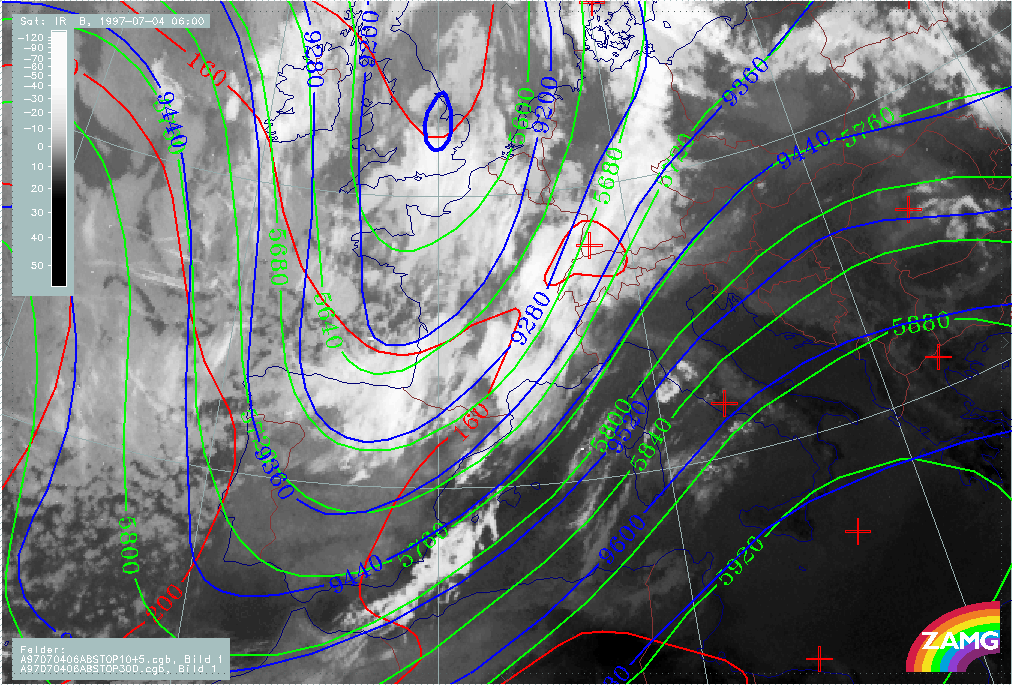
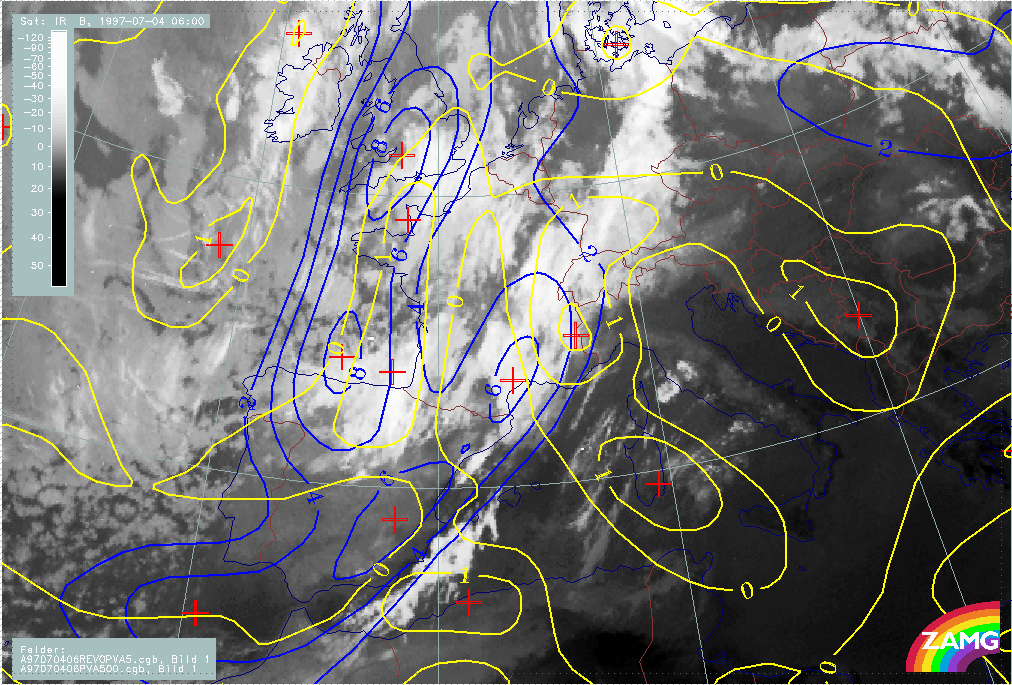
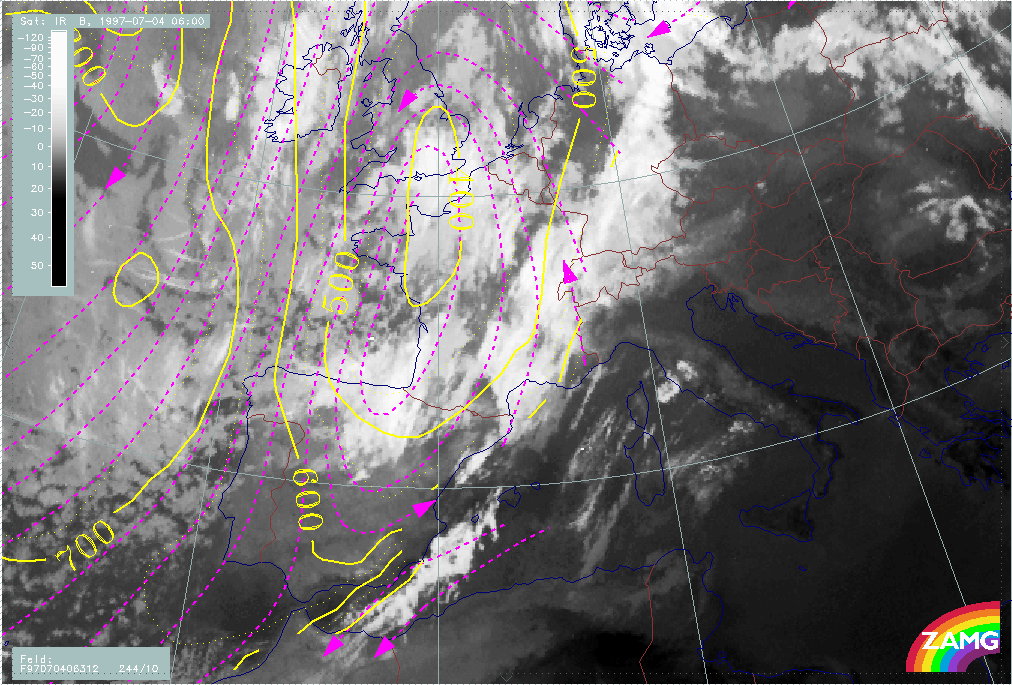
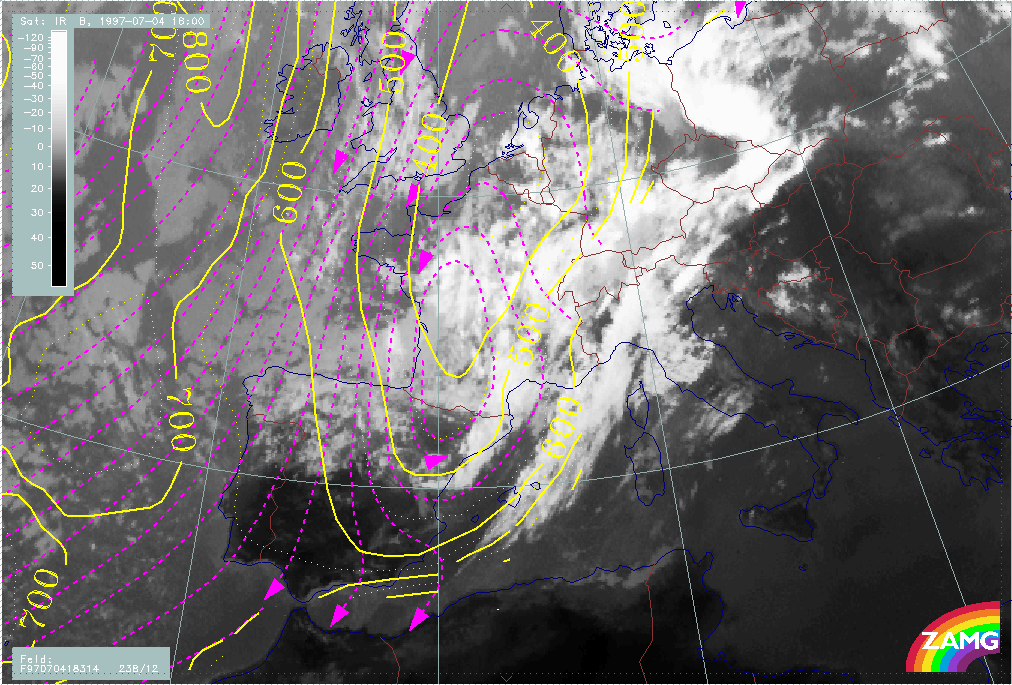
The situation of 04 July/06.00 UTC is characteristic of the initial phase of a distinct upper level trough. Both cloud areas R1 and R2 are situated in the axis of an intensive upper level trough between 500 and 300 hPa. The surface field (1000 hPa) does not contain any typical frontal trough or low pressure feature.
Enhanced cloud systems in cold air are usually driven by the upper level processes and consequently associated with PVA maxima; in this case there are two cyclonic vorticity maxima at 500 hPa exactly at the rear of R1 and R2, but PVA in advance of the vorticity maxima and superimposed on the cloud systems is (although existing) weak (1 unit). This leads to the conclusion that the upper level trough system is for the time being, rather stationary.
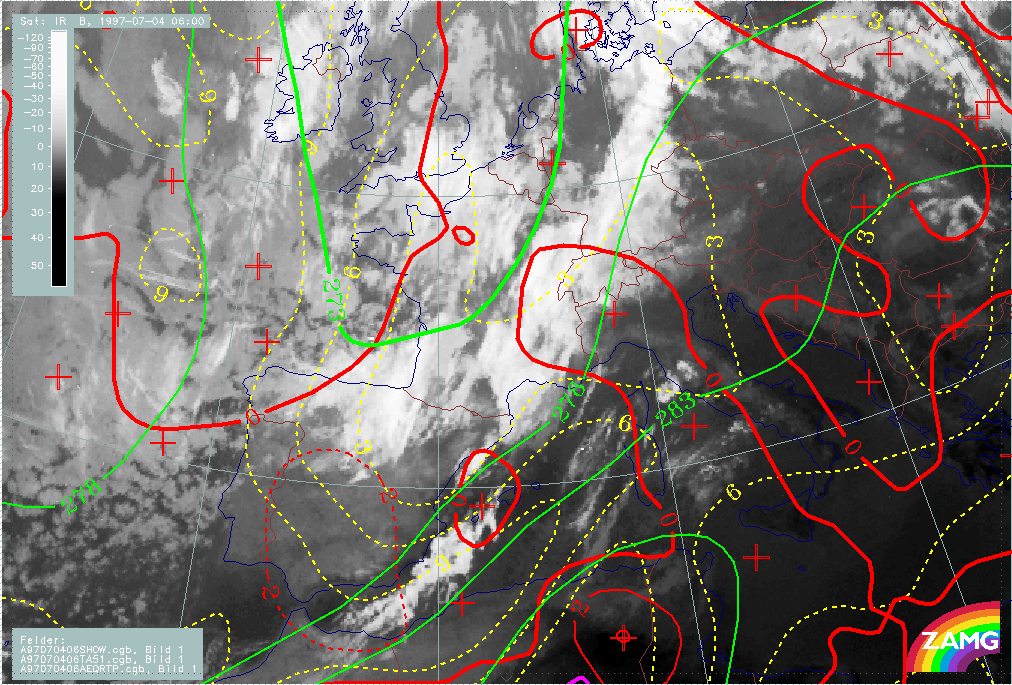
The stability situation in this area is typical: cloud systems R1 and R2 are within the thickness trough line under weak cold advection (CA) and the Showalter Index mostly shows values <3, indicating the existence and development of showers.
|
04 July 1997/06.00 UTC - Meteosat IR image; red: height contours 1000 hPa, green: height contours 500 hPa, blue: height contours 300 hPa
|
04 July 1997/06.00 UTC - Meteosat IR image; blue: vorticity 500 hPa, yellow: positive vorticity advection (PVA) 500 hPa
|
|
|
|
|
|
04 July 1997/06.00 UTC - Meteosat IR image; green: equivalent thickness 500/1000 hPa, red solid: temperature advection - WA 1000 hPa, red dashed: temperature advection - CA 1000 hPa,
yellow: Showalter index
|
|
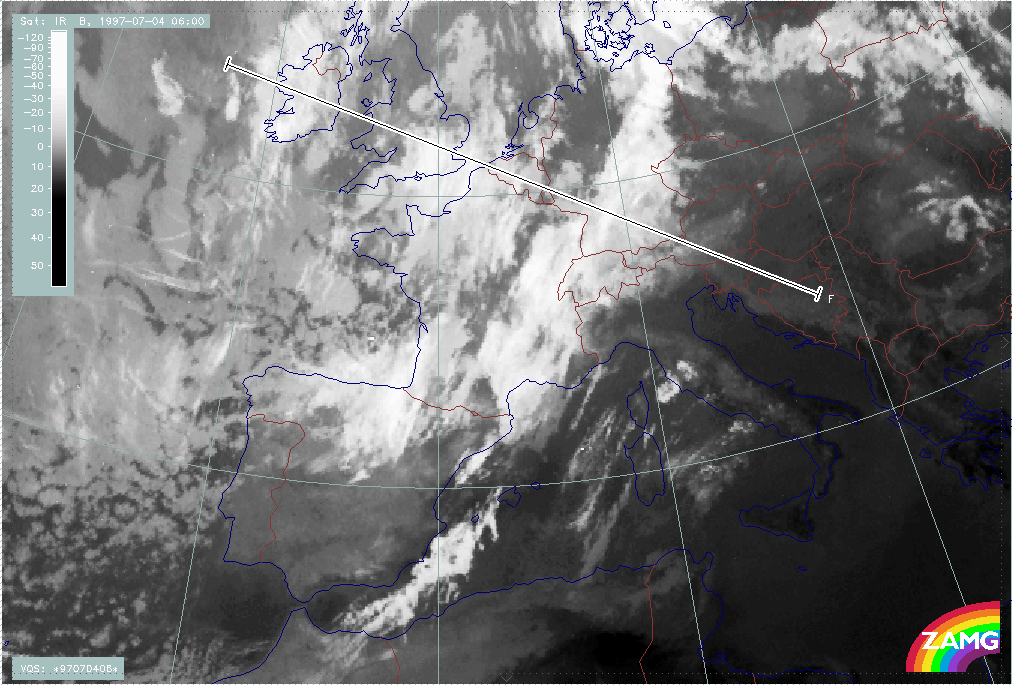
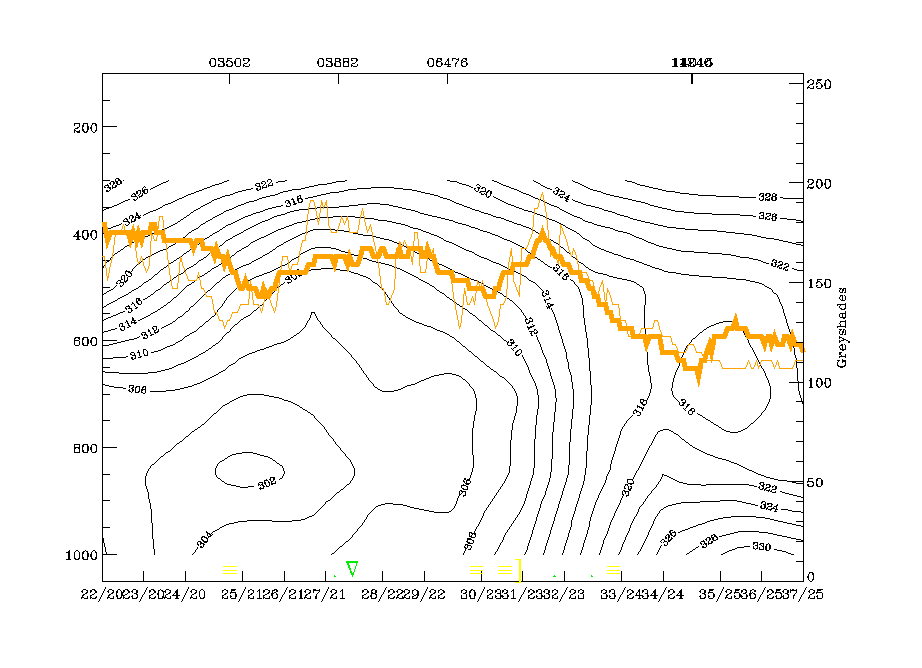
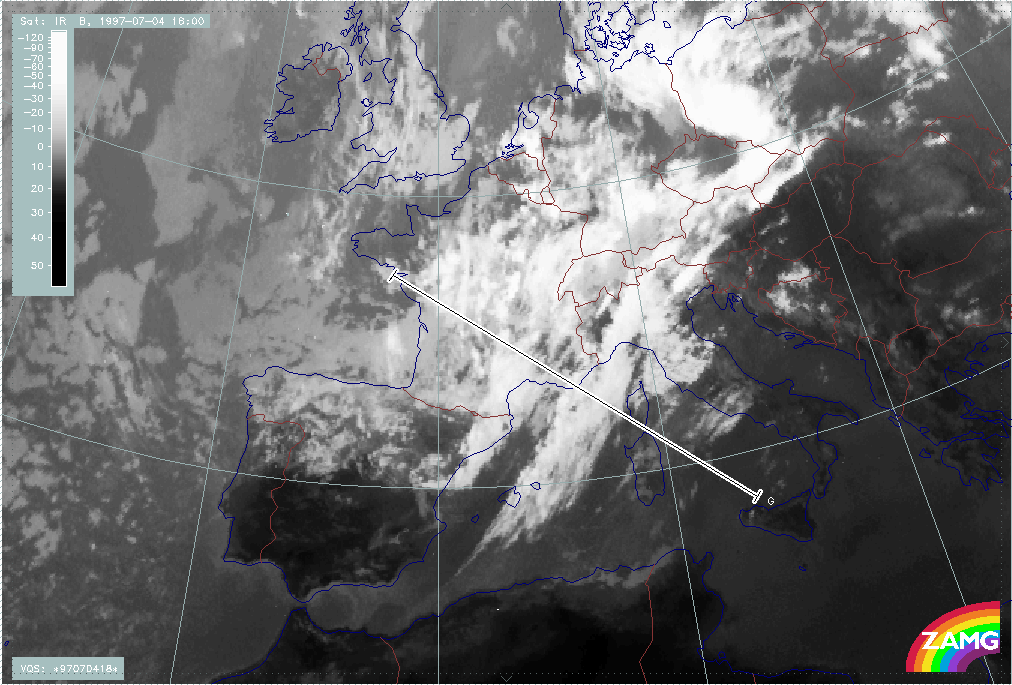
Vertical cross section and relative streams give additional insight into the ongoing processes. The vertical cross section F extends from the NW (Ireland) across the enhanced area R1 and the frontal cloud band to the SW (Balkan Peninsula). The western peak in the IR pixel values around radiosonde station 03882 indicates R1, the more south-western peak (SW of radiosonde station 06476) indicates the frontal cloud band. It is interesting that the CA features show up mainly in the IR signals, while the WV signals remain rather dry; in contrast, there is also a peak in the WV curve over the frontal cloud band. This is the consequence of the dry air within the upper level and thickness trough.
Isentropes show very typical configurations. An unstable area below R1 and a downward inclined frontal zone of high gradients at the south-western boundary. The isentropic surface of 312K is on top of the unstable area within R1 and within the frontal crowding zone. Relative streams at this surface show a cyclonic eddy in the cold air with rising branches in the area of the CA features R1 and R2.
|
04 July 1997/06.00 UTC - Meteosat IR image; position of vertical cross section indicated
|
04 July 1997/06.00 UTC - Vertical cross section; black: isentropes (ThetaE), blue: relative humidity, orange thin: IR pixel values, orange thick: WV pixel values
|
|
|
|
|
|
04 July 1997/06.00 UTC - Meteosat IR image; magenta: relative streams 312K - system velocity 244° 10 m/s, yellow: isobars
|
|
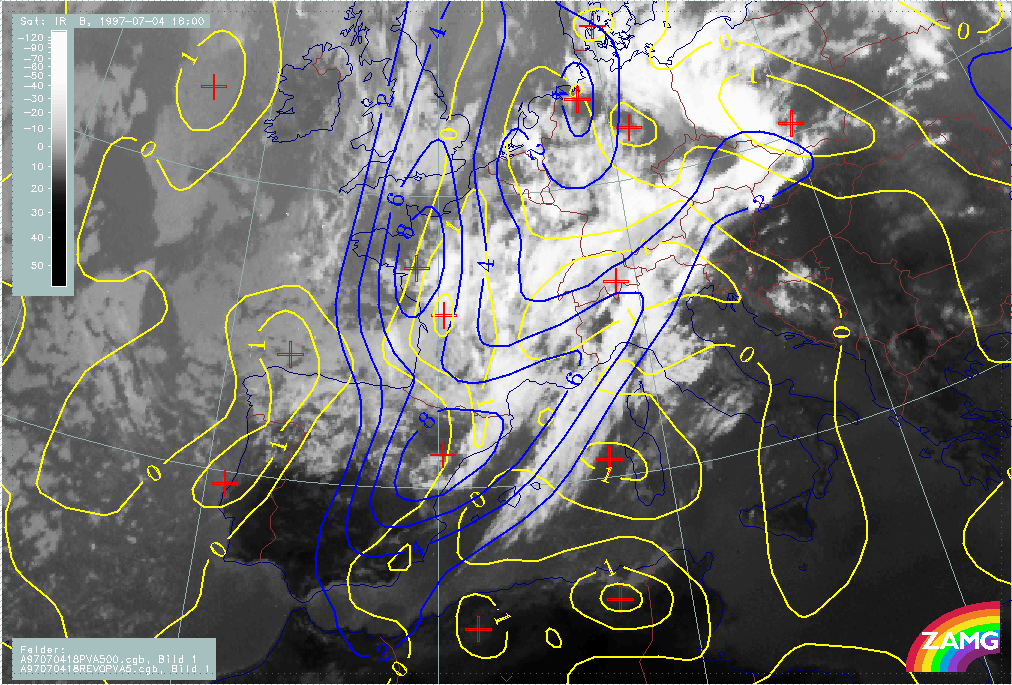
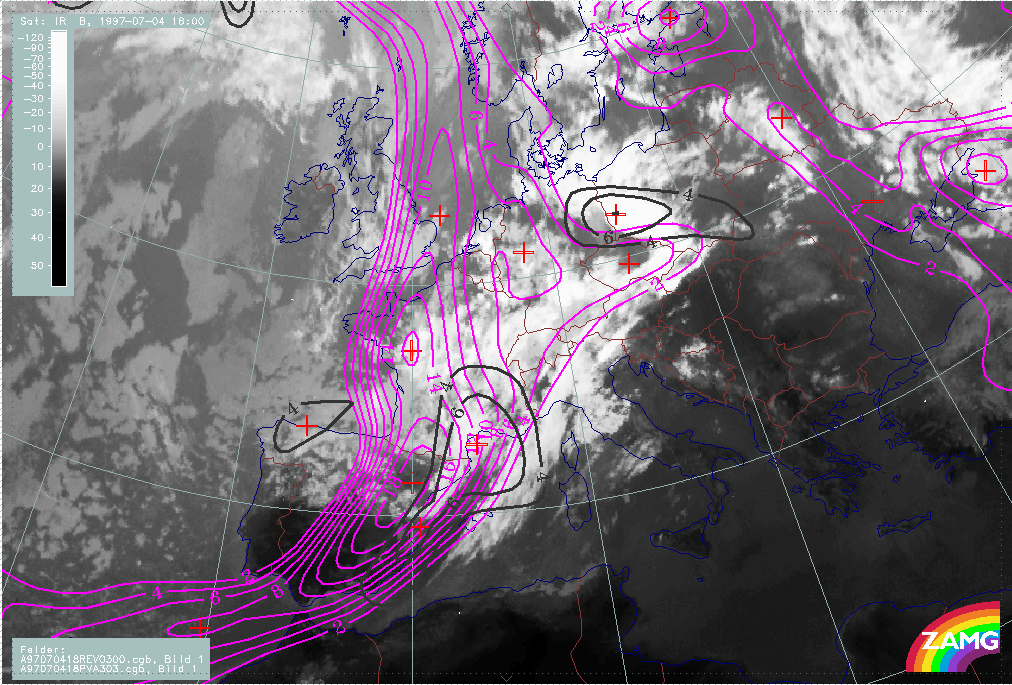
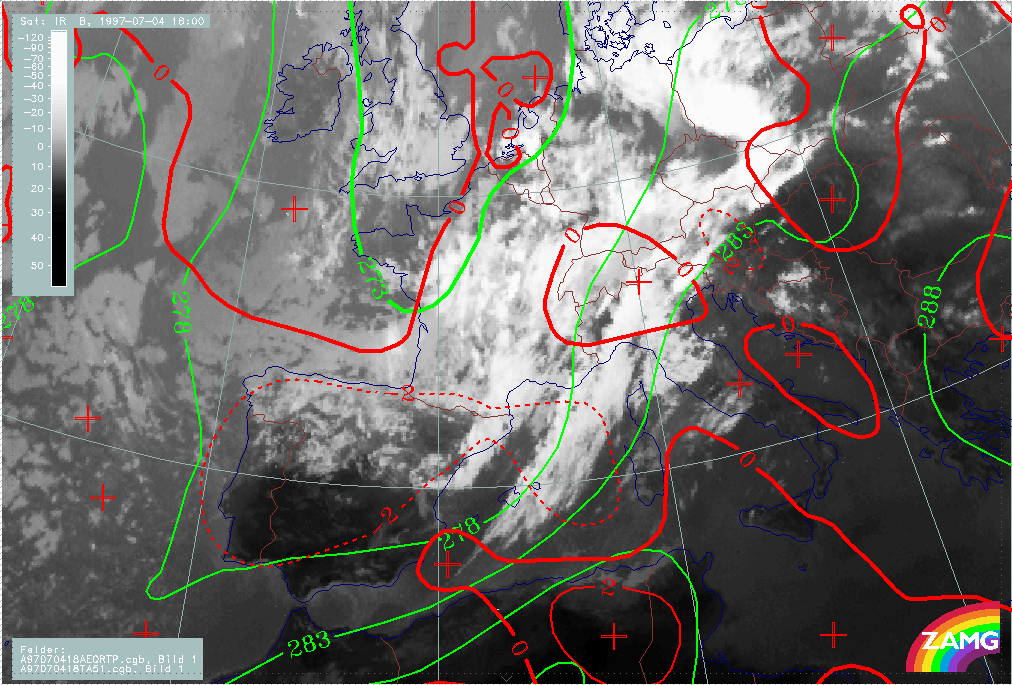
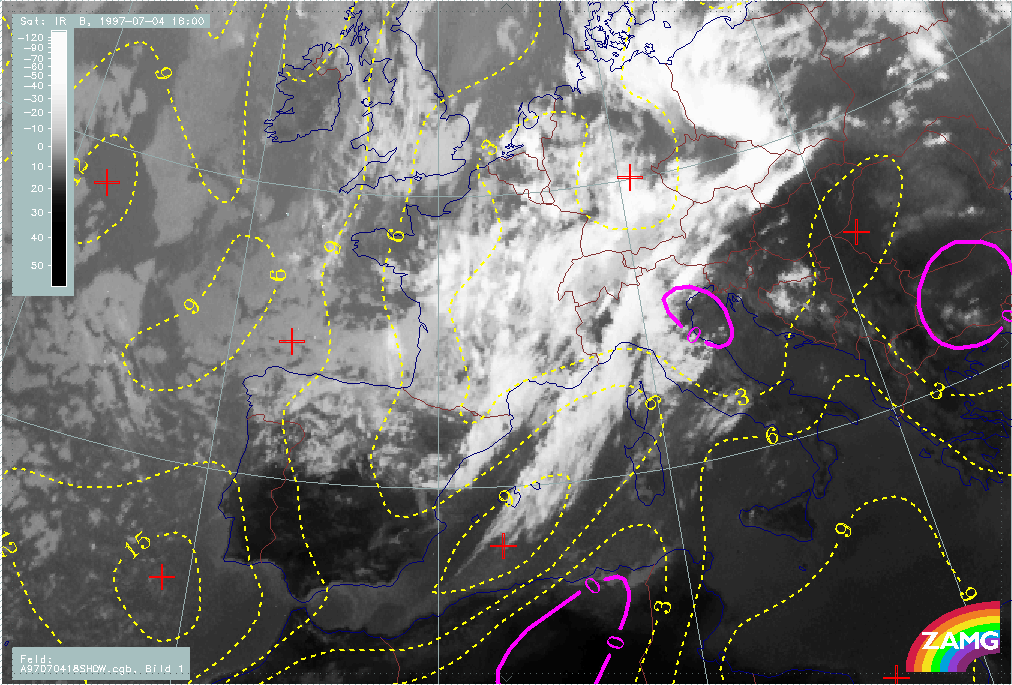
The situation at 04 July/18.00 UTC represents the near complete development of the cloud band B behind the frontal cloud band. At this point of time, it extends from NE Spain across France and W. Switzerland into S. Germany. This cloud band is situated within the extensive SW stream at the leading edge of the upper level trough (500 - 300 hPa) while R1 still can be found within the upper level trough itself. There is now an extended area of lower pressure in the surface fields (1000 hPa).
Compared to 12 hours before, the PVA maximum associated with R1 has now increased, indicating the propagation of the corresponding vorticity maximum over NW France. And indeed, the convective area R1 can be observed for a rather long time. The relation between the cloud band B and vorticity as well as PVA maxima at 500 hPa is not as clear. There is much better correspondence between B and the situation at 300 hPa. At least the southern part of B which has developed from the former CA feature R2 is under strong PVA at 300 hPa, which indicates a moving trough.
The cloud band B is clearly behind the high gradients in the thickness field and mostly under CA. As before, the biggest part of the cold air cloud band B is accompanied by Showalter Indices < 3 units which indicates shower activity.
|
04 July 1997/18.00 UTC - Meteosat IR image; red: height contours 1000 hPa, green: height contours 500 hPa, blue: height contours 300 hPa
|
04 July 1997/18.00 UTC - Meteosat IR image; blue: vorticity 500 hPa, yellow: positive vorticity advection (PVA) 500 hPa
|
|
|
|
|
|
04 July 1997/18.00 UTC - Meteosat IR image; magenta: vorticity 300 hPa, black: positive vorticity advection (PVA) 300 hPa
|
04 July 1997/18.00 UTC - Meteosat IR image; green: equivalent thickness 500/1000 hPa, red solid: temperature advection - WA 1000 hPa, red dashed: temperature advection - CA 1000 hPa
|
|
04 July 1997/18.00 UTC - Meteosat IR image; yellow: Showalter index, magenta: Showalter index
|
|
|
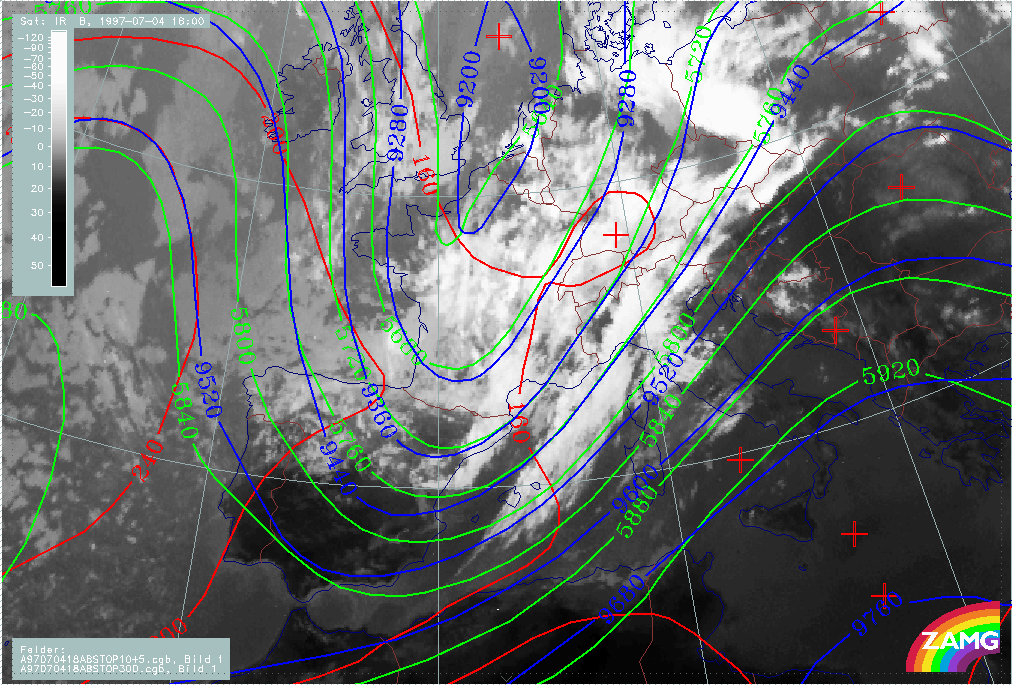
As before, additional information is gained by studying vertical cross sections and relative streams. The vertical cross section line is chosen from NW (Brittany) along the southern boundary of R1, across the cold air cloud band and the frontal cloud band to the SE (Sicily).
All three cloud systems can be identified in the IR pixel values peaks:
- The western one (47N/00 - 47N/01E) represents R1 and is connected to an unstable area in the isentropes.
- The peak around 44N/03E represents B. It is also associated with a very unstable layer from the surface up to about 650 hPa, but on top of this layer an upper level frontal zone can be analysed.
- This upper level frontal zone merges with the main frontal zone which is represented by the IR pixel value peak between 43N/05E and 41N/08E.
The isentropic surface at 314K is mainly representative for the upper level zone of high gradients accompanying the cloud band B, and is the lowest surface of the main frontal zone. Consequently the relative streams show a cyclonically curved conveyor belt within the cold air cloudiness, which is sinking to the rear of the cloudiness from SE England into the Bay of Biscay but sharply rising within the cloud areas of B and R1. The most spectacular rising area is in the area of cloud development within B over E. France and W. Switzerland.
|
04 July 1997/18.00 UTC - Meteosat IR image; position of vertical cross section indicated
|
04 July 1997/18.00 UTC - Vertical cross section; black: isentropes (ThetaE), blue: relative humidity, orange thin: IR pixel values, orange thick: WV pixel values
|
|

|
|
|
|
04 July 1997/18.00 UTC - Meteosat IR image; magenta: relative streams 314K - system velocity 238° 12 m/s, yellow: isobars
|
|
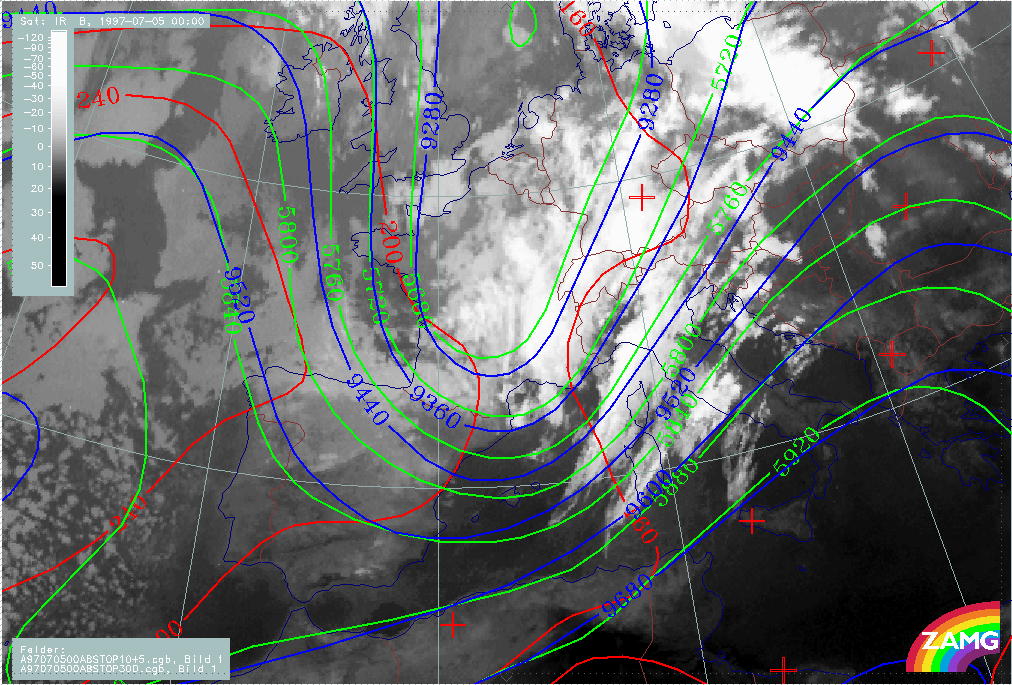
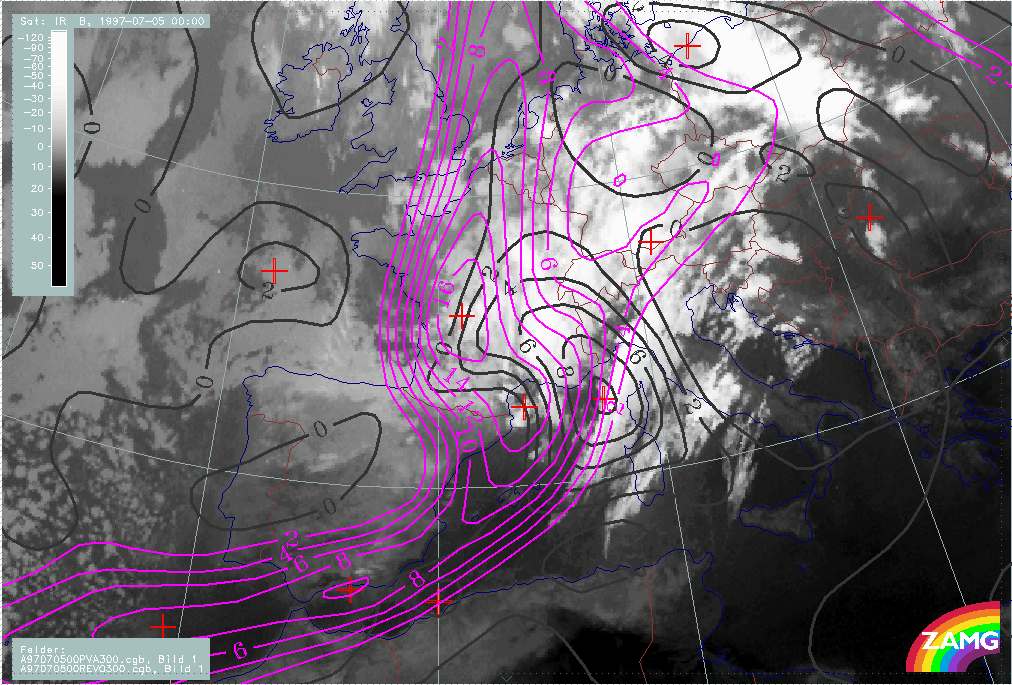
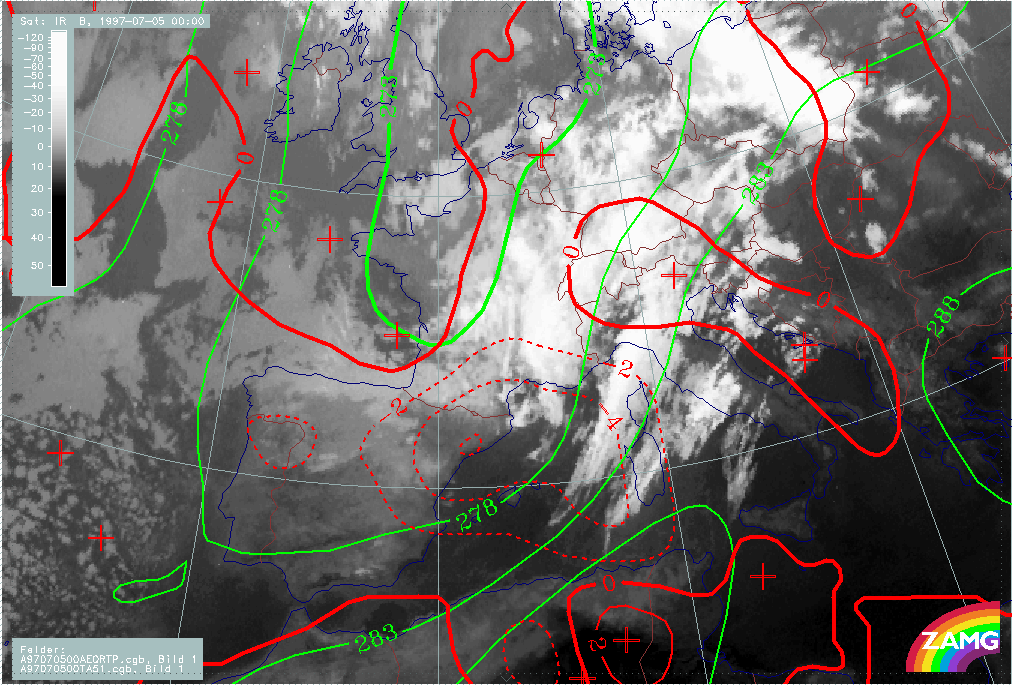
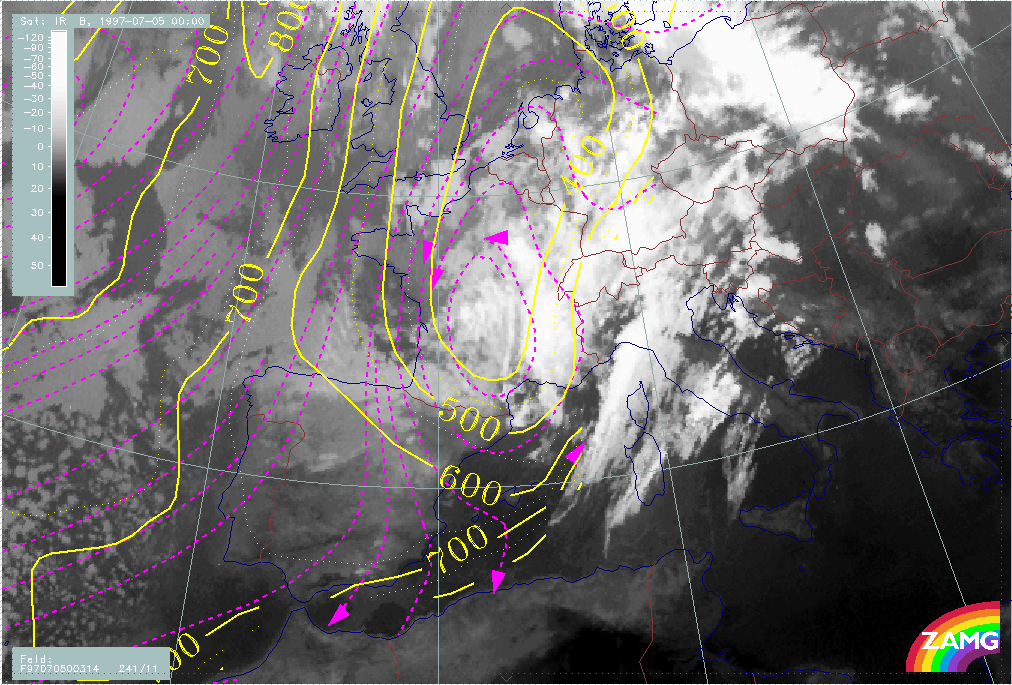
At 05 July/00.00 UTC, the cold air cloud band B takes on a distinct cyclonic curvature leading to the impression of an Occlusion process, although this is not at all supported by the genesis. The cloud band extends now from S. Germany across W. Switzerland to the W. Alps (France).
There is no change in the relation of the cloud systems to the pronounced upper level troughs nor the surface low pressure area. Although, as before, cloudiness area R1 is accompanied by a PVA maximum at 500 hPa, there is still no clear relation between the relevant fields at 500 hPa and the cloud band B. Only at 300 hPa a connection can be seen between the cloud band B and PVA. There is distinct correspondence between the intensified cloud area over the W. Alps and vorticity and PVA maxima caused mainly by curvature.
The relationship between the cold air cloud band B and thickness, TA and Showalter Index remains the same: The cloud band B is to the rear of the zone of high thickness gradient, but there is a new feature, namely a slight indication of a developing small scale thickness ridge, in the north-eastern parts of B. This is a configuration which supports an occlusion characteristic, although it has to be kept in mind that the genesis shows a completely different development.
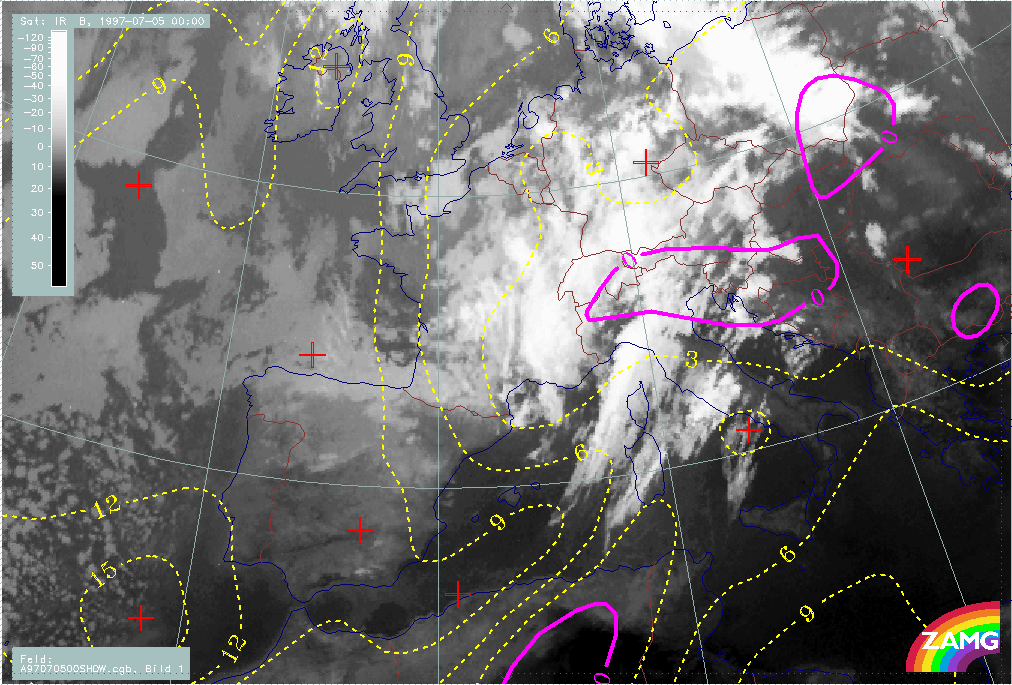
As before, the whole cloud band B lies within an area of Showalter values <3 units; only south of the Alps do lower values appear, characteristic for thunderstorm development. At this point of time the main rain area covers the whole of Switzerland with some thunderstorms south of the Alps. There are reports of precipitation along the northern side of the Alps in Bavarian as well as over S. France.
|
05 July 1997/00.00 UTC - Meteosat IR image; red: height contours 1000 hPa, green: height contours 500 hPa, blue: height contours 300 hPa
|
05 July 1997/00.00 UTC - Meteosat IR image; blue: vorticity 500 hPa, yellow: positive vorticity advection (PVA) 500 hPa
|
|
|
|
|
|
05 July 1997/00.00 UTC - Meteosat IR image; magenta: vorticity 300 hPa, black: positive vorticity advection (PVA) 300 hPa
|
05 July 1997/00.00 UTC - Meteosat IR image; green: equivalent thickness 500/1000 hPa, red solid: temperature advection - WA 1000 hPa, red dashed: temperature advection - CA 1000 hPa
|
|
05 July 1997/00.00 UTC - Meteosat IR image; yellow: Showalter index, magenta: Showalter index
|
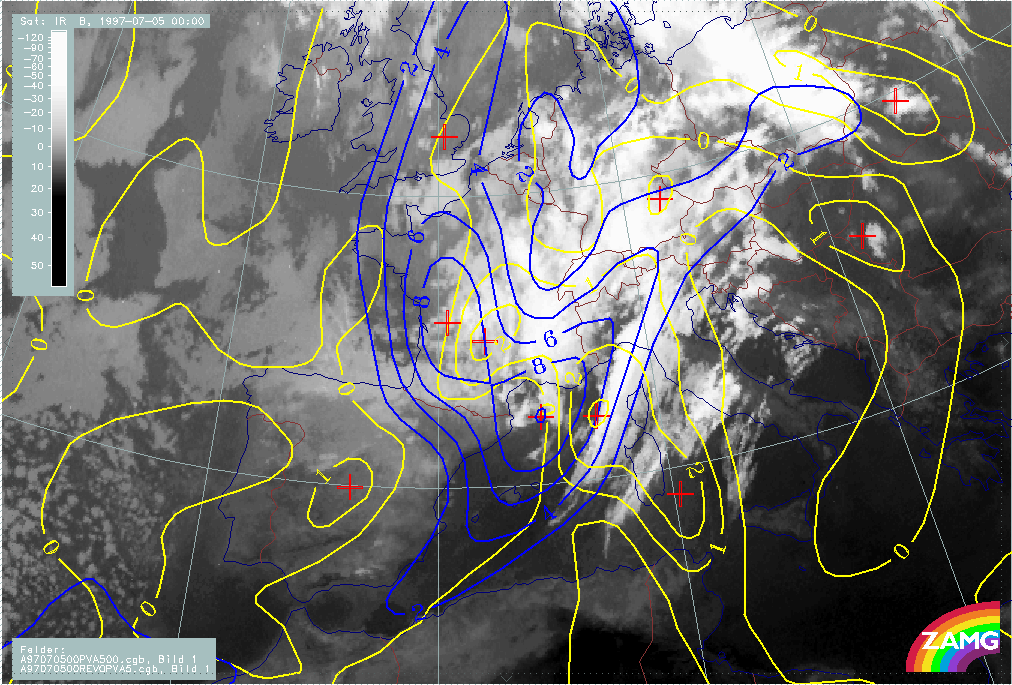
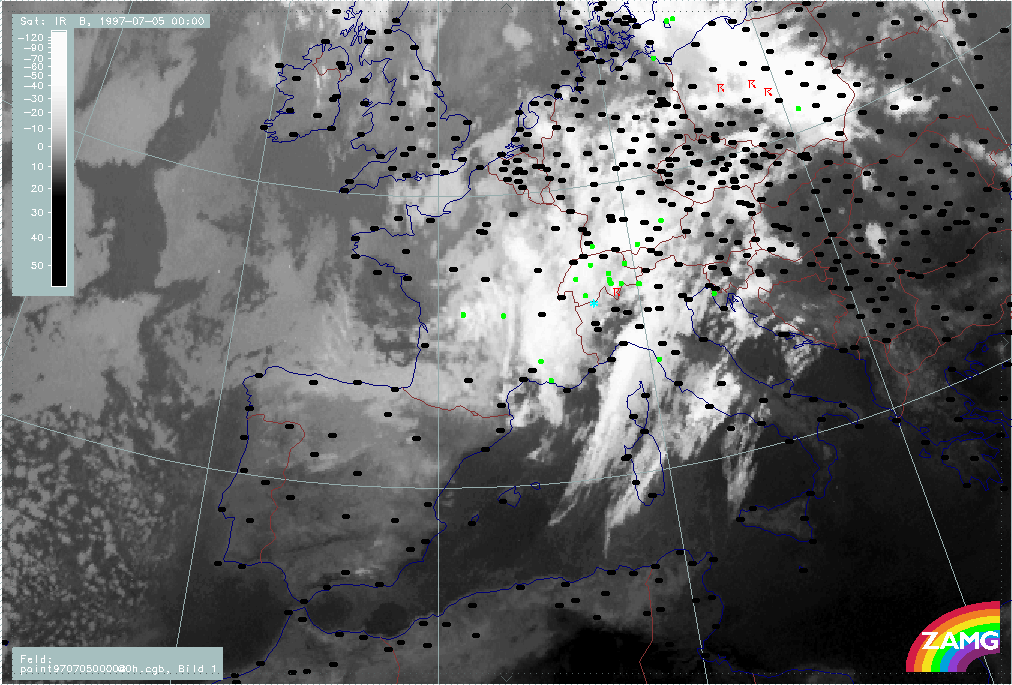
05 July 1997/00.00 UTC - Meteosat IR image; weather events (green: rain and showers, blue: drizzle, cyan: snow, red: thunderstorm with precipitation, purple: freezing rain, orange:
hail, black: no actual precipitation or thunderstorm with precipitation)
|
|
|
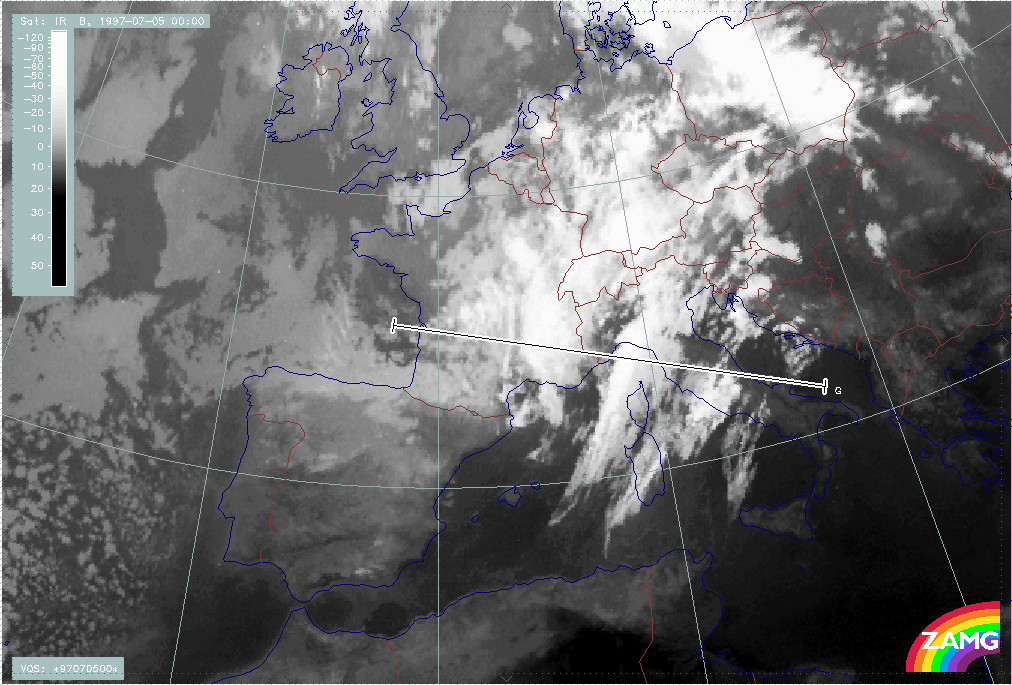
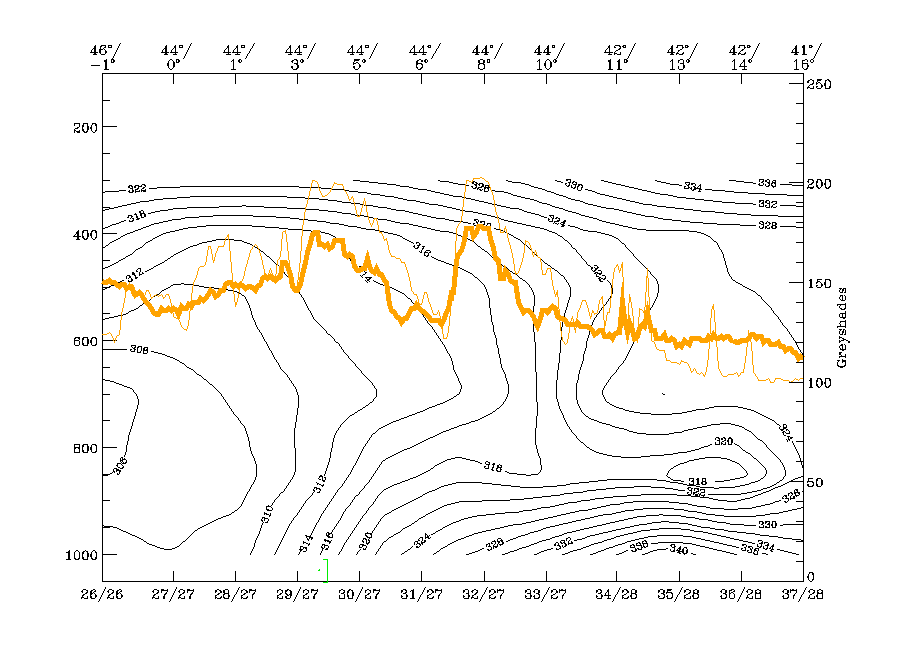
The relationship of cloudiness with the vertical cross section line is as before: from W to E crossing the southern parts of R1, the cyclonically curved part of B and the frontal cloud band. In addition to these areas, there is now increased cloudiness in the Warm Conveyor Belt area in front of the Cold Front.
All four peaks can be detected in the IR pixel values. The main features in the isentropes are the large unstable areas from the surface up to 700 hPa, and to even higher in the eastern parts and some indications of upper level fronts. The isentropic surface of 314K is especially representative of the cloud band B and can be detected down to 700 hPa.
On this surface the rising branch of a cyclonically curved conveyor belt in the cold air area is even more developed than before and is clearly associated with the intensification of cloudiness in B over E. France.
|
05 July 1997/00.00 UTC - Meteosat IR image; position of vertical cross section indicated
|
05 July 1997/00.00 UTC - Vertical cross section; black: isentropes (ThetaE), blue: relative humidity, orange thin: IR pixel values, orange thick: WV pixel values
|
|
|
|
|
|
05 July 1997/00.00 UTC - Meteosat IR image; magenta: relative streams 314K - system velocity 241° 11 m/s, yellow: isobars
|
|