29 July 1997 - Very Short Range Forecast (VSRF) Till 18.00 UTC
|
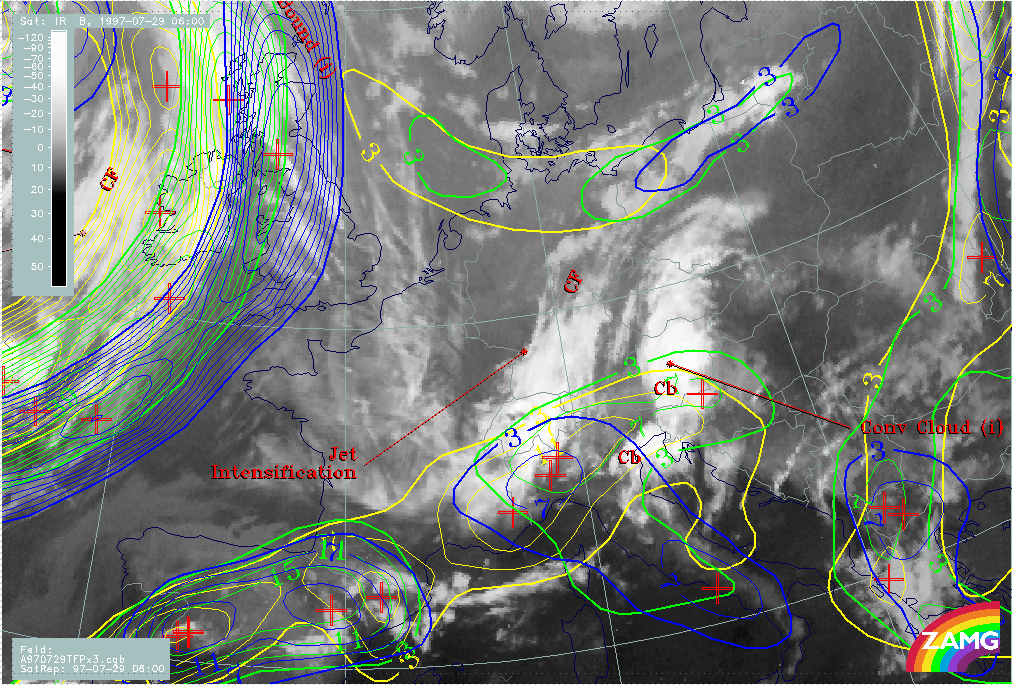
29 July 1997/06.00 UTC - Meteosat IR image; yellow: thermal front parameter (TFP) 500/850 hPa 06.00 UTC, green: thermal front parameter
(TFP) 500/850 hPa 12.00 UTC, blue: thermal front parameter (TFP) 500/850 hPa 18.00 UTC
|
|
|
The propagation of the TFP (image above) from 06.00 UTC (yellow) to 12.00 UTC (green) and finally to 18.00 UTC (blue) shows the quick eastward displacement towards England of the Cold Front on the west side of the image.
The TFP south of the Alps, indicating merely an air mass boundary, remains constant with changes only in the eastern part between 12.00 UTC (green) and 18.00 UTC (blue).
|
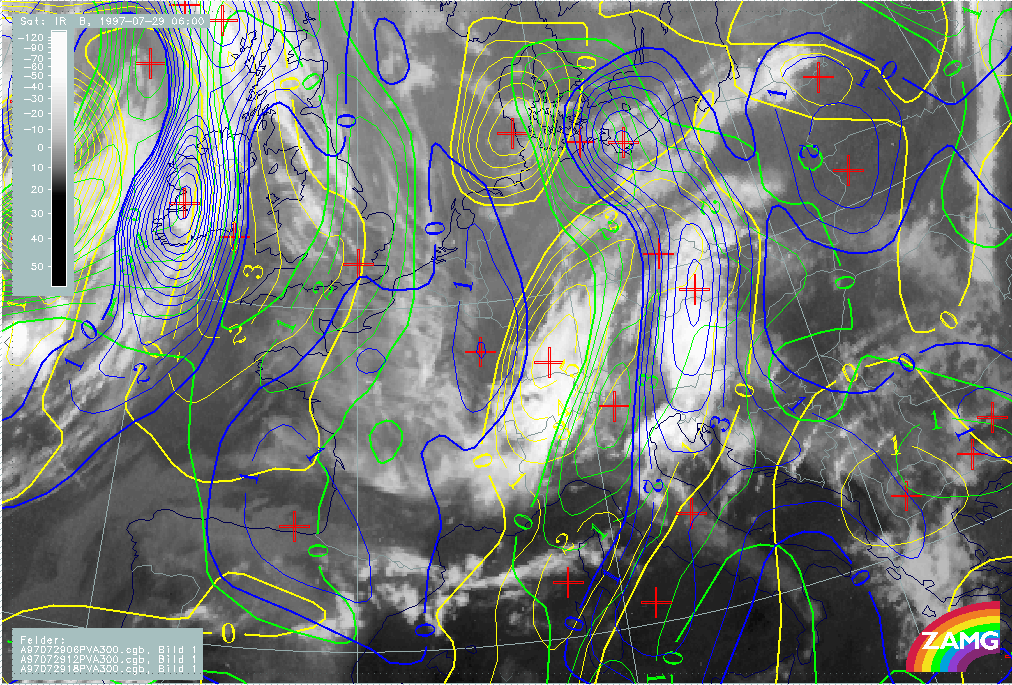
29 July 1997/06.00 UTC - Meteosat IR image; yellow: isotachs 300 hPa 06.00 UTC, green: isotachs 300 hPa 12.00 UTC, blue: isotachs 300
hPa 18.00 UTC, black solid: positive vorticity advection (PVA) 300 hPa 06.00 UTC, black dashed: positive vorticity advection (PVA) 300
hPa 12.00 UTC, black solid: positive vorticity advection (PVA) 300 hPa 18.00 UTC
|
29 July 1997/06.00 UTC -Meteosat IR image; yellow: positive vorticity advection (PVA) 300 hPa 06.00 UTC, green: positive vorticity
advection (PVA) 300 hPa 12.00 UTC, blue: positive vorticity advection (PVA) 300 hPa 18.00 UTC
|
|
|
|
|
|
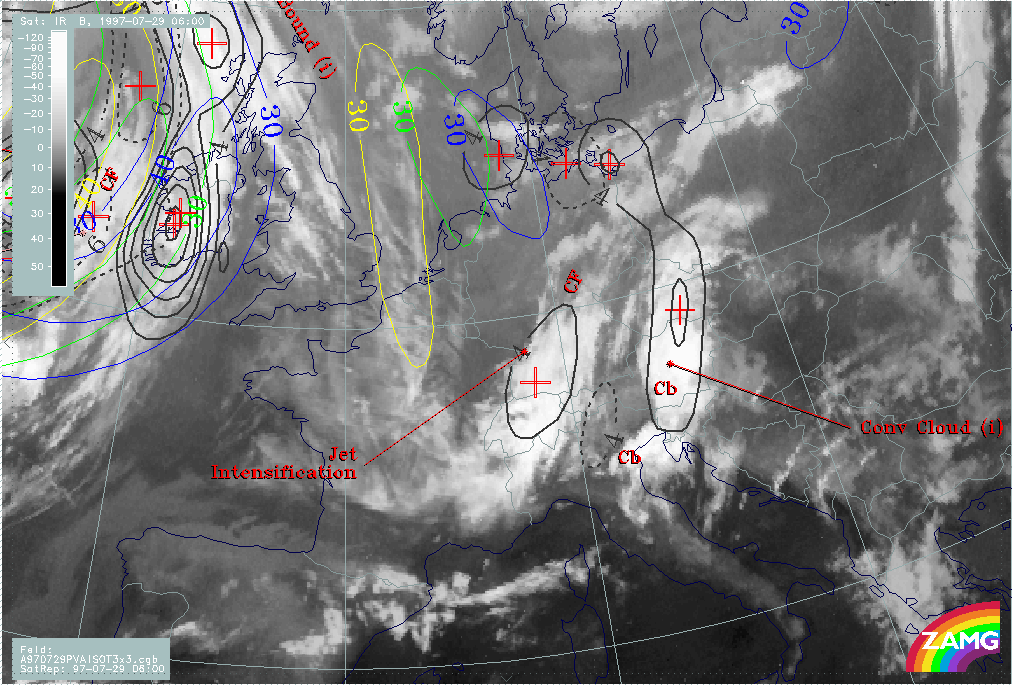
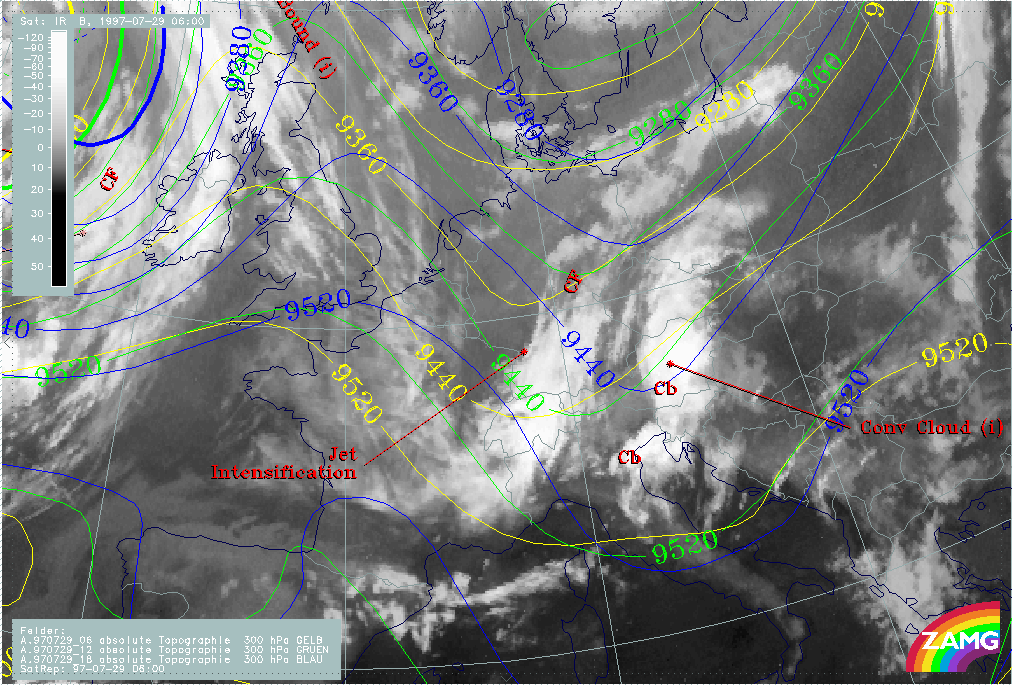
29 July 1997/06.00 UTC - Meteosat IR image; yellow: height contours 300 hPa 06.00 UTC, green: height contours 300 hPa 12.00 UTC, blue:
height contours 300 hPa 18.00 UTC
|
|
Completely different results can be inferred from the displacement of upper level features:
- The top left image shows the propagation of the PVA maximum at 300 hPa with a south-eastward displacement across west Austria to east Austria and Slovenia. The black lines enclose an area of more than 4 units.
- Looking at the complete PVA field (right image top) the intensity of the maximum shows up quite clearly.
- As not only the jet streak was responsible for development and intensification of the cloud system, the propagation of the upper level trough is also followed (left image bottom) showing a displacement of the trough from Germany - France at 06.00 UTC across Germany - W. Austria at 12.00 UTC to a position from Poland across east Austria and Slovenia to middle Italy. From this, a propagation of the conditions accompanying the western cloud system into the region of the eastern cloud system can be concluded.
|
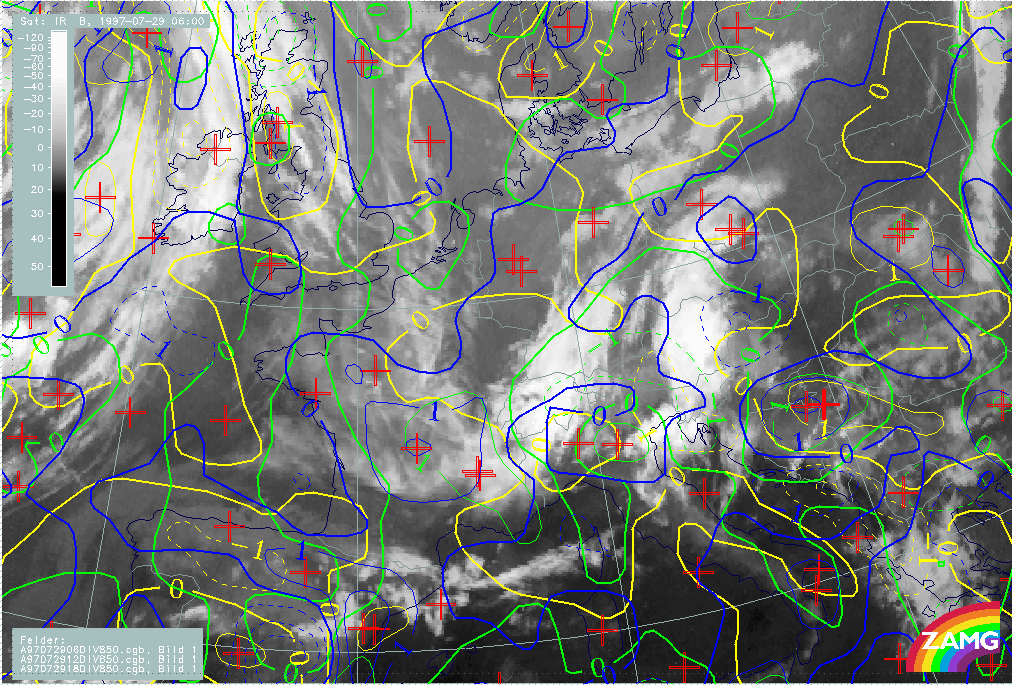
29 July 1997/06.00 UTC - Meteosat IR image; yellow: divergence 850 hPa 06.00 UTC, green: divergence 850 hPa 12.00 UTC, blue: divergence
850 hPa 18.00 UTC
|
|
|
For the forecast of the eastern cloud system convergence at 850 hPa can be taken into account (image above). There is no notable change between 06.00 and 12.00 UTC, with further convergence in the area of east Austria and Slovenia but a small eastward shift as well as a decrease in intensity between 12.00 and 18.00 UTC.
From both evaluations a mergence of the two cloud systems can be forecast or, in other words, the superposition of the upper level trough and jet features on the eastern convergence zone is likely.
|
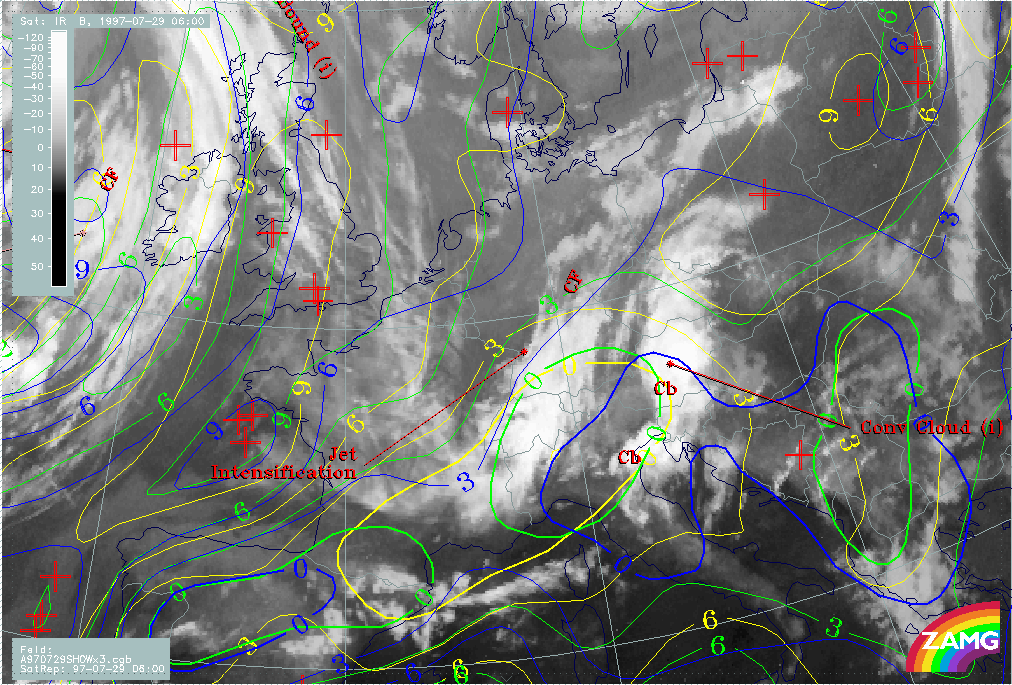
29 July 1997/06.00 UTC - Meteosat IR image; yellow: Showalter index 500/850 hPa 06.00 UTC, green: Showalter index 500/850 hPa 12.00
UTC, blue: Showalter index 500/850 hPa 18.00 UTC
|
|
|
The image above gives hints for the VSRF of lability with help of the Showalter index. Extended areas with high probability of thunderstorm development remain constant during the whole period; the most important result is that the area with Showalter <0 can be found more to the east for 18.00 UTC enclosing an area from south Austria across Slovenia and Croatia to Italy.