Synoptic Situation: Satellite Images, weather and basic numerical parameters
In between Greenland and Iceland a long frontal zone can be seen. This baroclinic zone will be activated by an overrunning PV anomaly. In the loop below the subsequent development of the considered cyclone can be seen
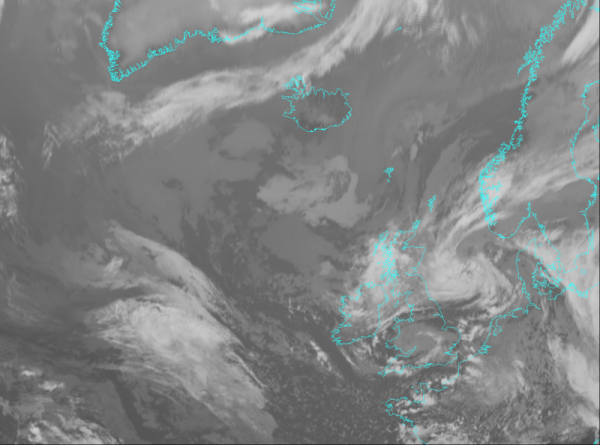
16 Oct 2004/12.00 UTC - MSG IR 10.8 image
|
IR Imagery (Meteosat 8 channel 10.8): time sequence
This chapter shows and describes the development of the cyclone in a sequence of 6-hourly images. In this time sequence it can be nicely seen that the pre-existing baroclinic zone starts to wave, and gradually becoming a mature frontal system as a consequence of the over running PV-anomaly.
WV Imagery (Meteosat 8 channel 6.2): time sequence
This chapter shows and describes the development of the cyclone in a sequence of 6-hourly images. This time sequence is very important for getting the clue of the case. Namely, in this WV-imagery the first sign of the existence of an upper level PV-anomaly can be seen!!! This anomaly is marked as a red broken line throughout the whole sequence.
Combined satellite imagery (Airmass RGB) : time sequence
This chapter describes the use of the Airmass RGB in the detection of higher levels of PV. The RGB composite that combines the best MSG features for the early detection of rapid cyclogenesis is the so-called "airmass" RGB, which combines the WV6.2 - WV7.3 Brightness Temperature Difference (BTD, on the red beam), the IR9.7 - IR10.8 BTD (on the green beam) and the WV6.2 channel (on the blue beam).
IR image height 1000 hPa: time sequence
In the following chapter the cloud configurations seen in satellite images are related to the basic field of surface pressure represented by geopotential height in 1000 hPa. 6-hourly sequences are shown.
Surface Analyses: time sequence
In the following chapter a sequence of surface analyses according to the Norwegian school can be seen.
IR image and synop: time sequence
As mentioned earlier, the amount of wind and precipitation associated to cyclones is important to forecasters. In the following set of images the Synop-data is related to the cloud configurations seen in satellite images in 6-hourly sequences.
Summary of the investigations in this chapter
In this chapter some important things should be summarized before going on:
- An old front can be recognized in the IR10.8 imagery, this can be identified as a pre-existing baroclinic zone. In the next chapter this idea will be judged with numerical model-fields
- In the WV6.2 Imagery very clearly an upper level feature can be seen, which was marked by dark shades in the WV-signal, indicating low tropopause heights. This must relate to heigh values of PV, indicating a PV anomaly and will be investigated in the next chapter.
- The surface charts show a development of an intensive cyclone southwest of Iceland, with an associated long-lasting strong wind-field in the NW and NE quadrant of the cyclone. The region of this windfield can be denoted as rather atypical.