Chapter VI: Radar data
Table of Contents
Introduction
Germany's 17 radar stations are very important for the processes of nowcasting and managing the warnings for convective and long-lasting precipitation. Some of the images they produce are introduced here.
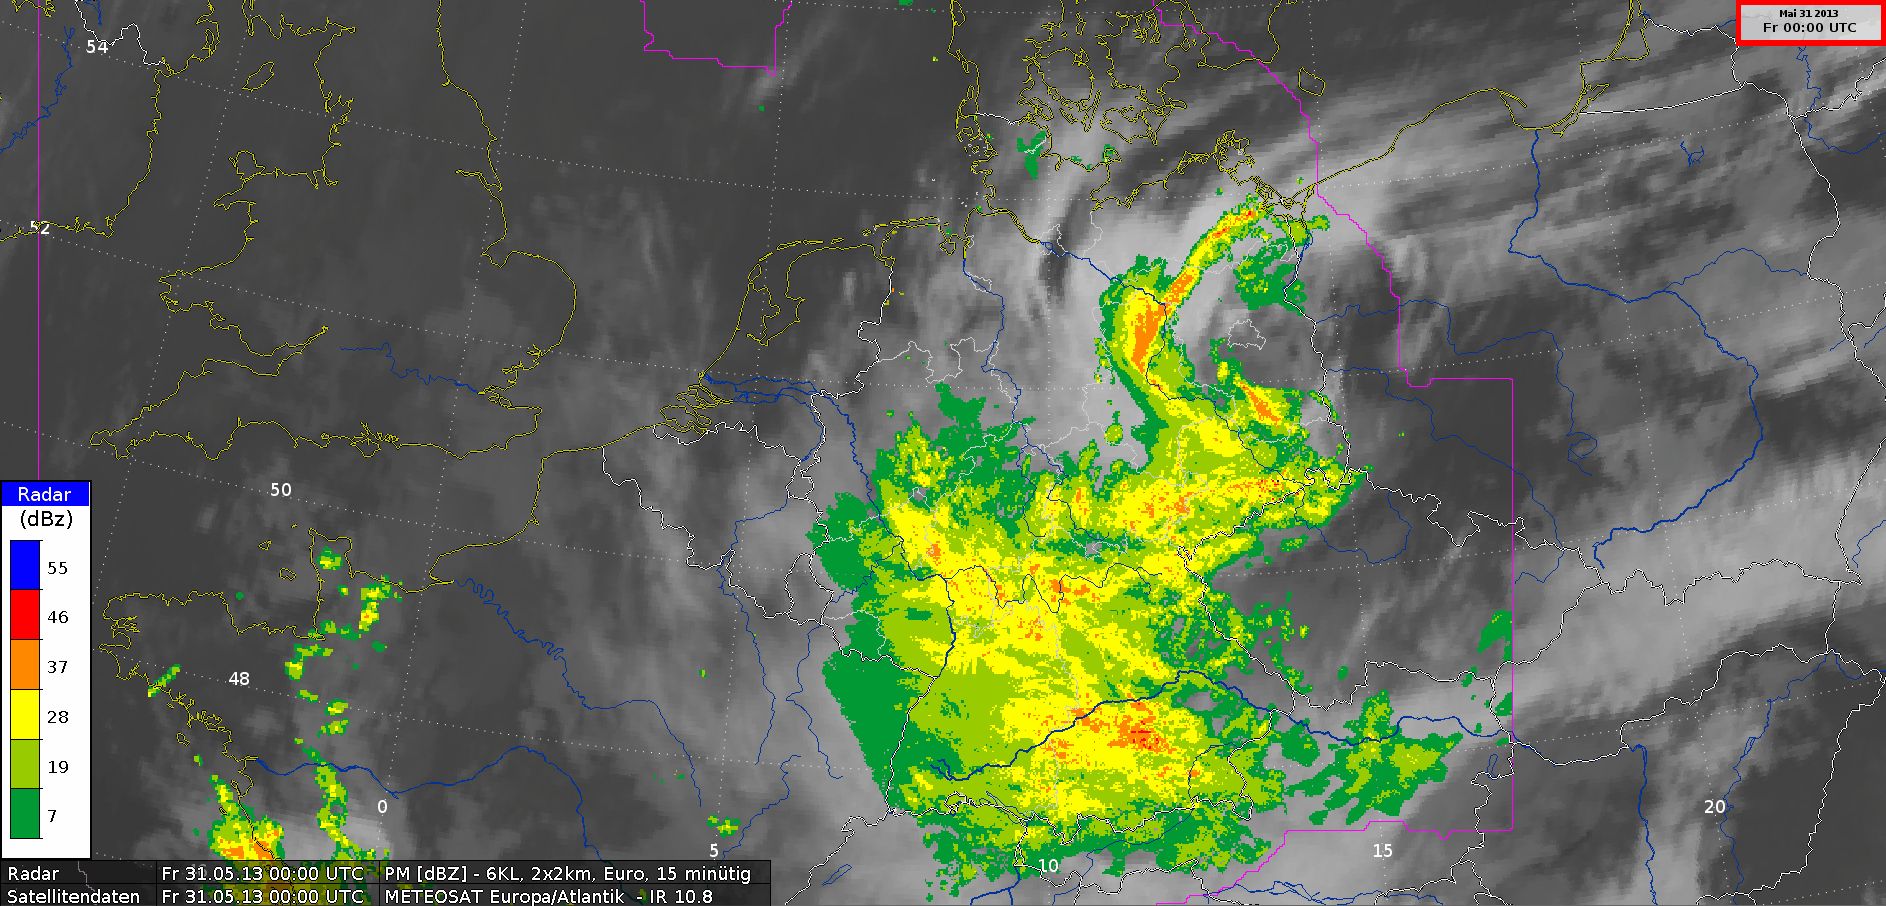
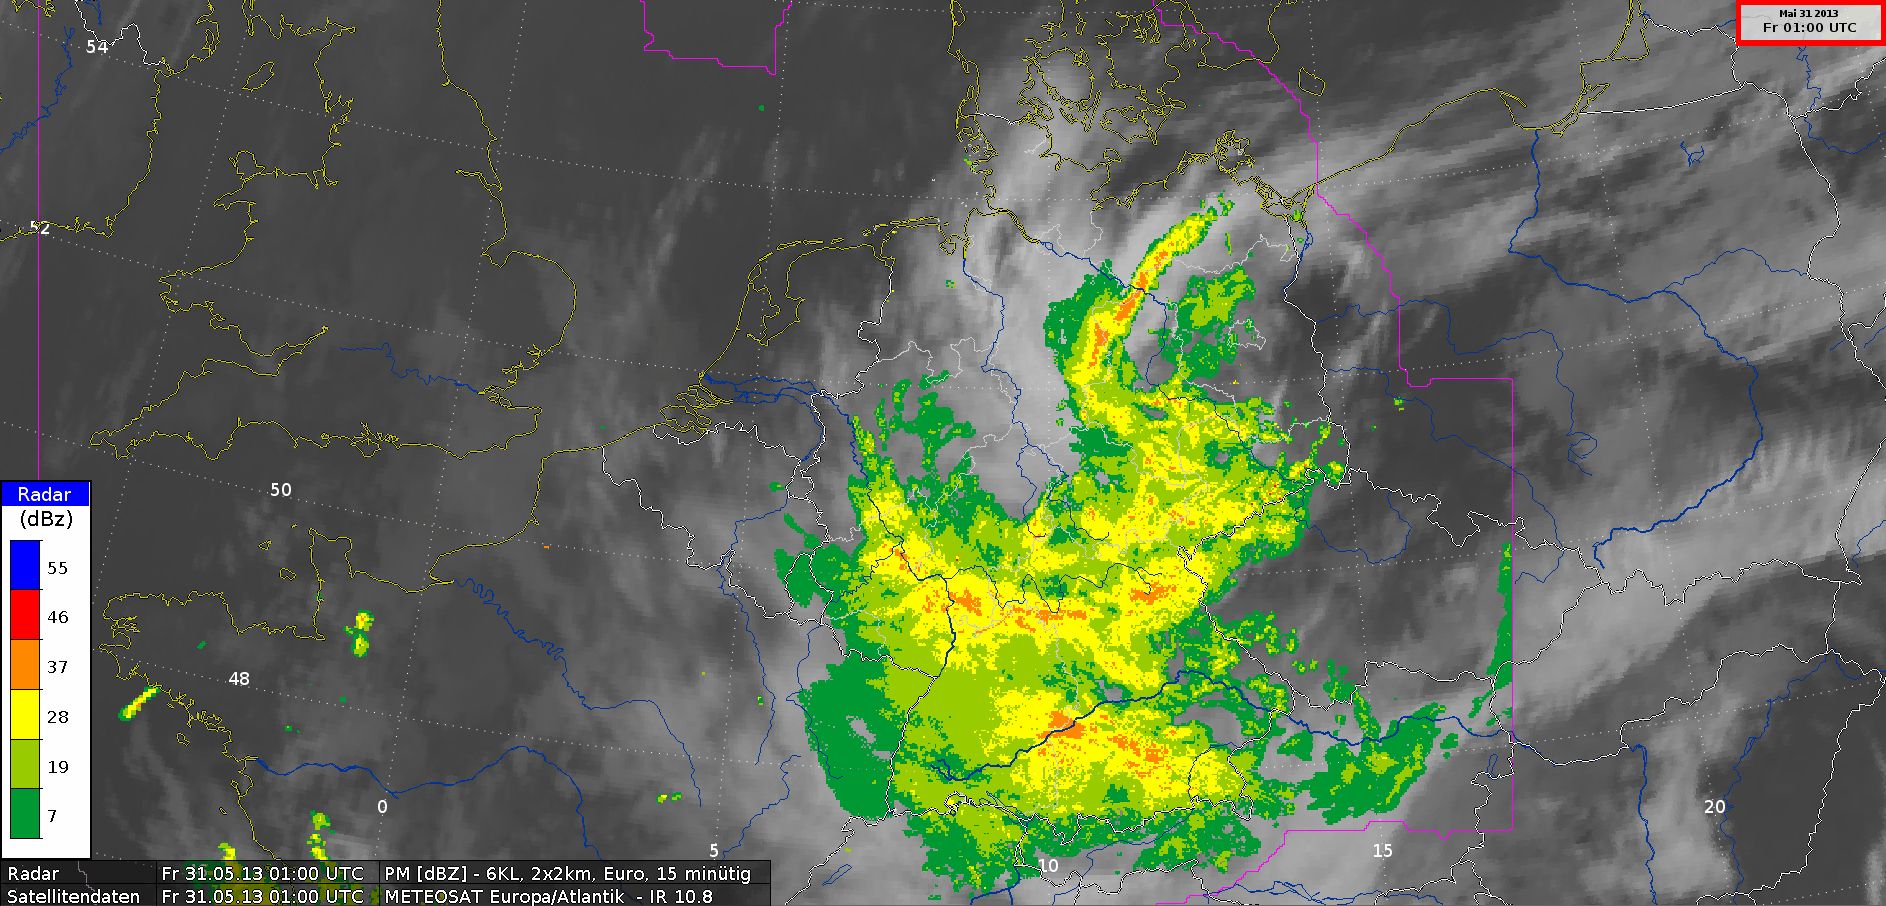
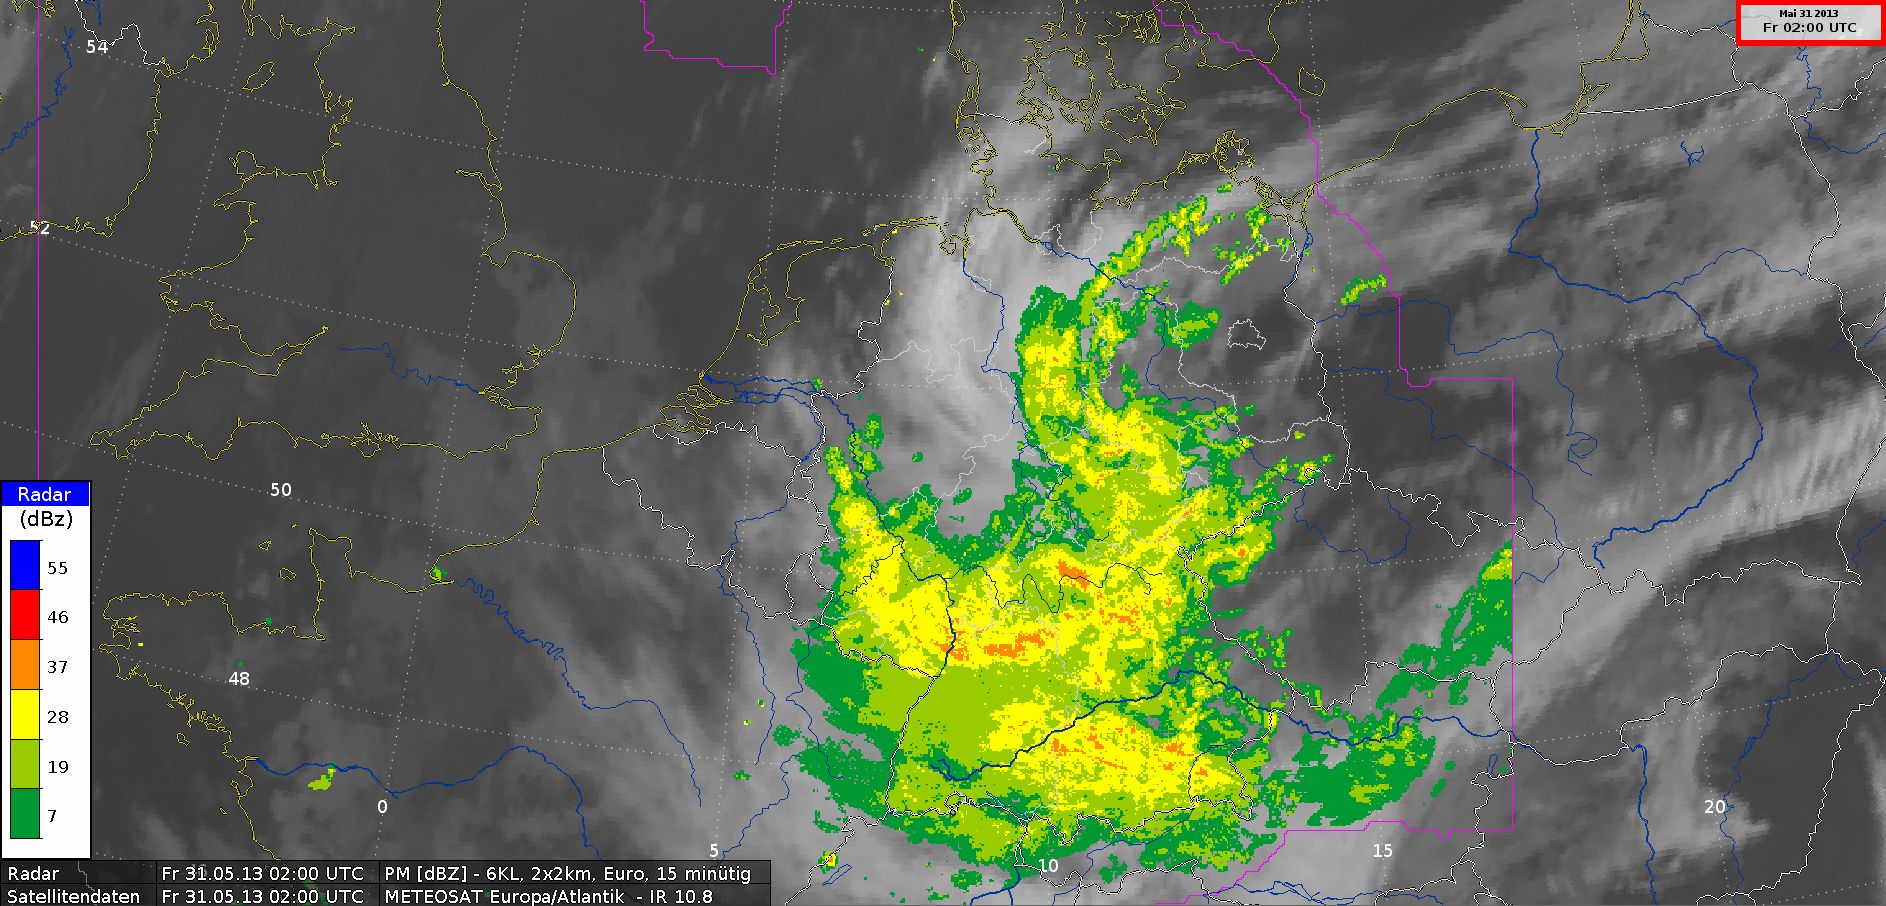
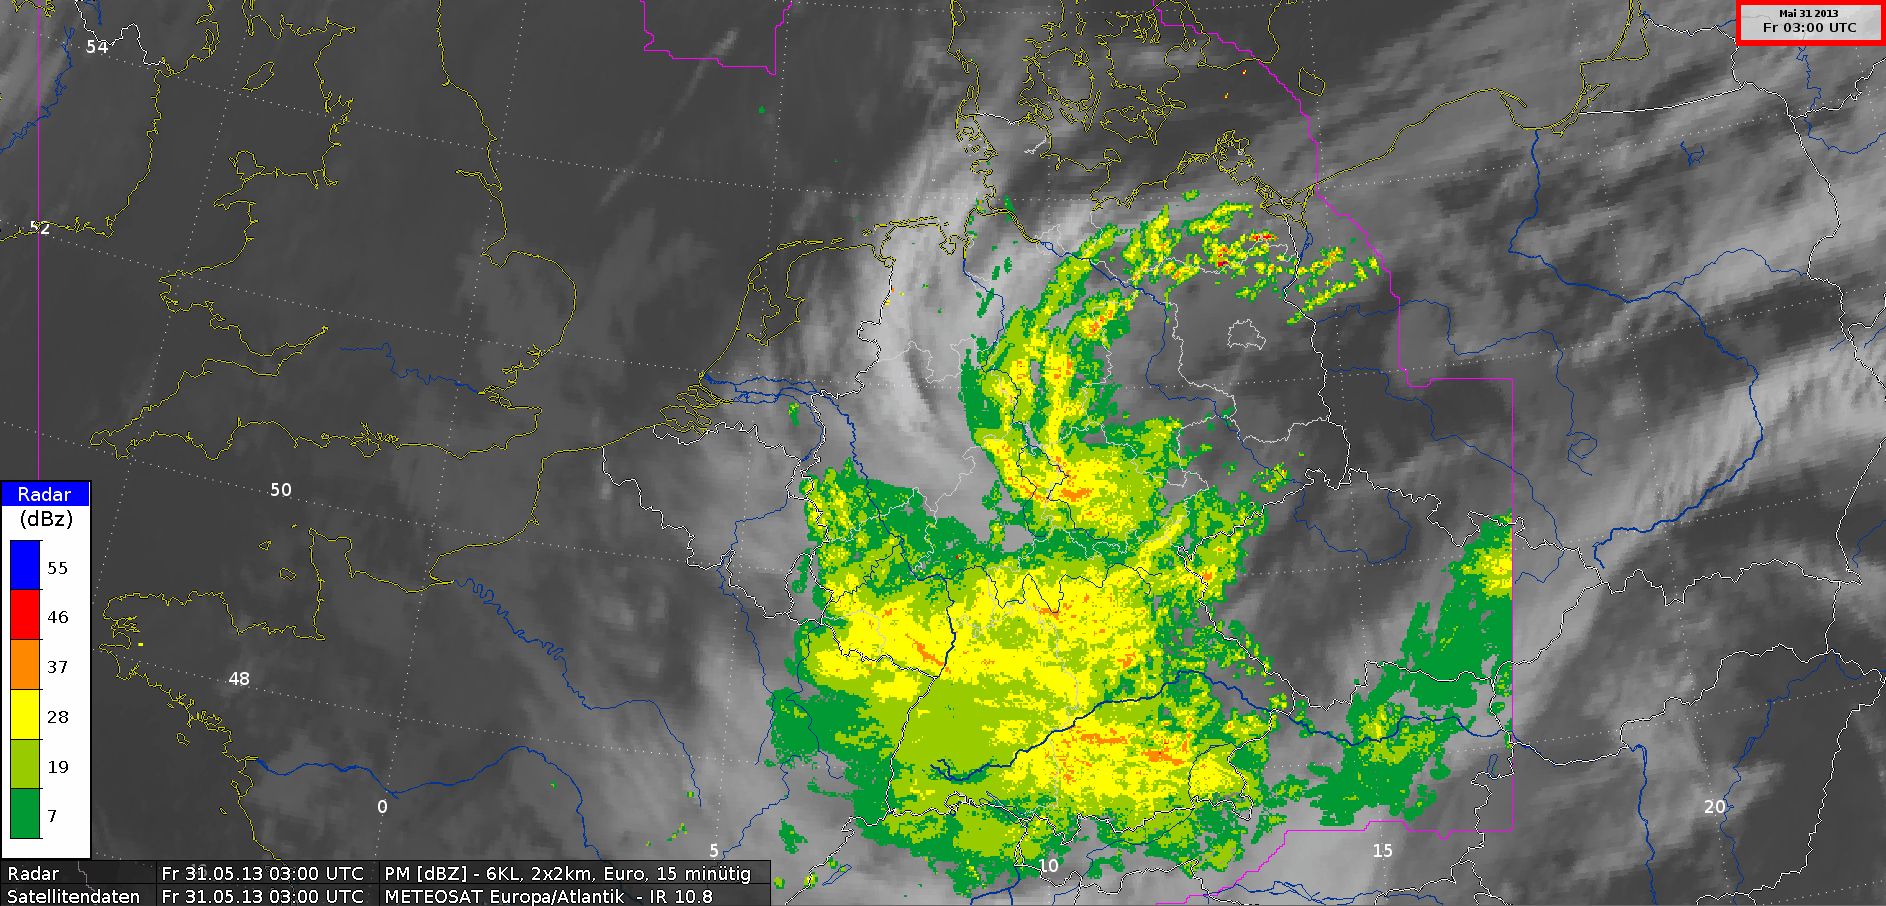
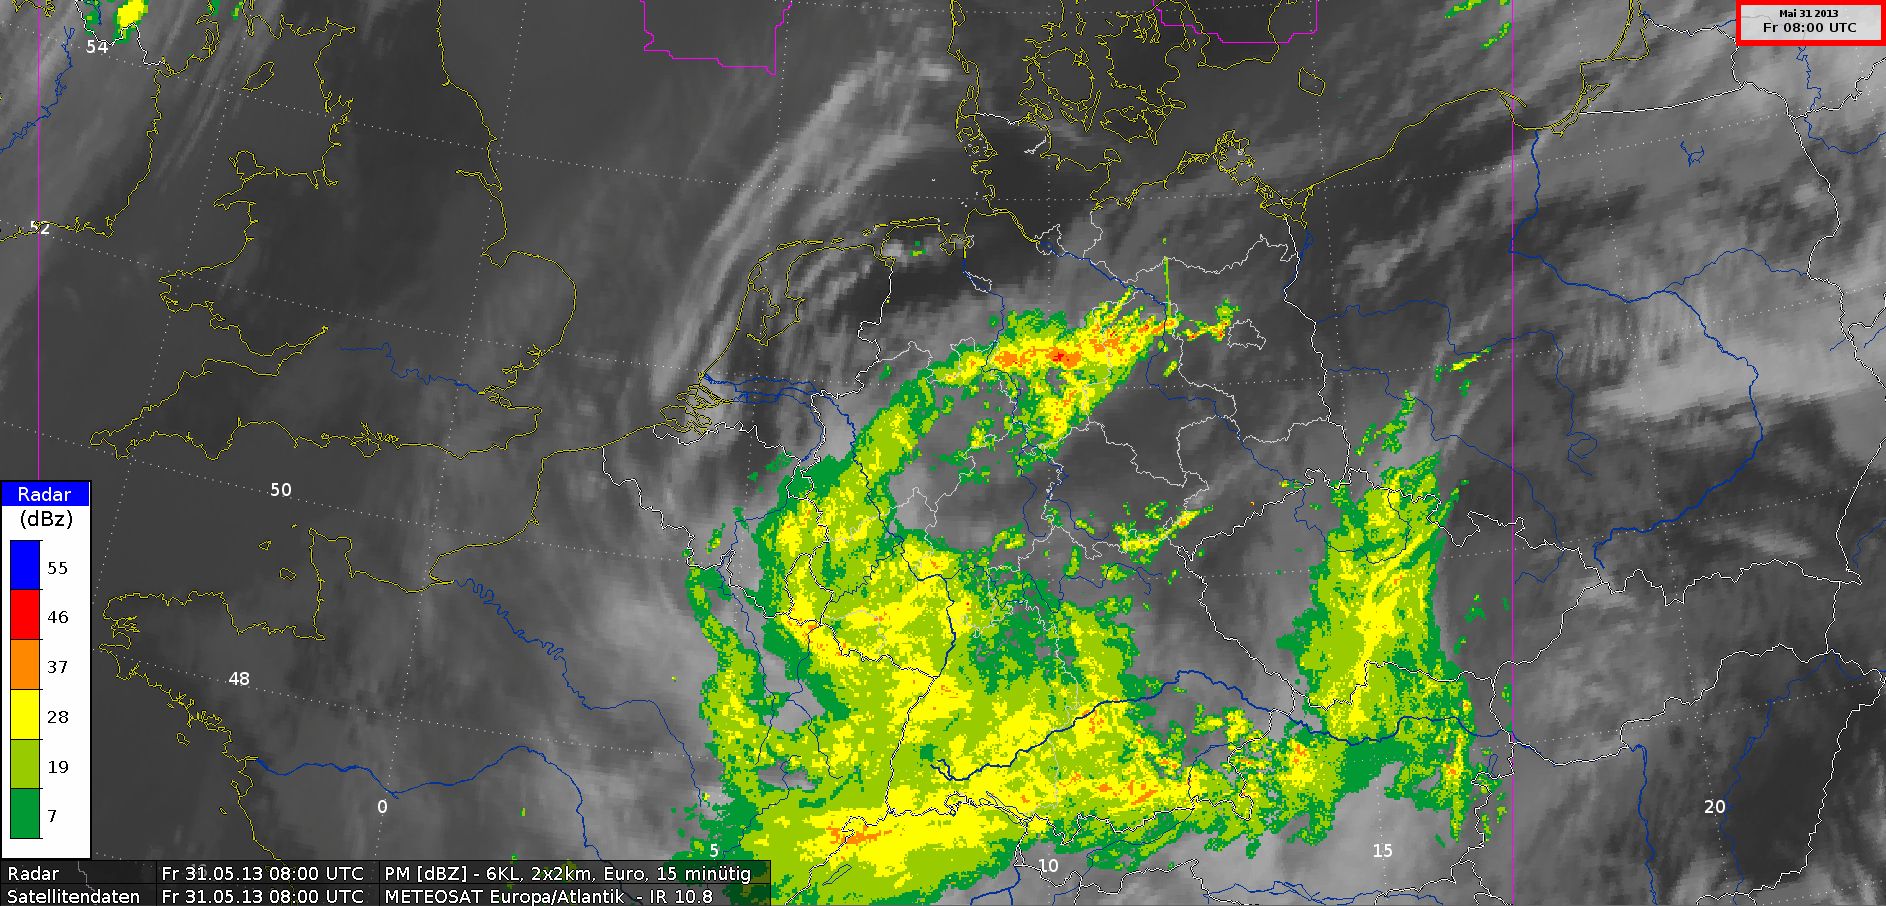
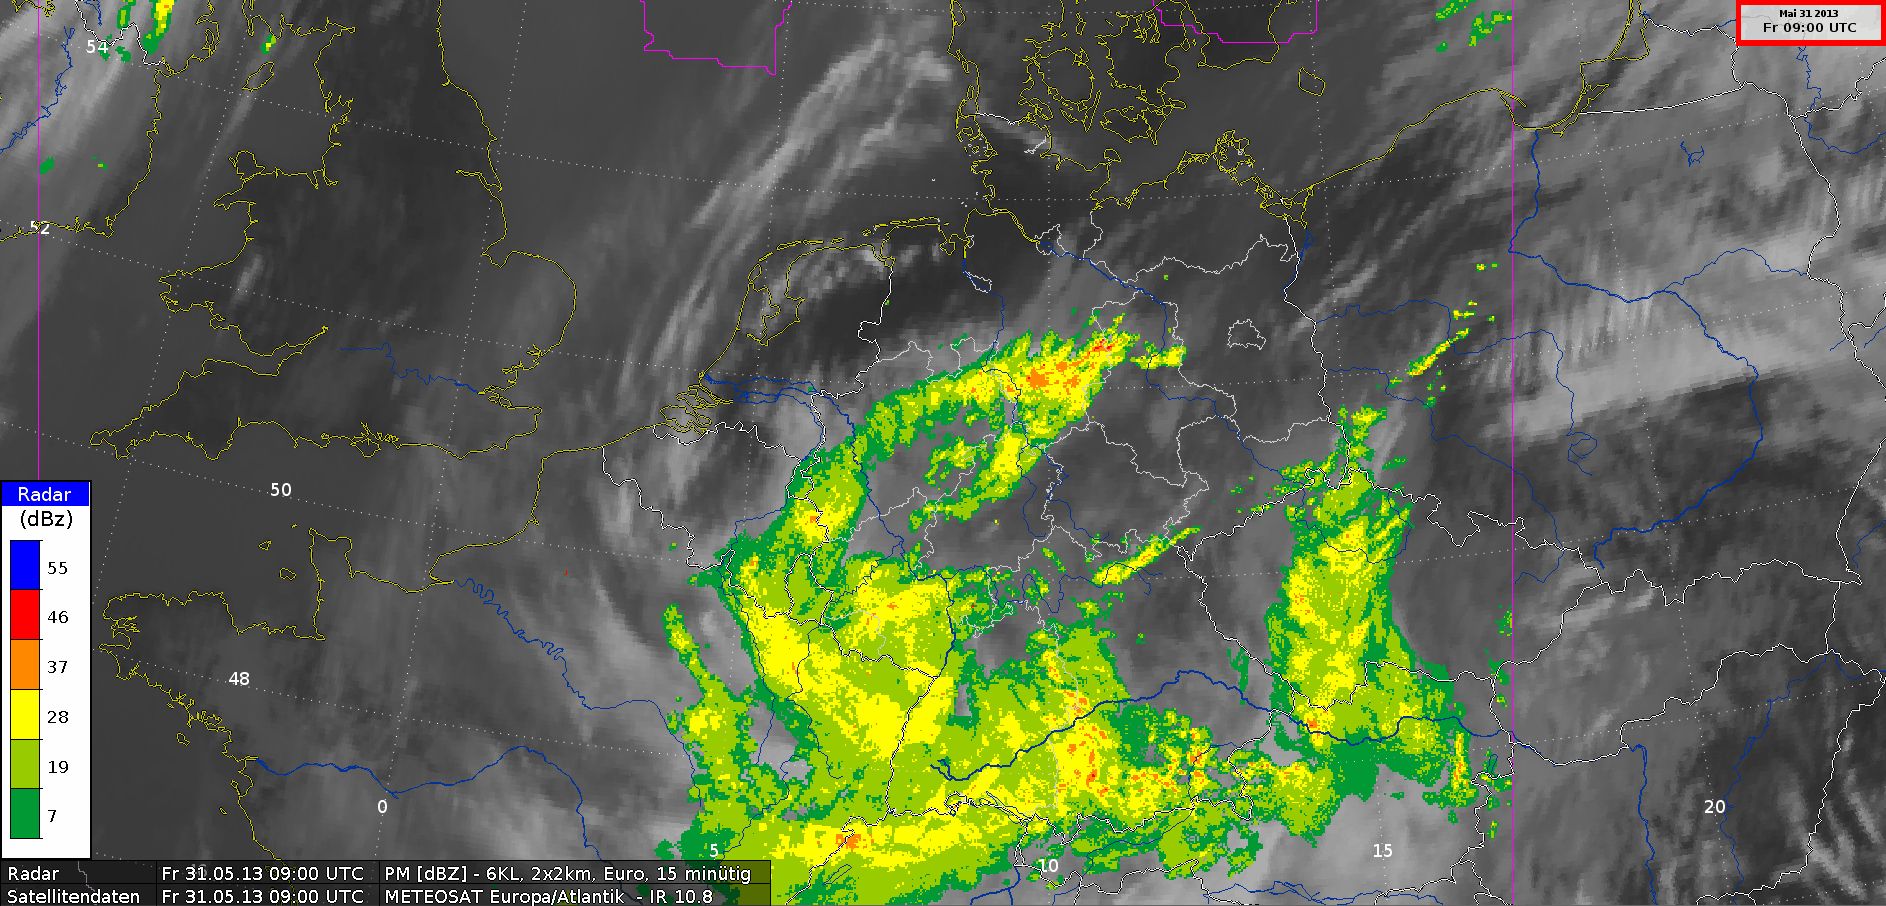
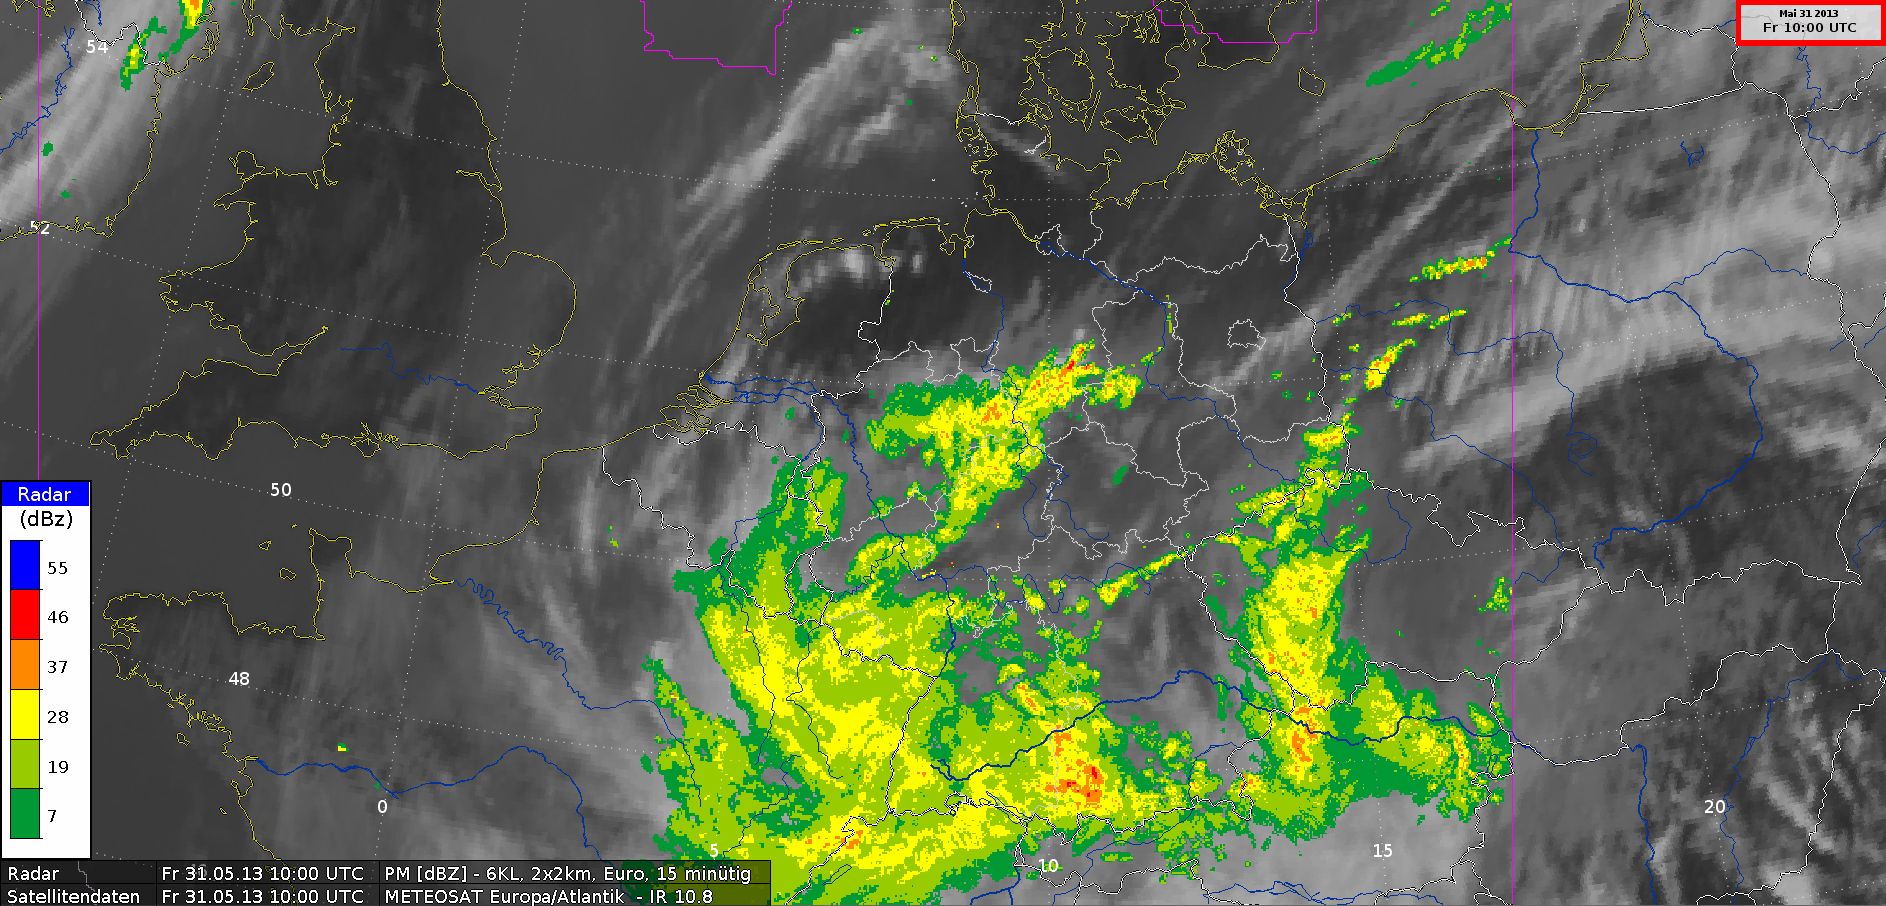
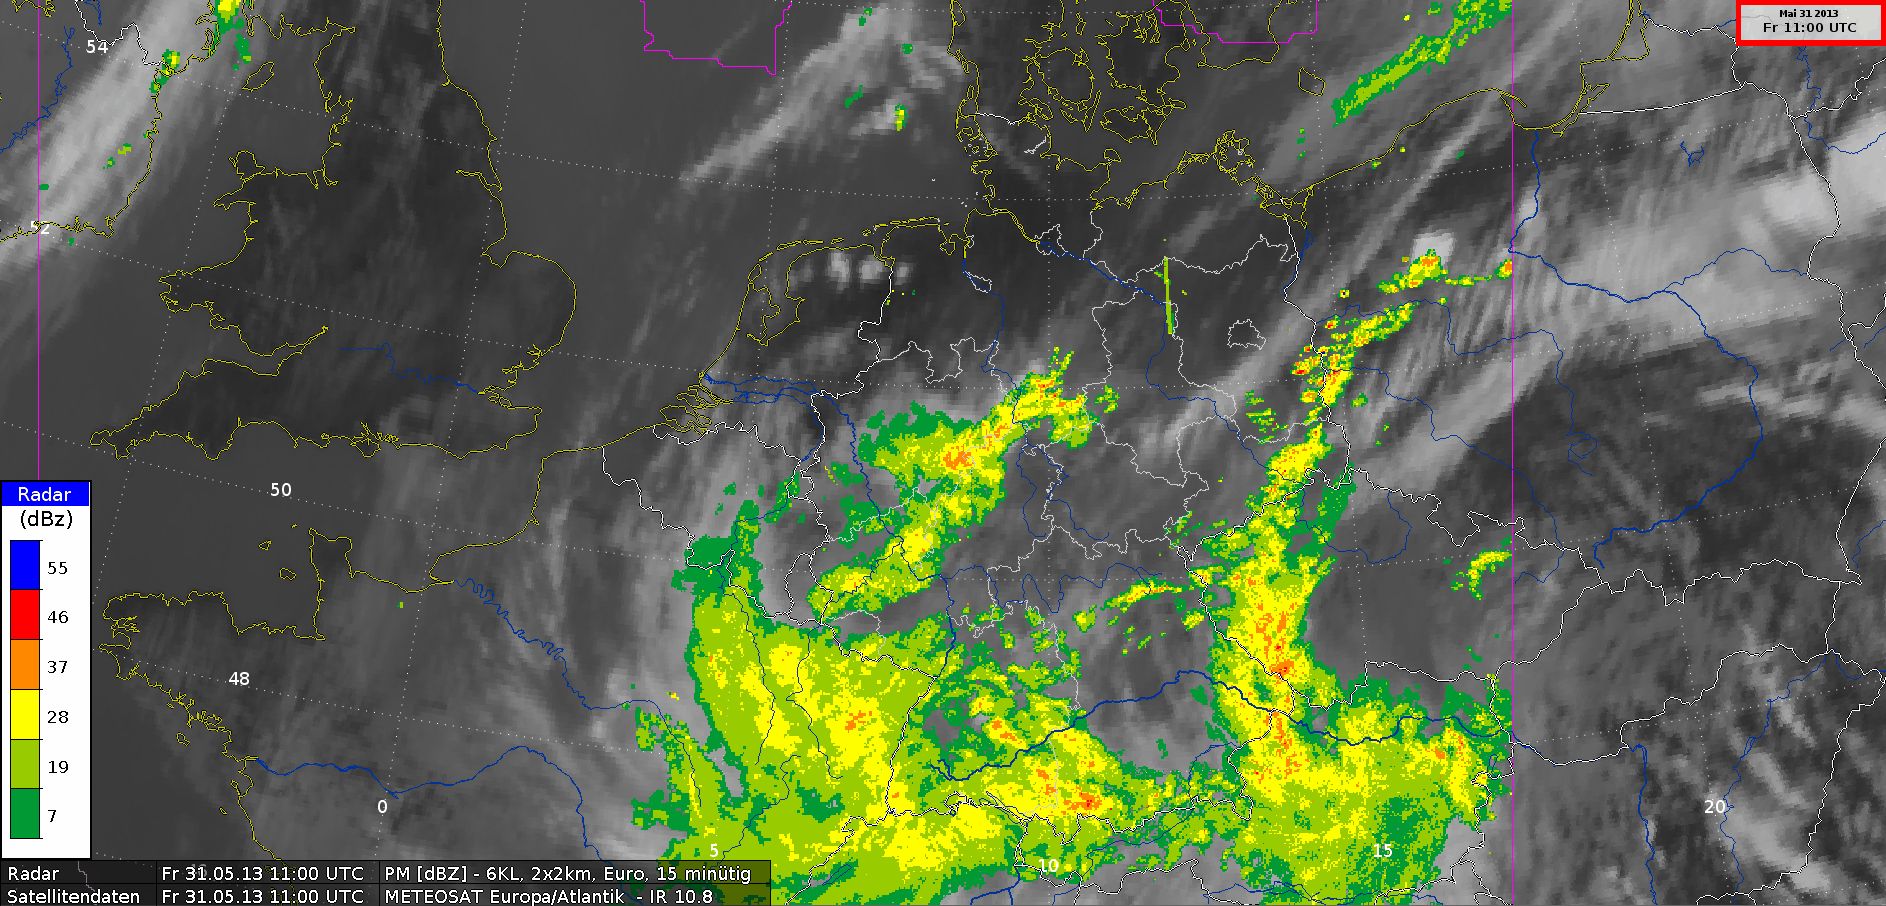
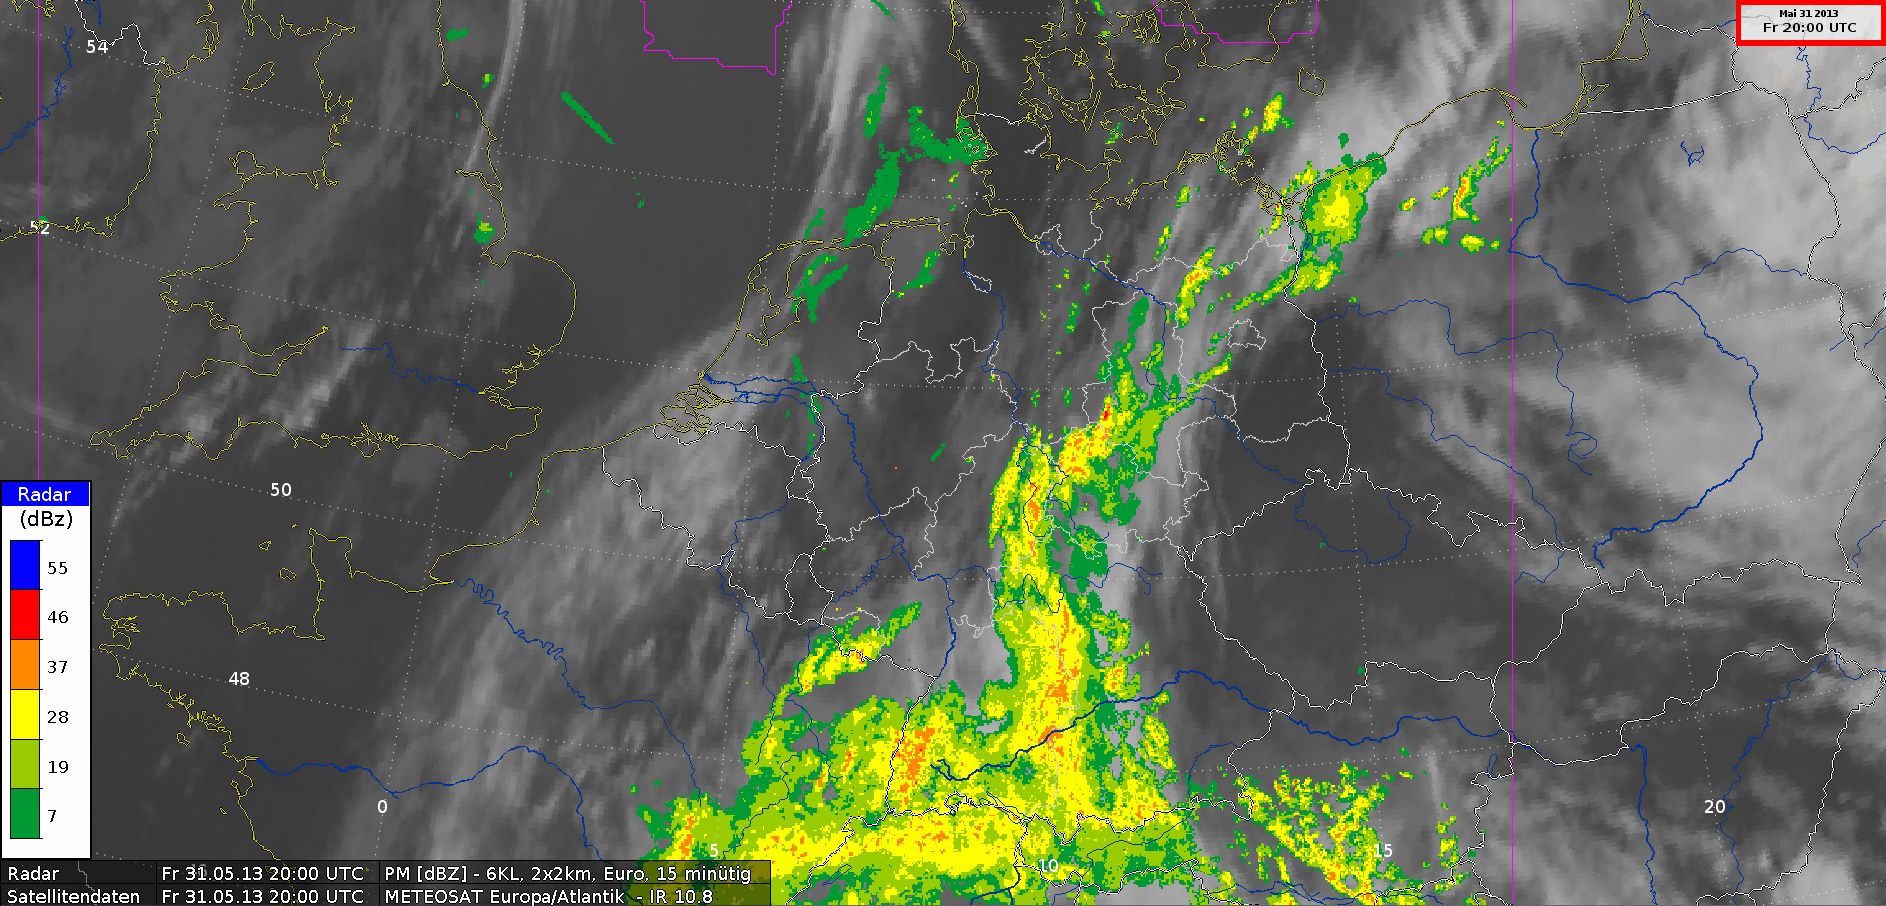
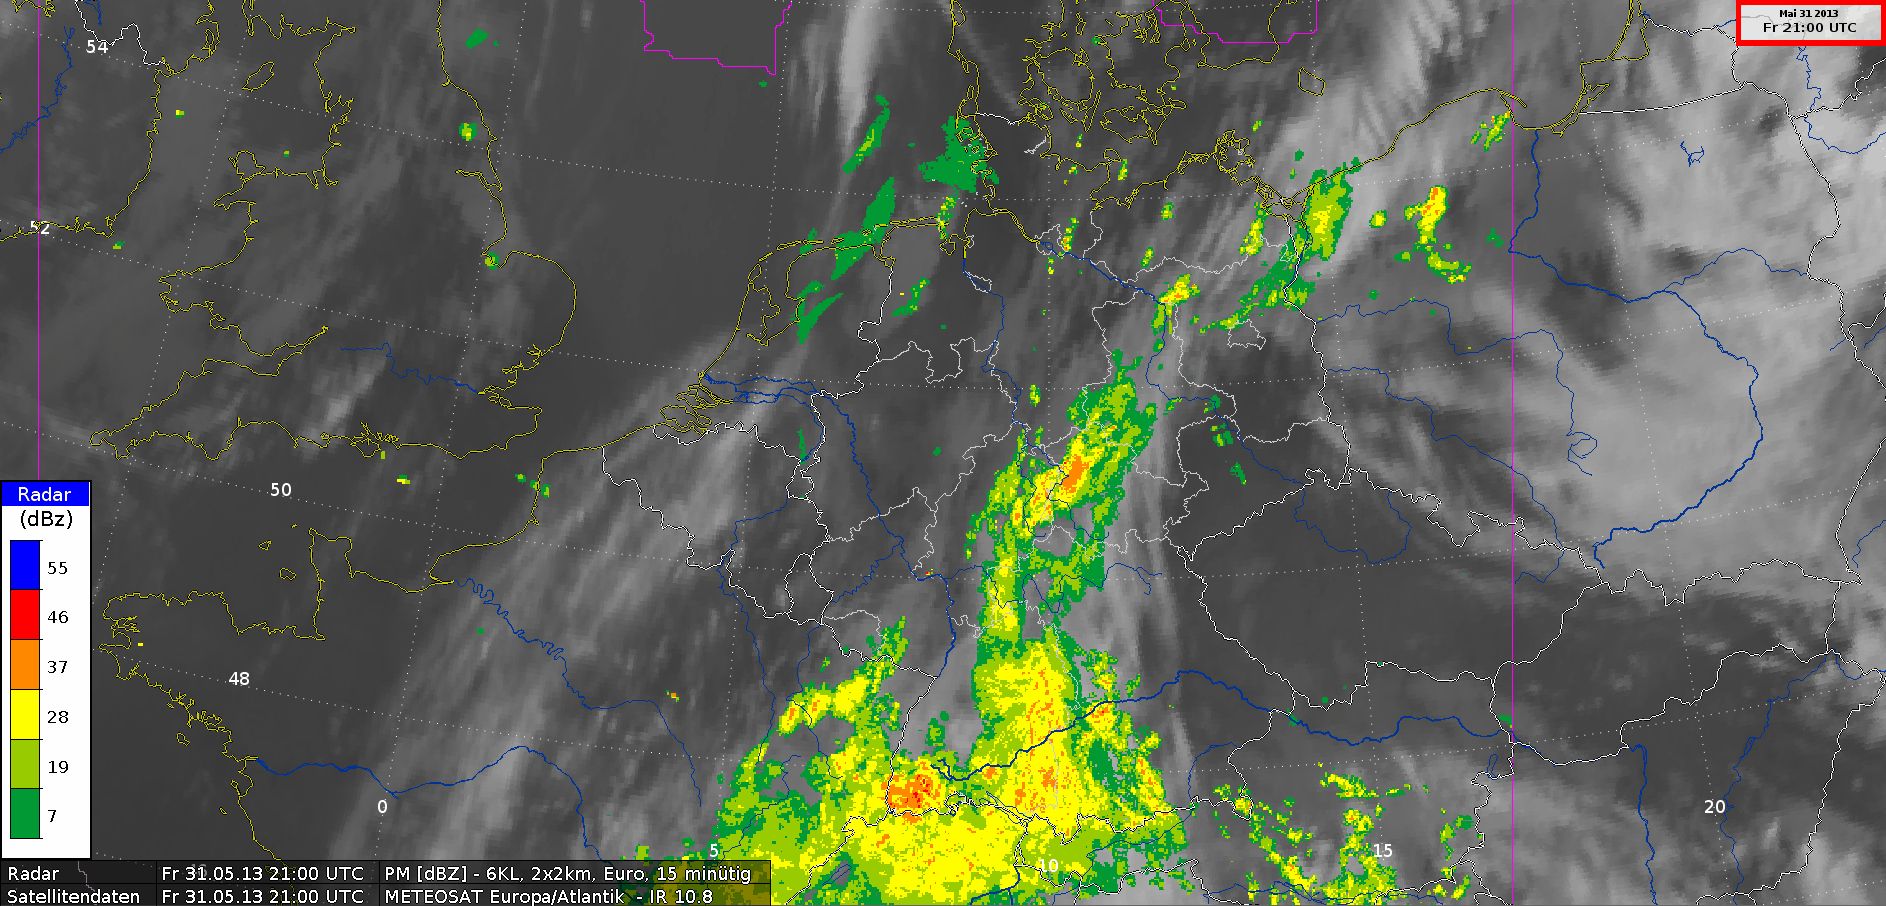
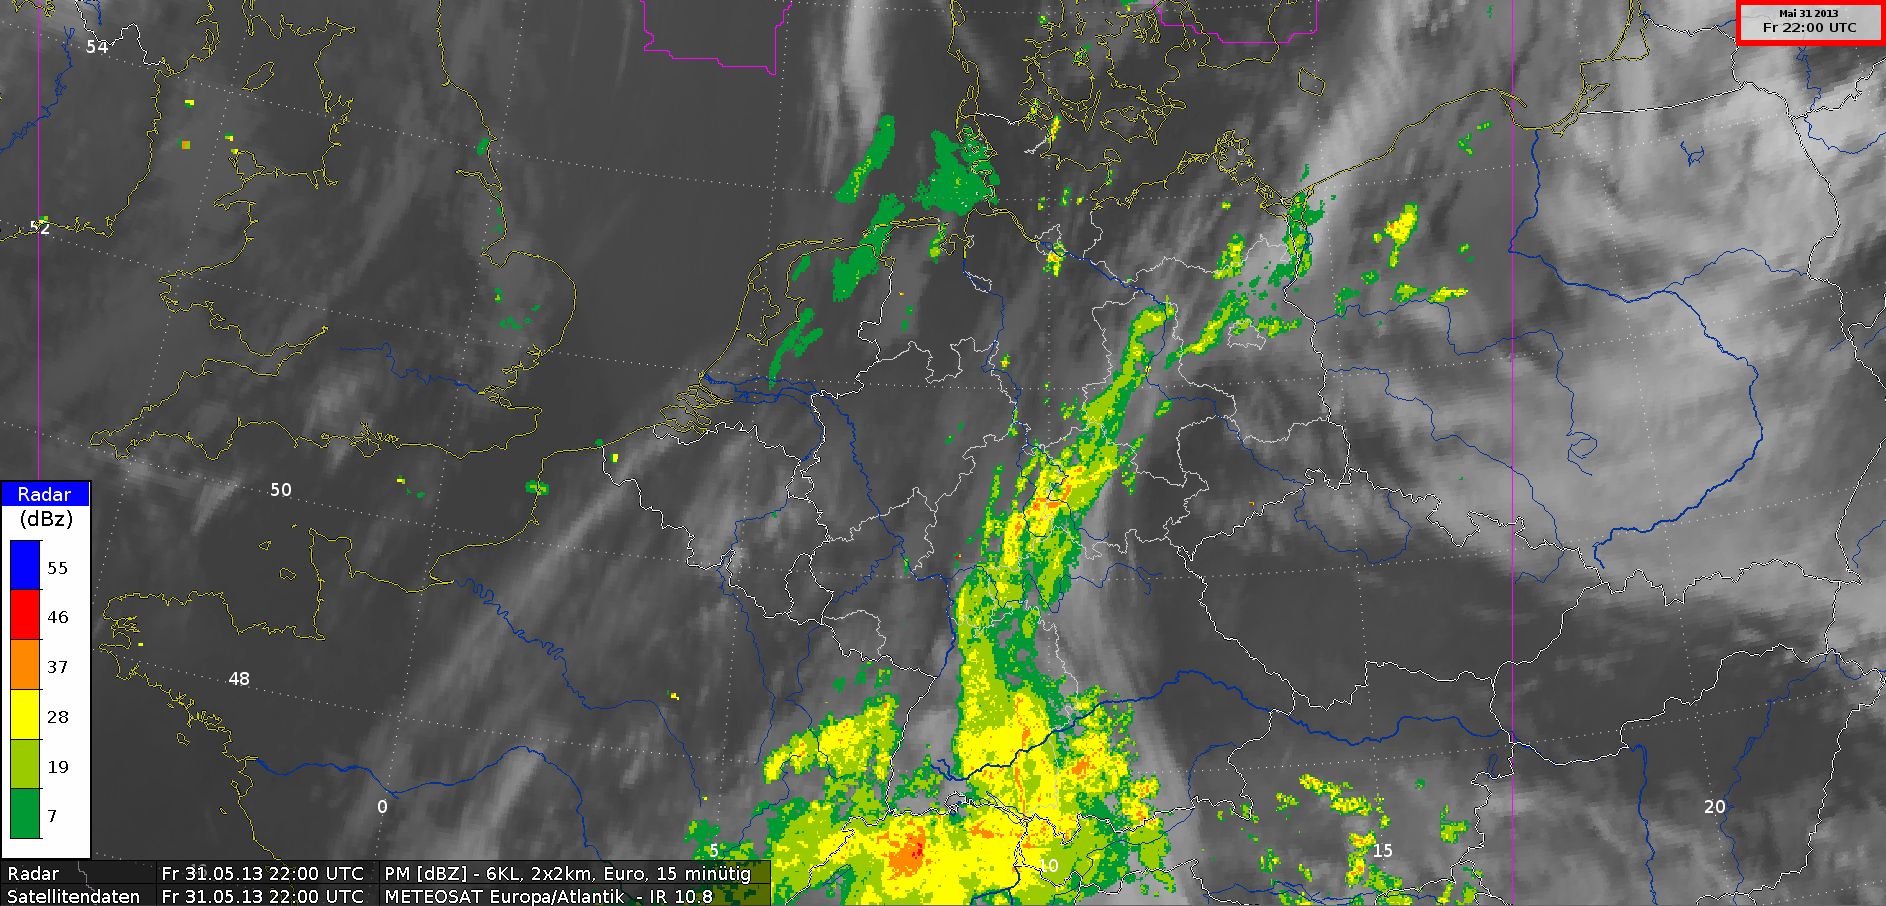
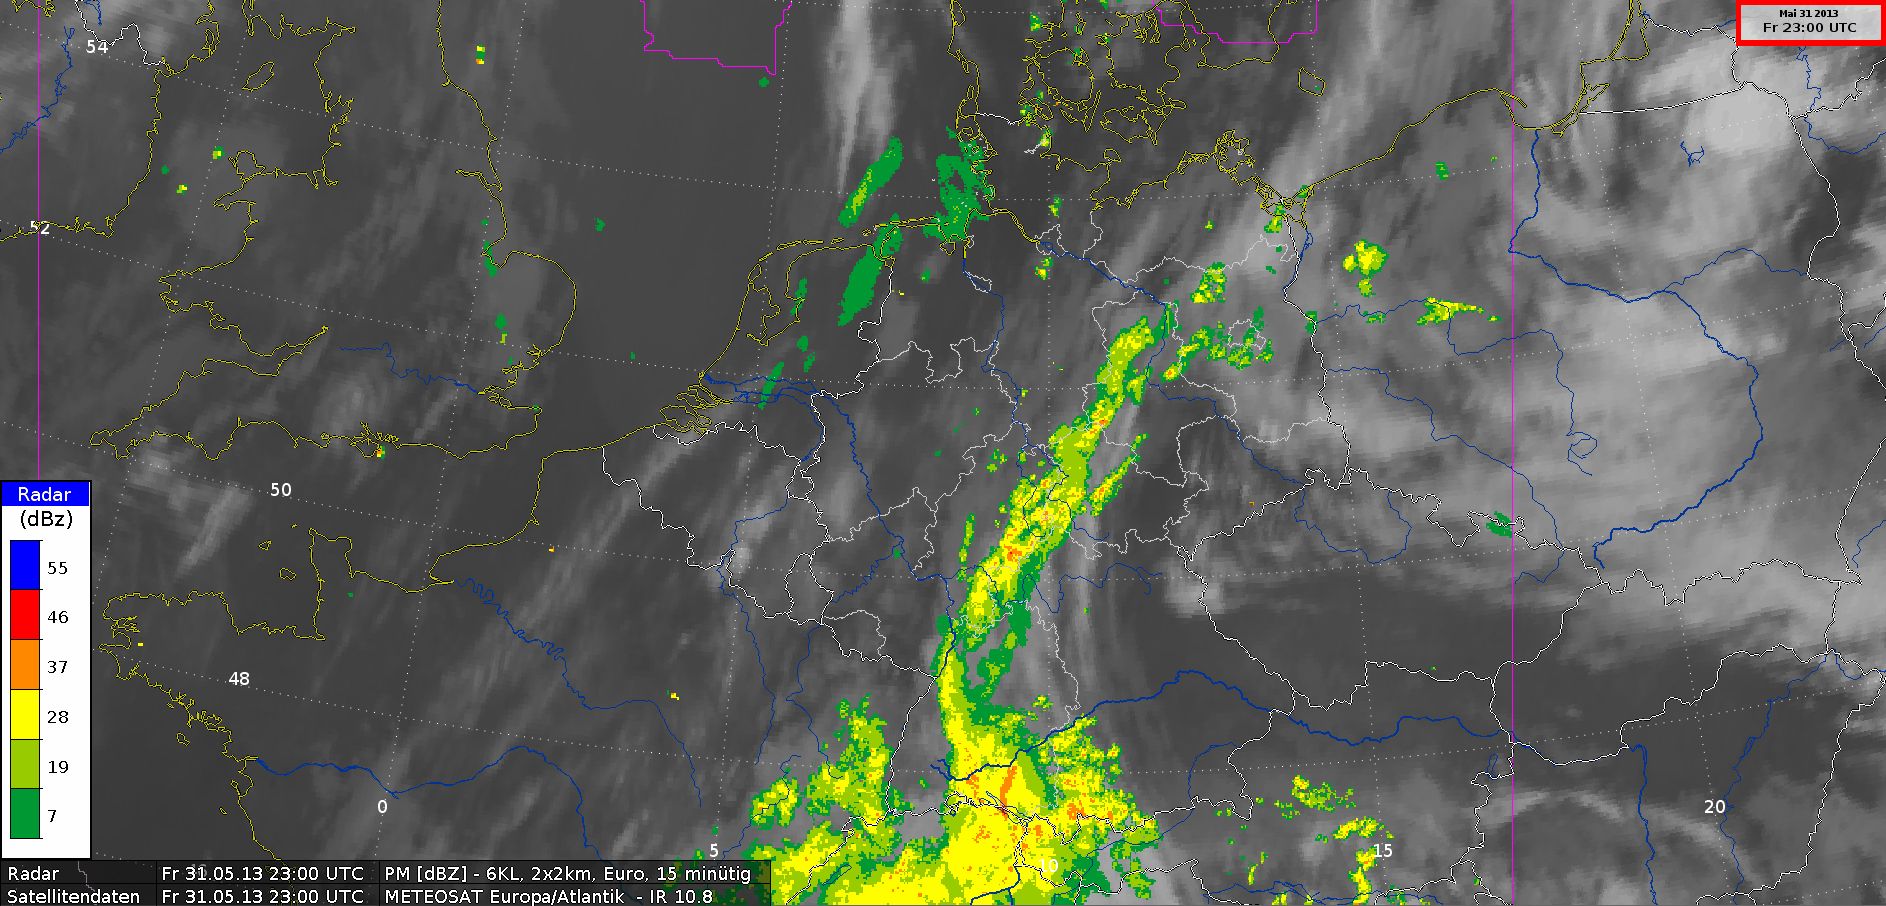
Radar composite image PM with Satellite image IR10.8, 31 May 2013, 00 UTC - 23 UTC (Source: DWD)
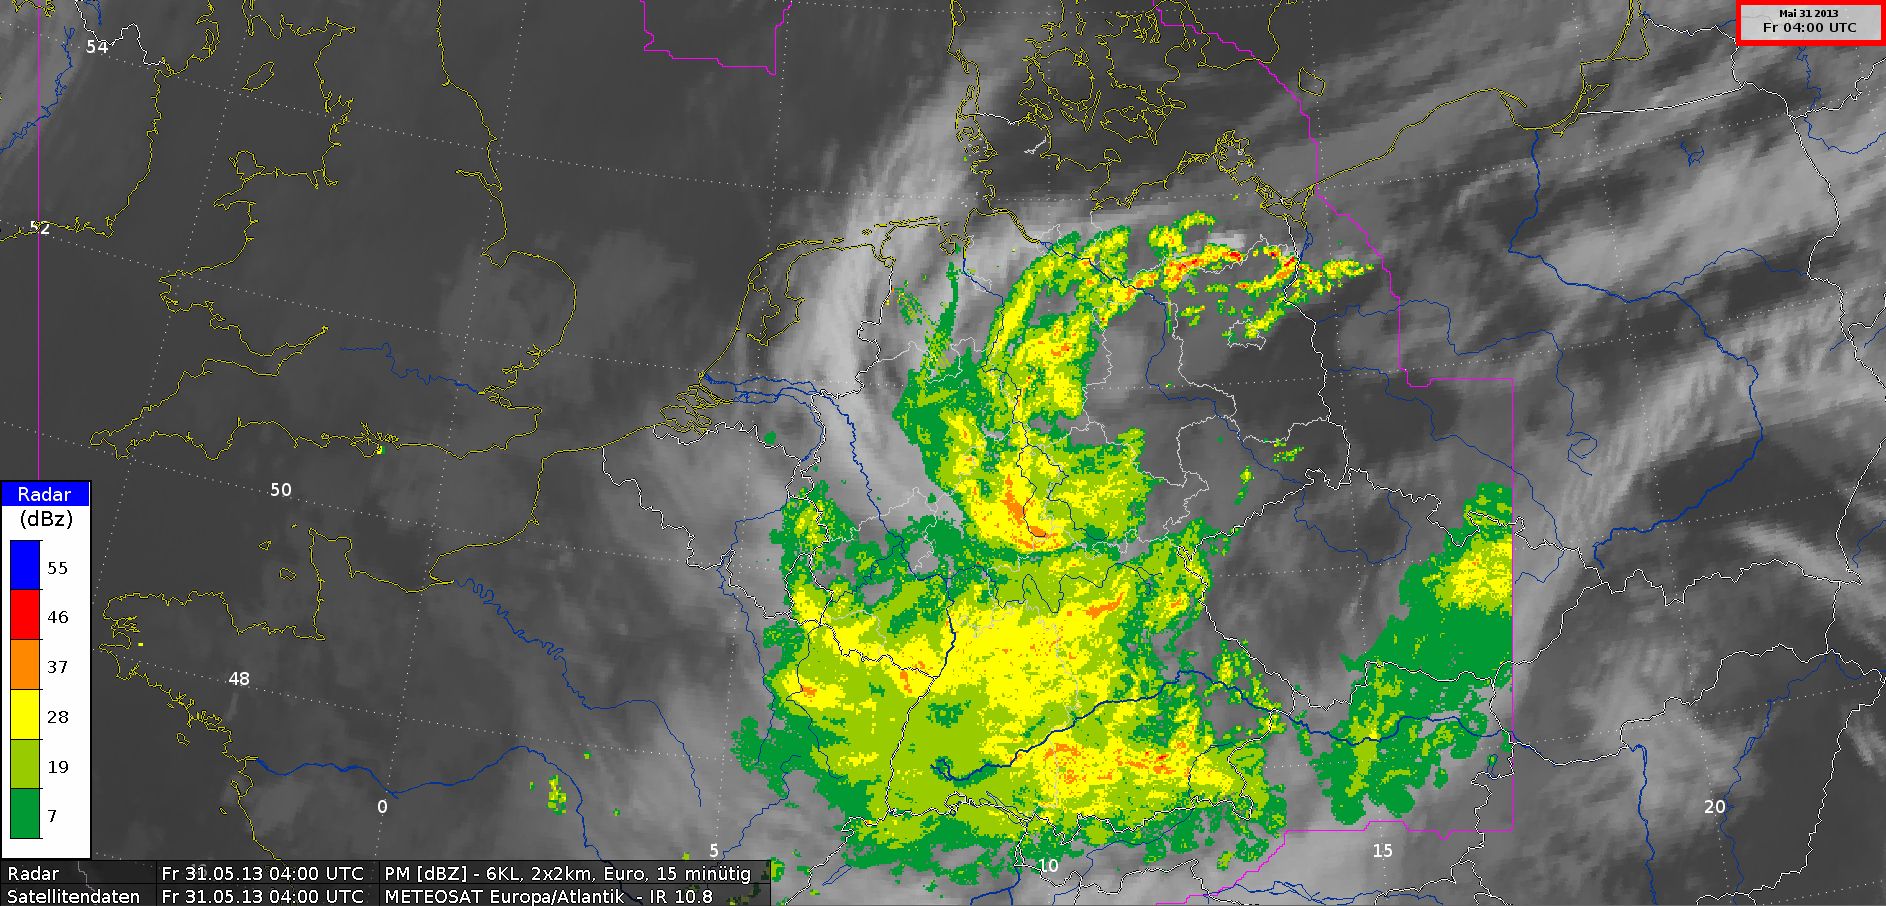
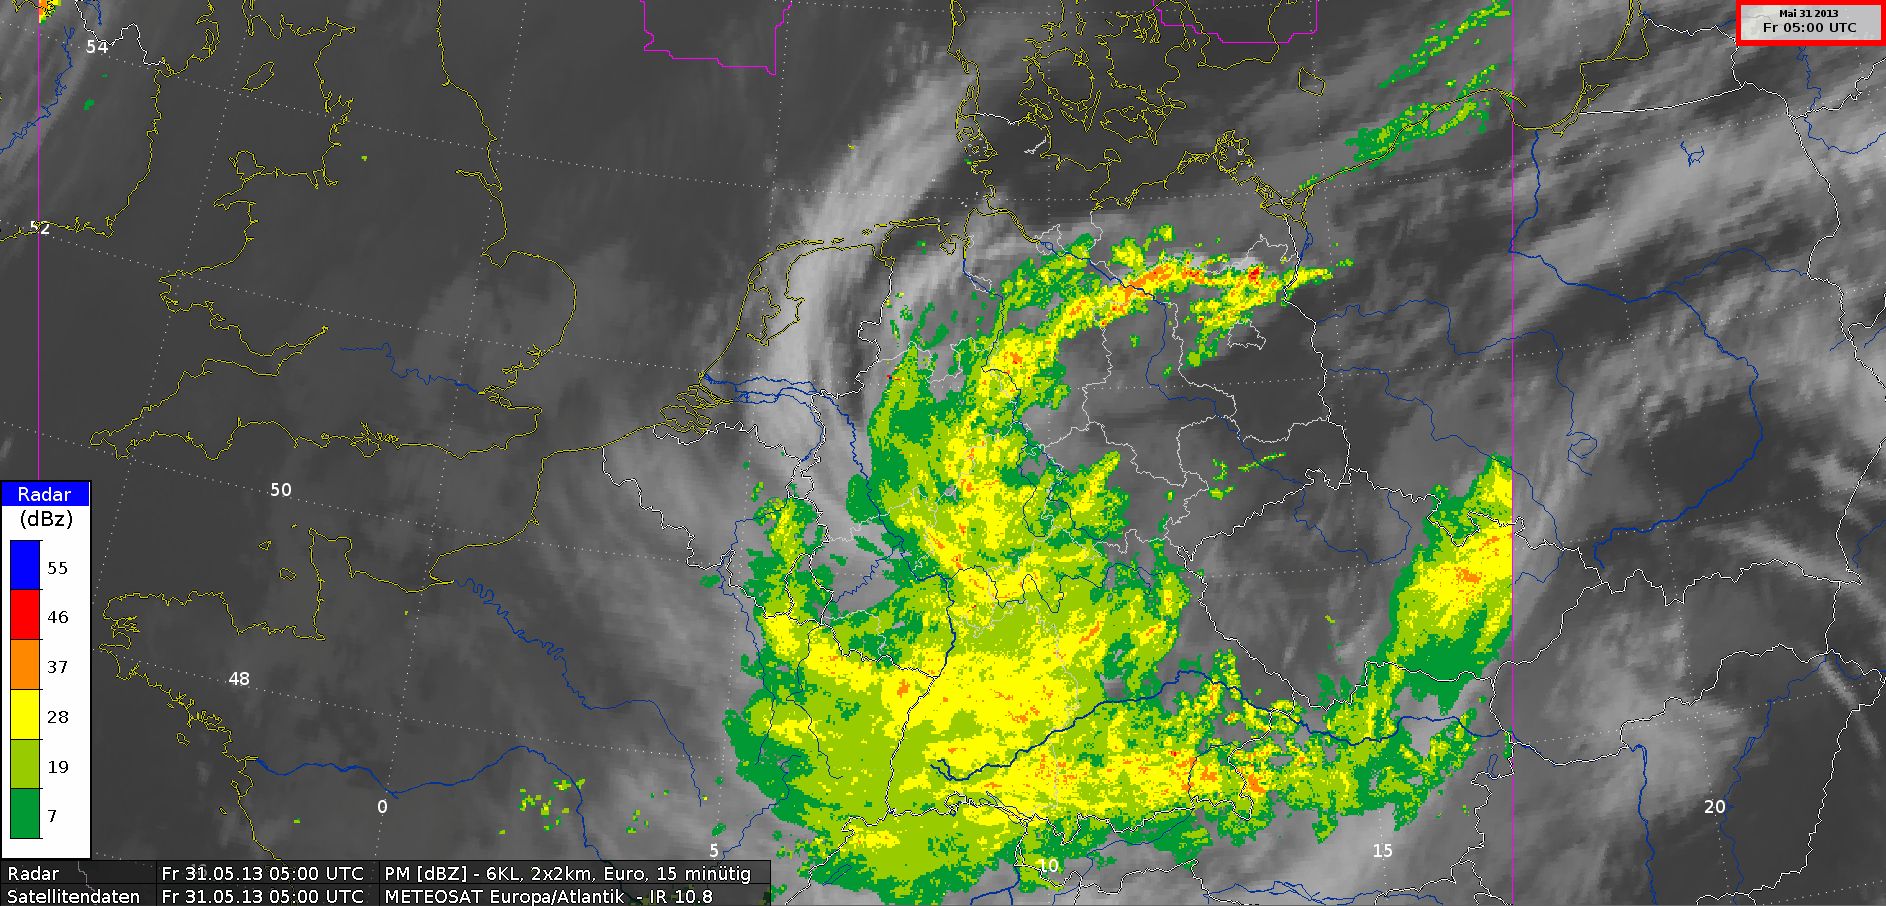
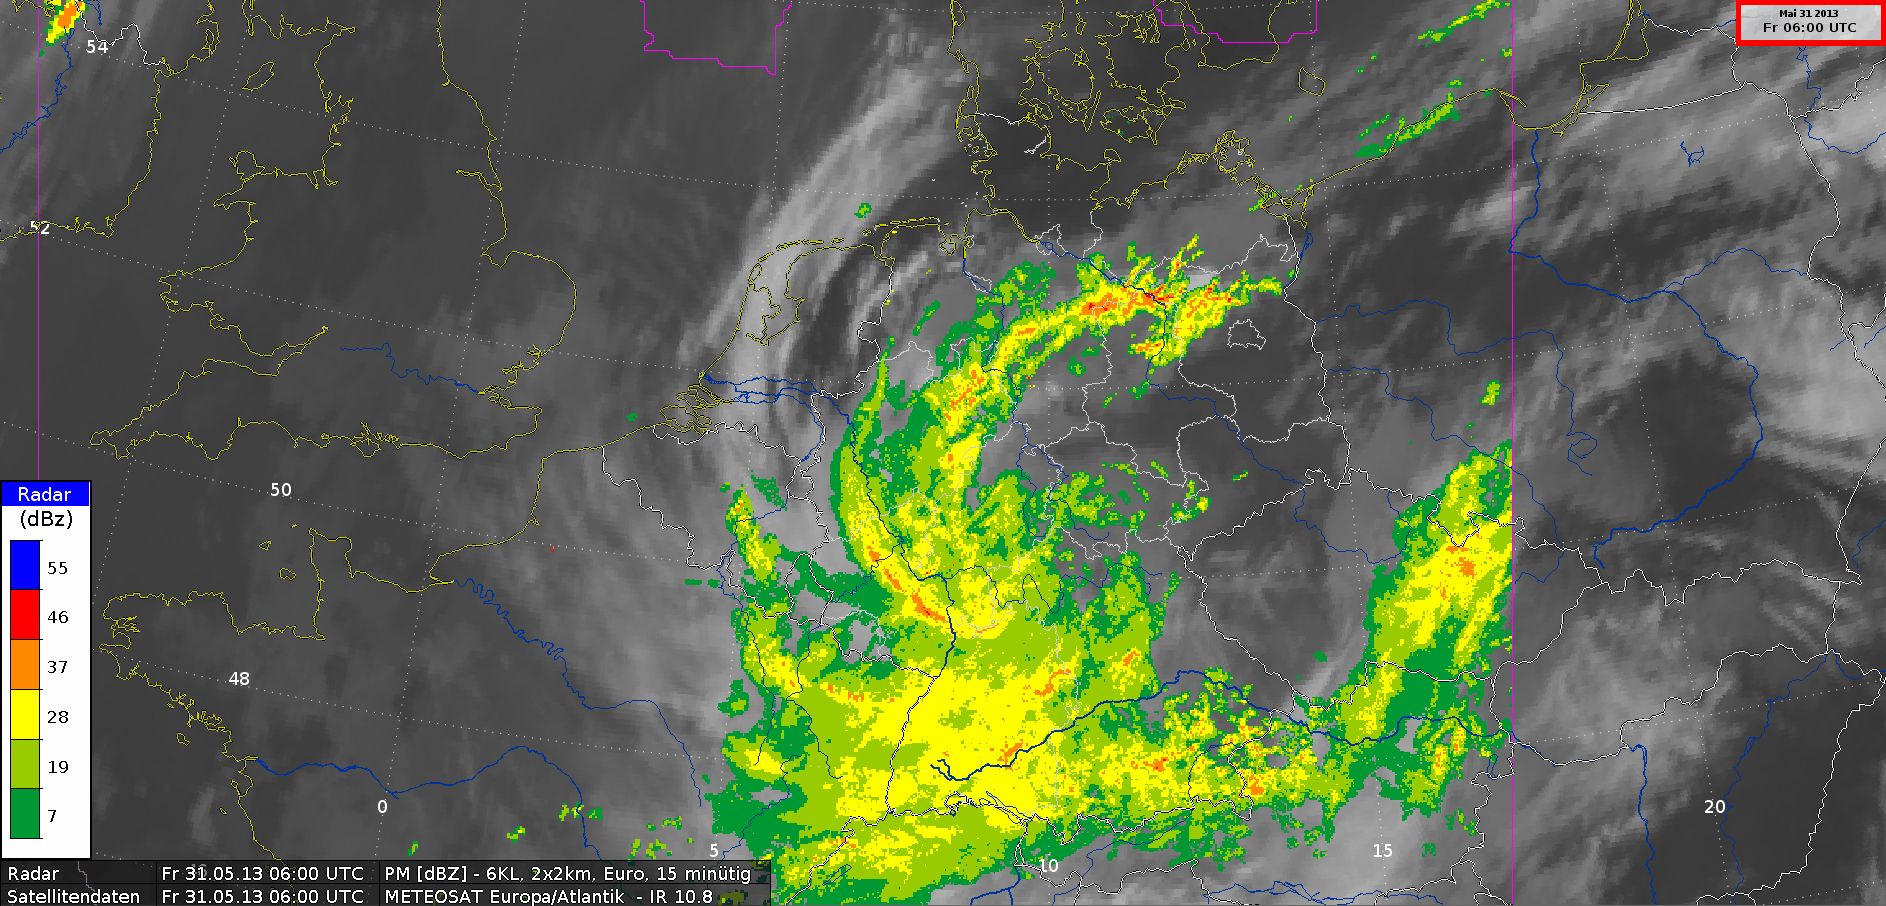
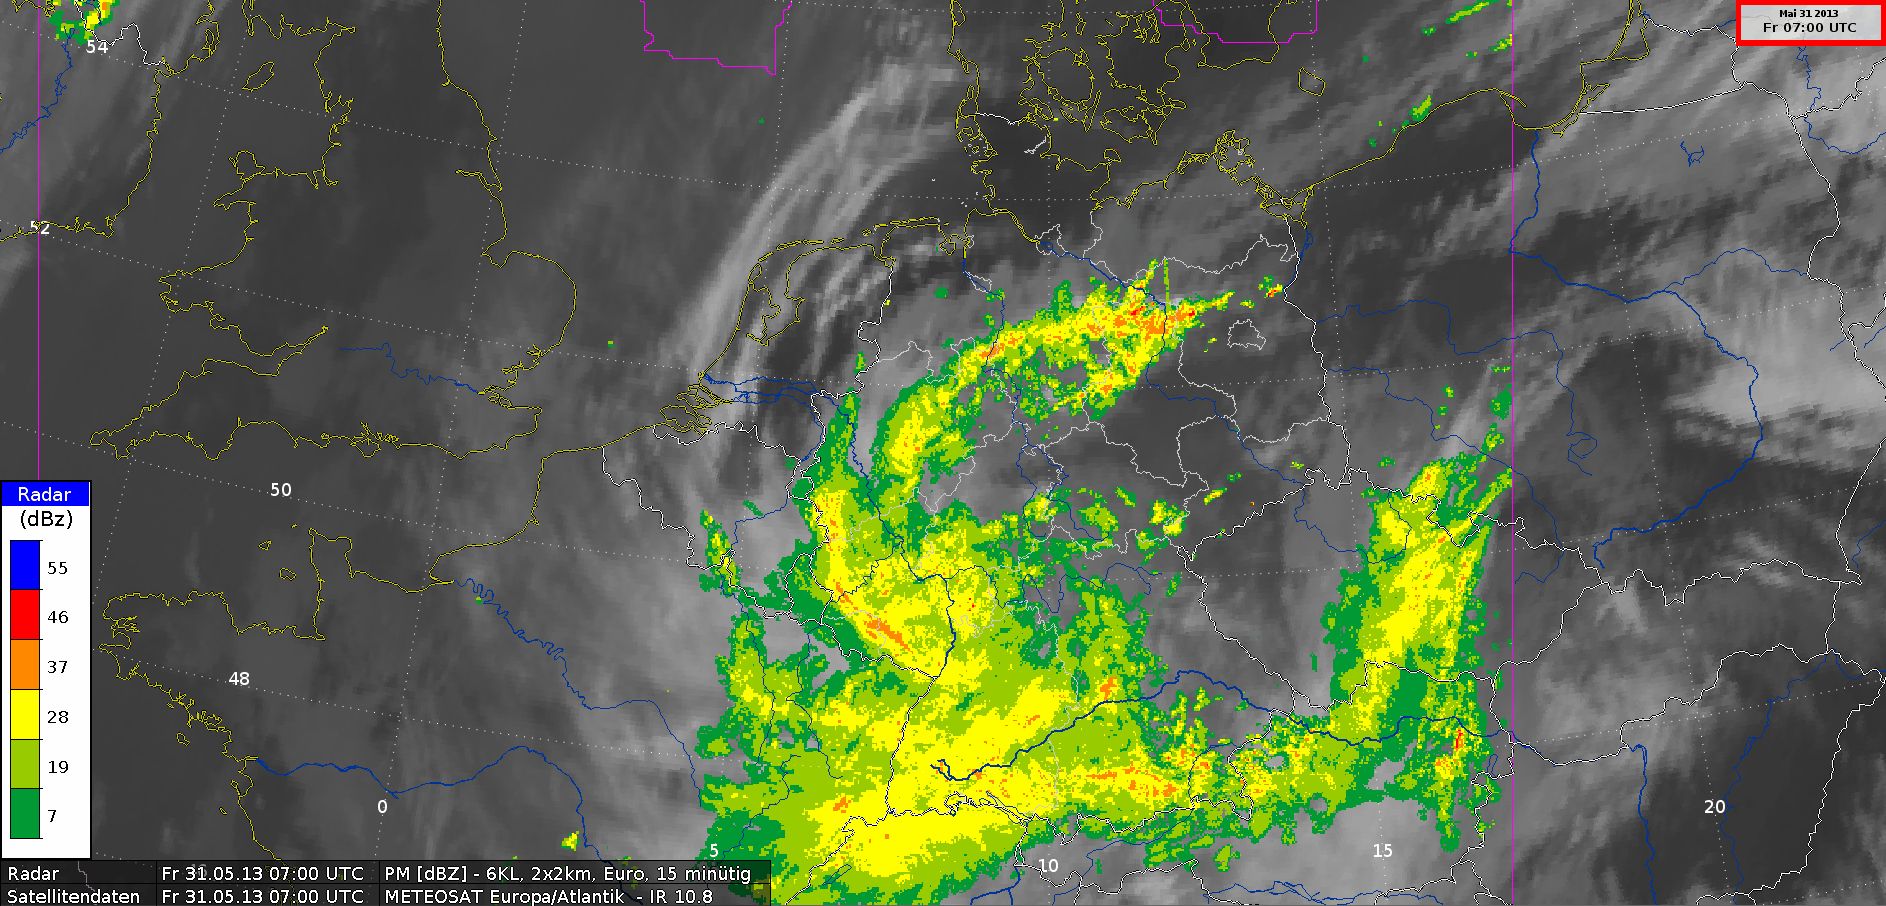
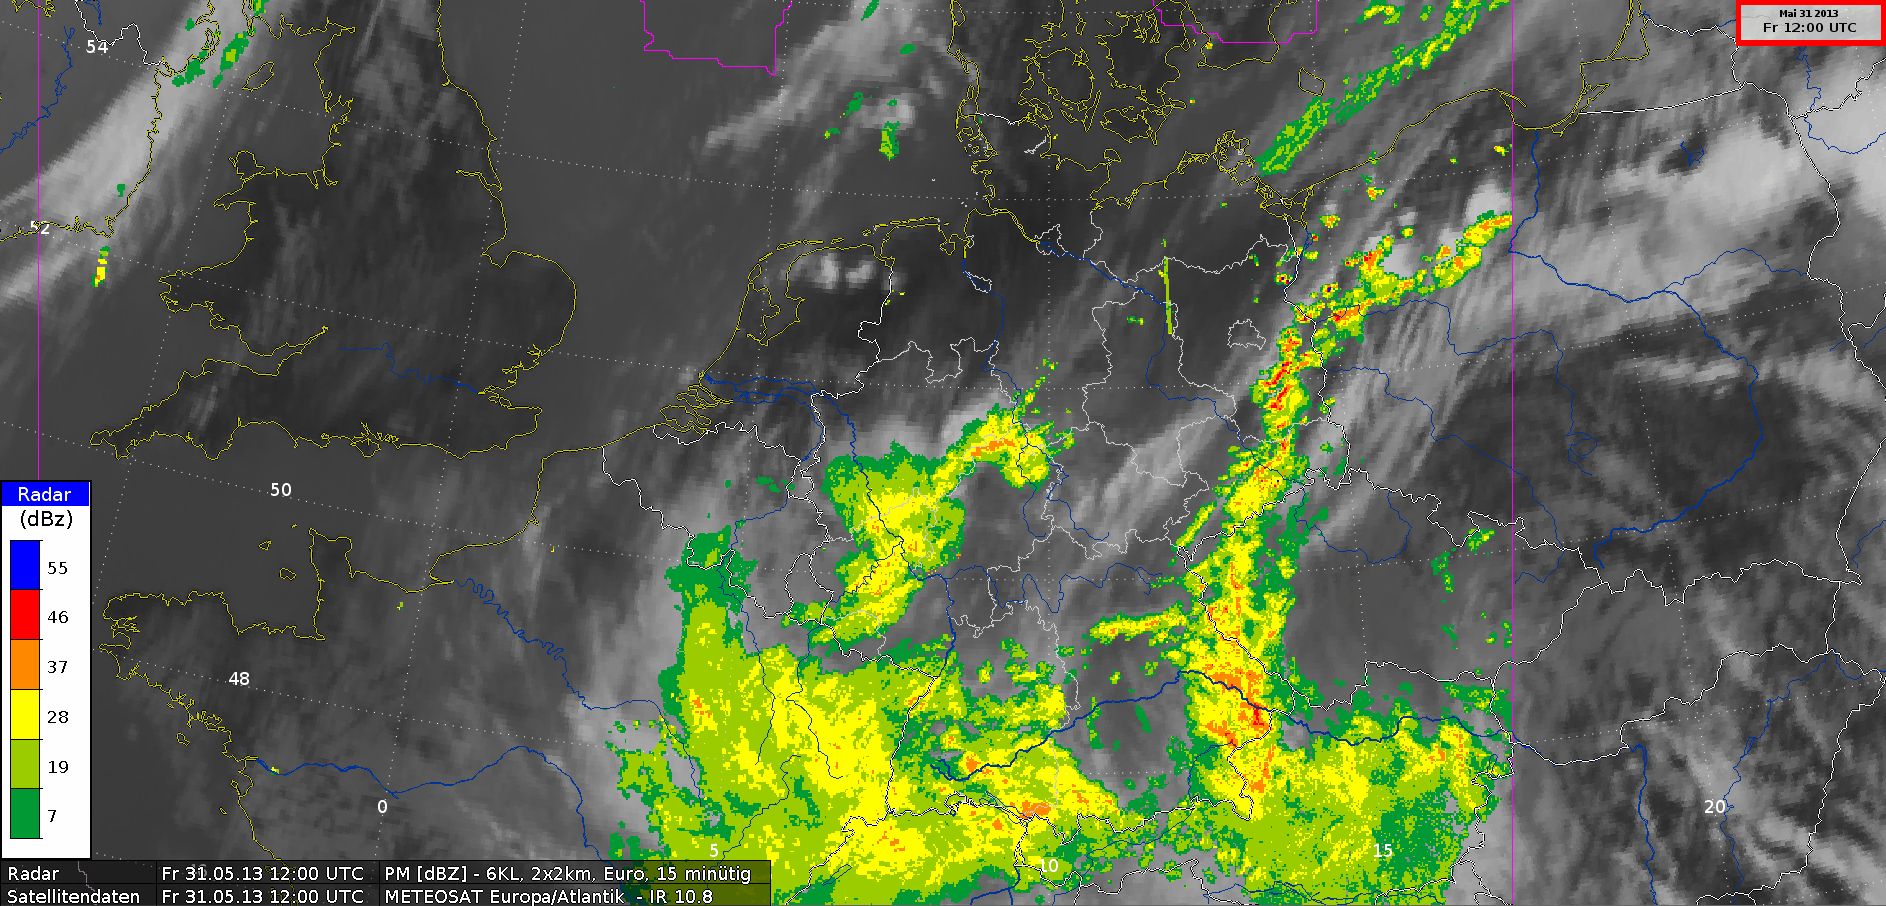
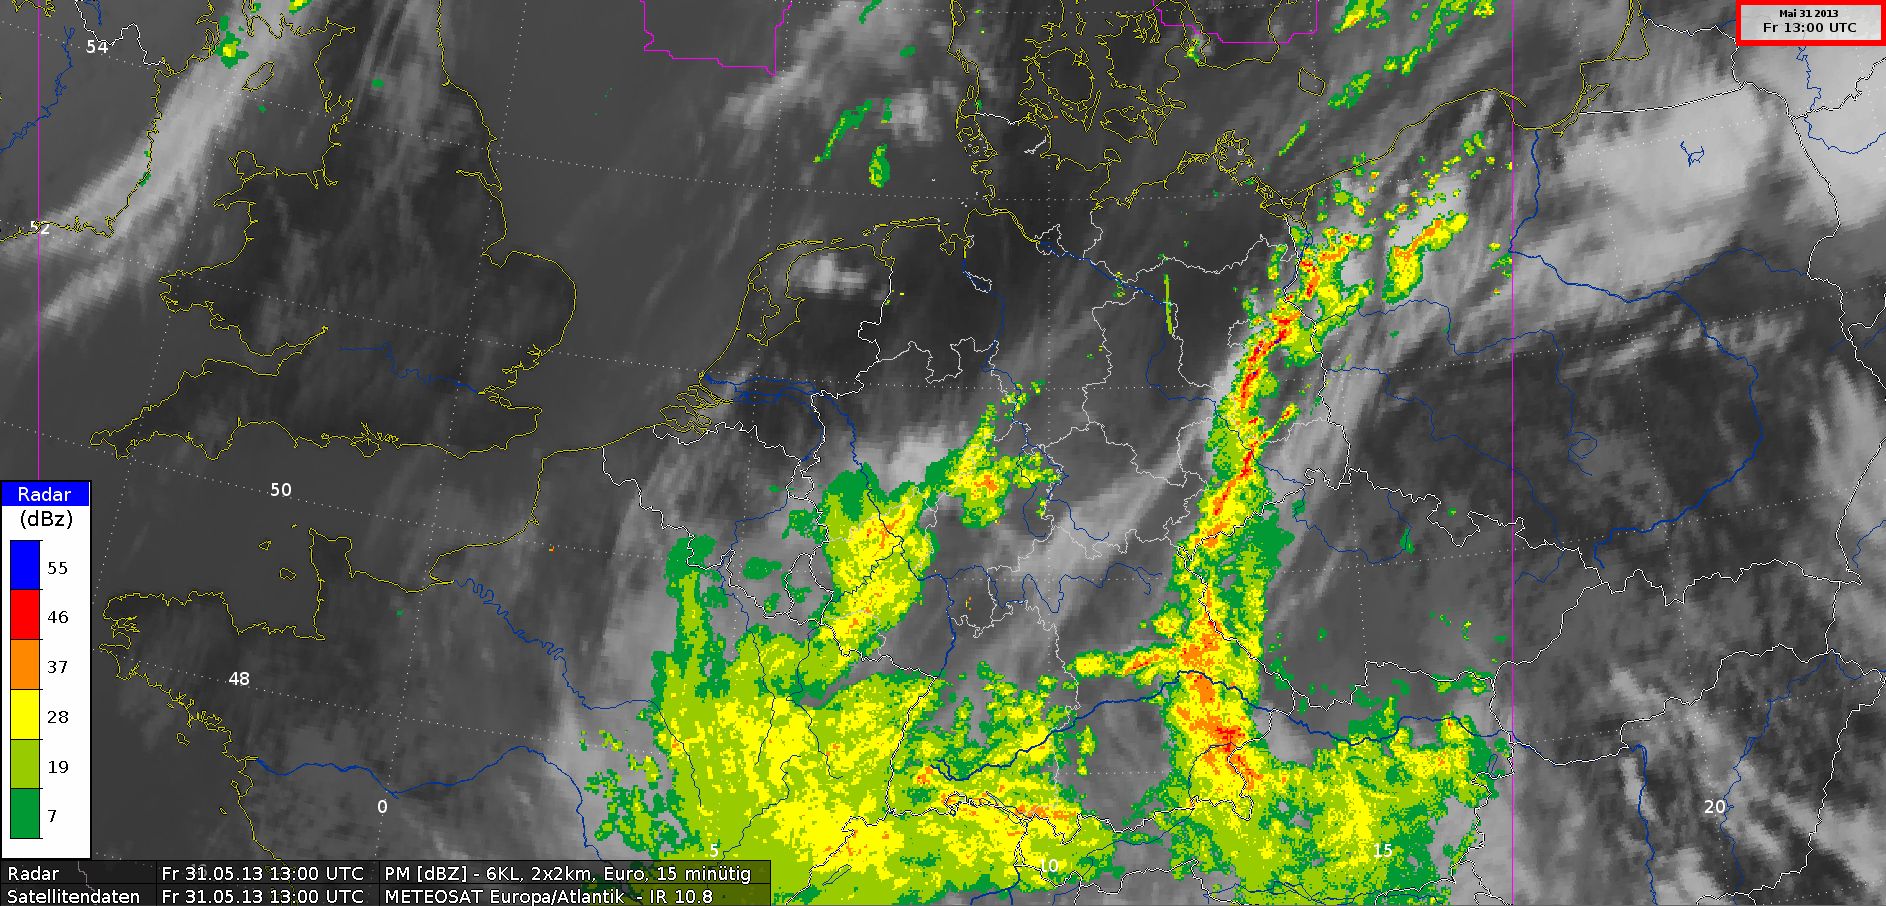
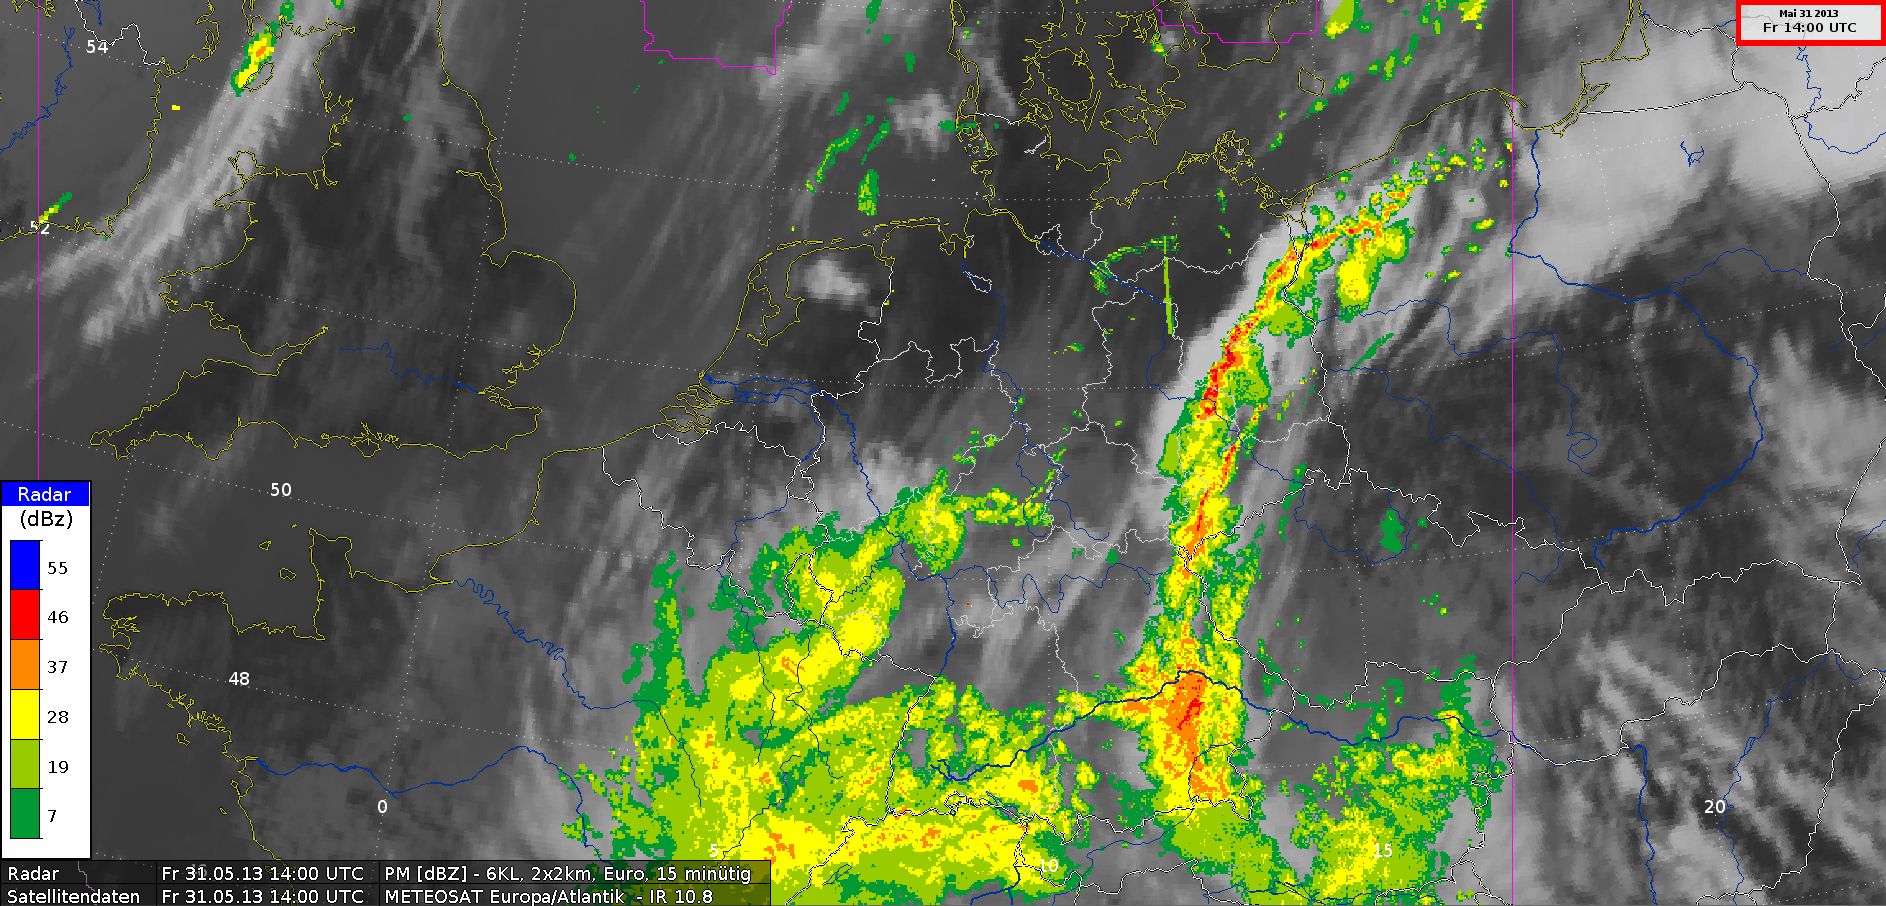
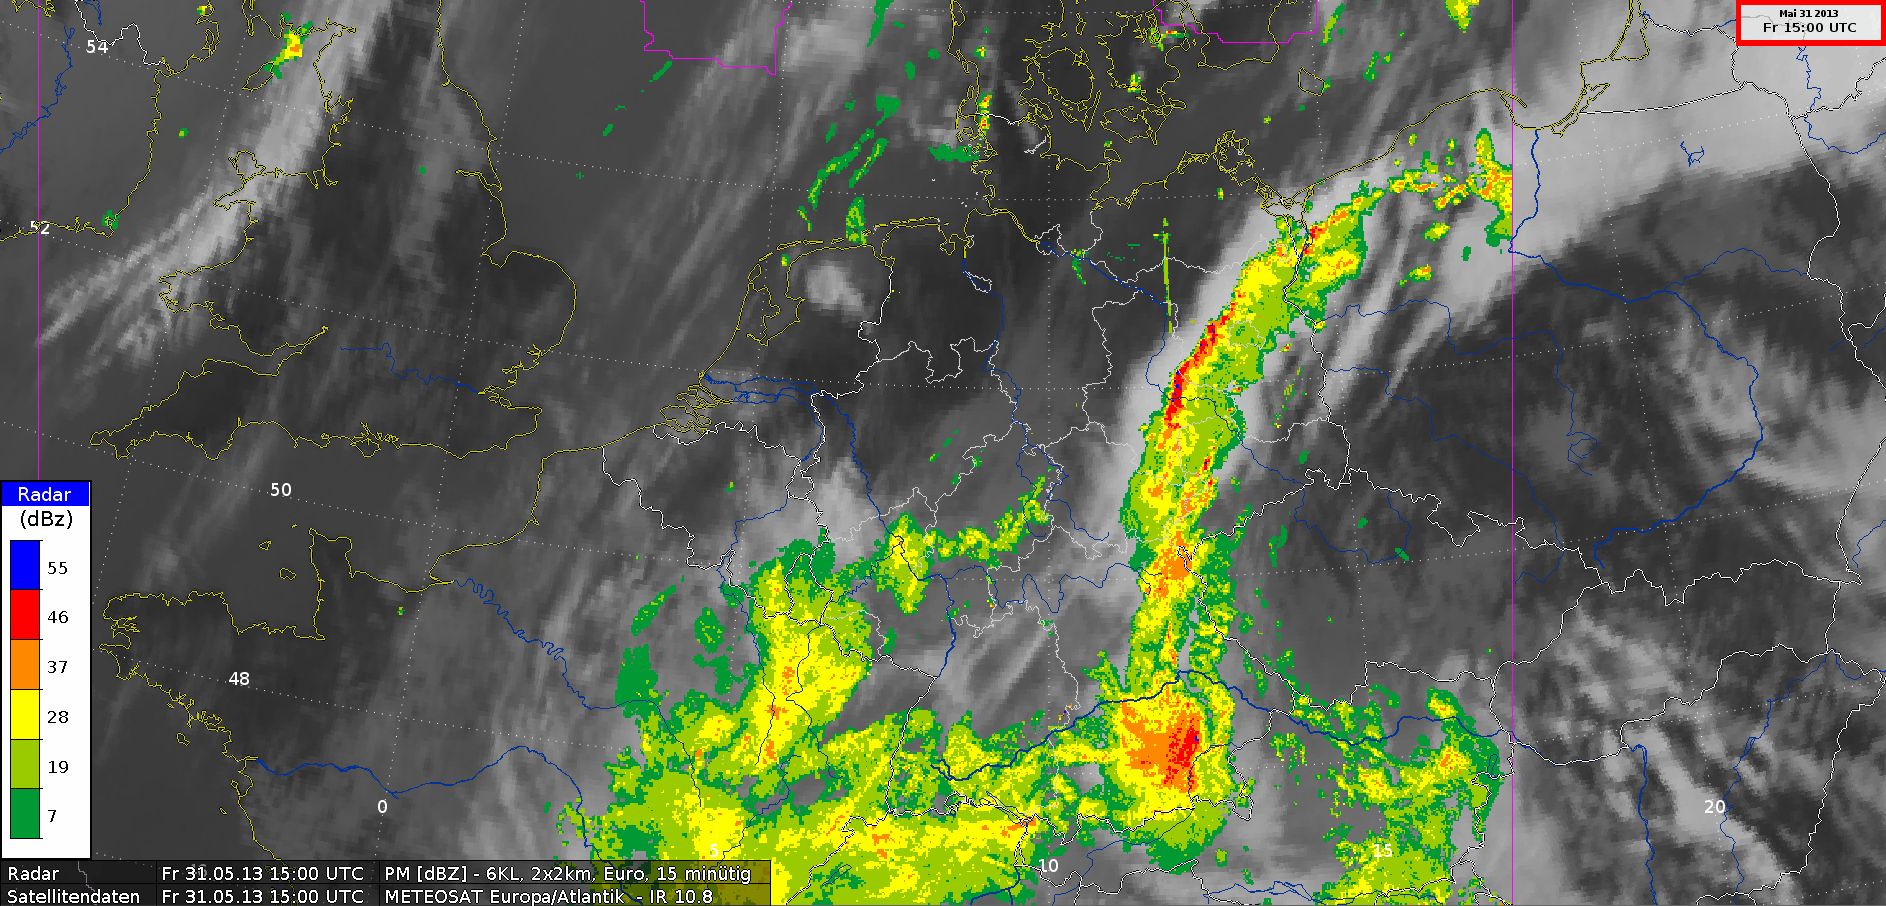
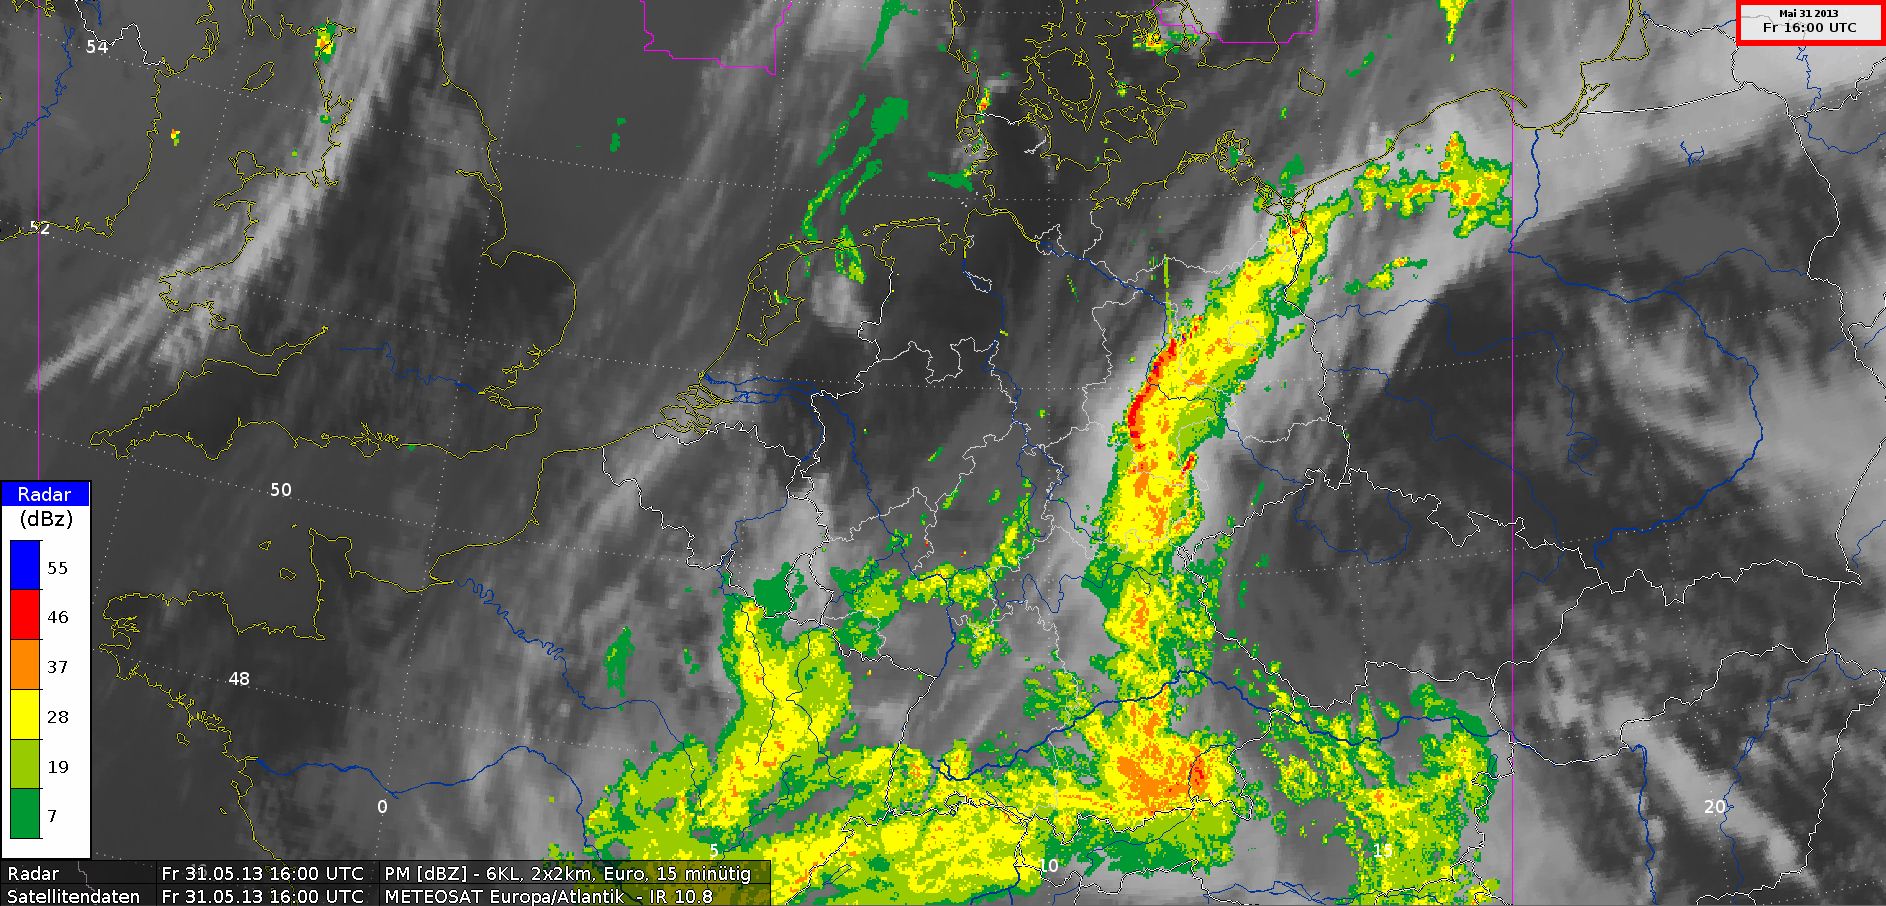
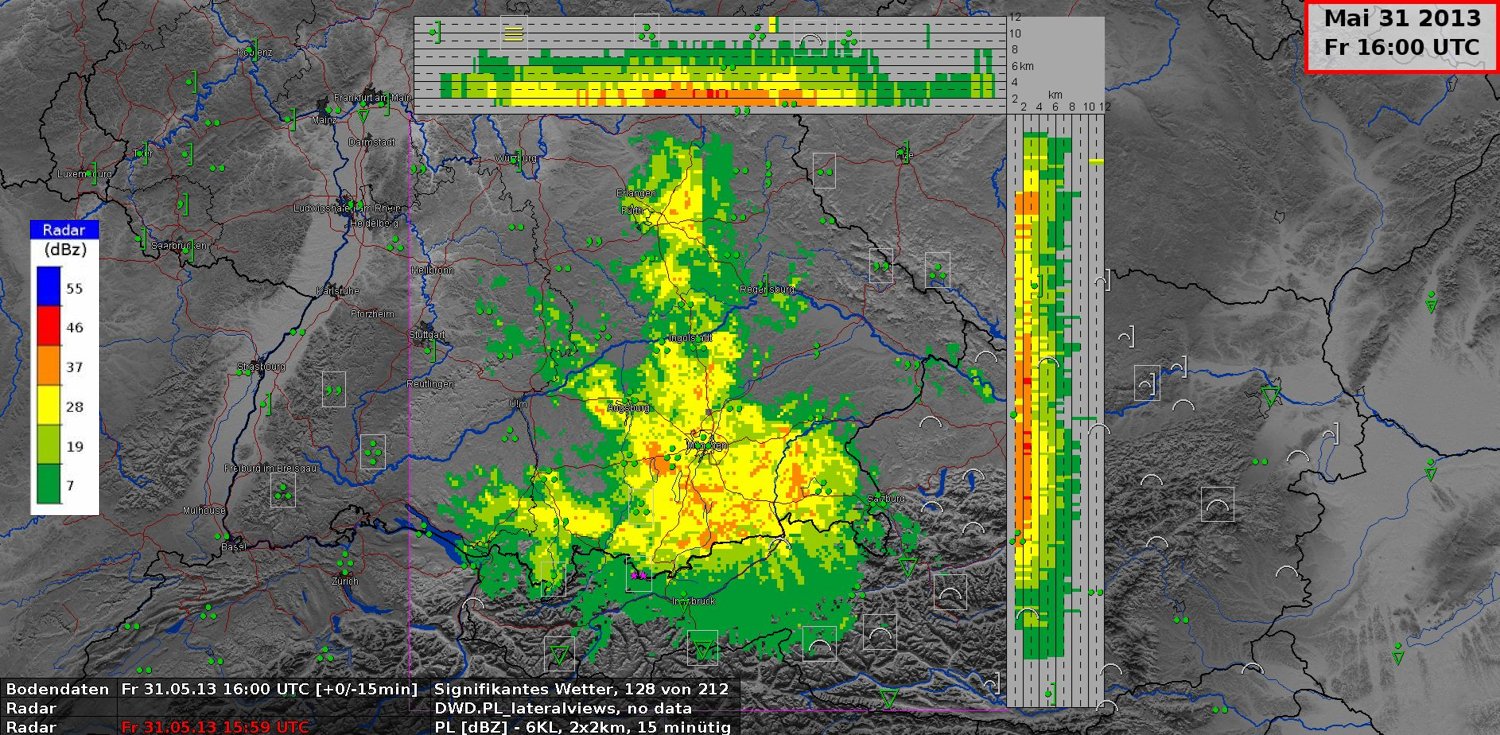
Composite image "PM" from a volume scan with maximum reflectivity
At 16:00 UTC there is a bow echo at the front side of this rain band, which is typical of thunderstorms with strong gusts. Only the radar can give the exact position and movement of this thunderstorm line. The colors represent reflectivity in dBZ.
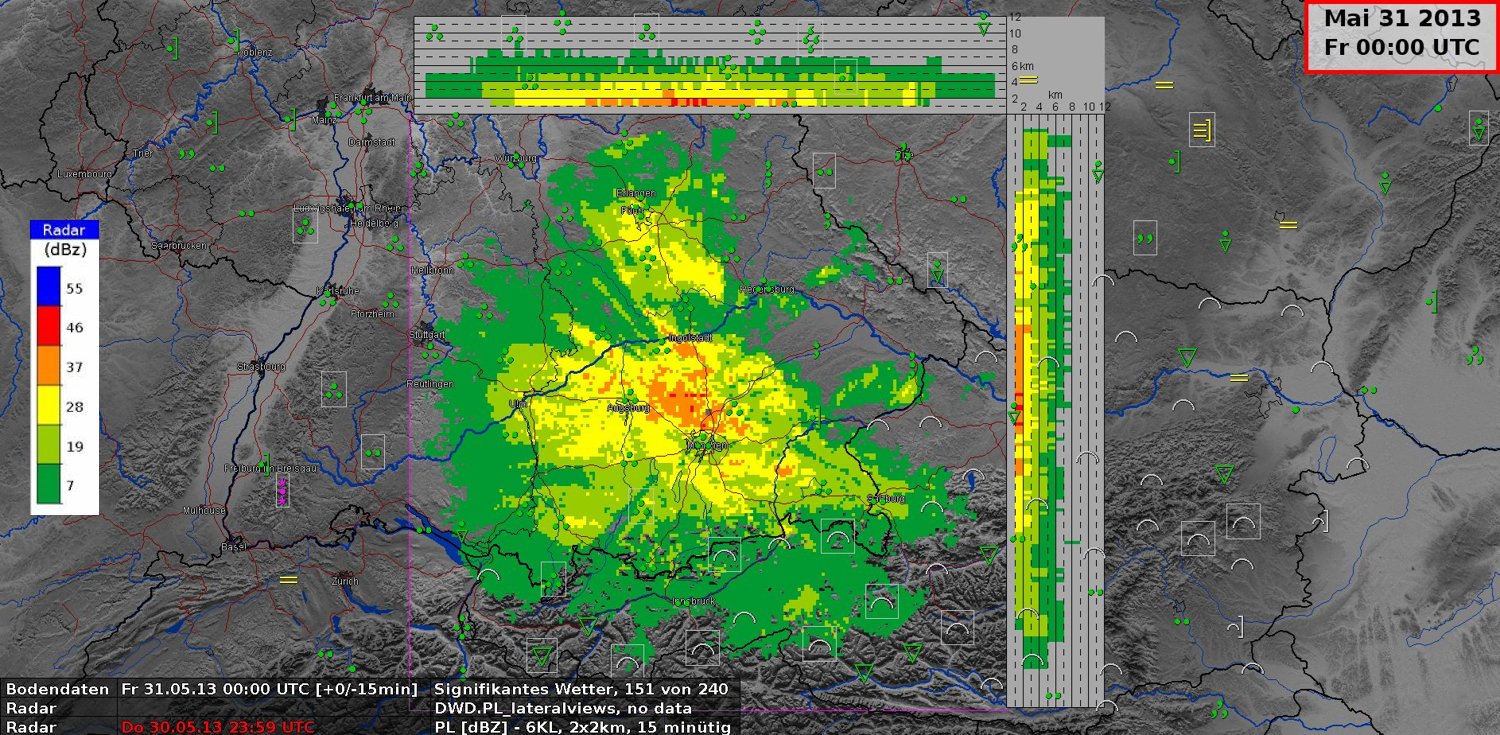
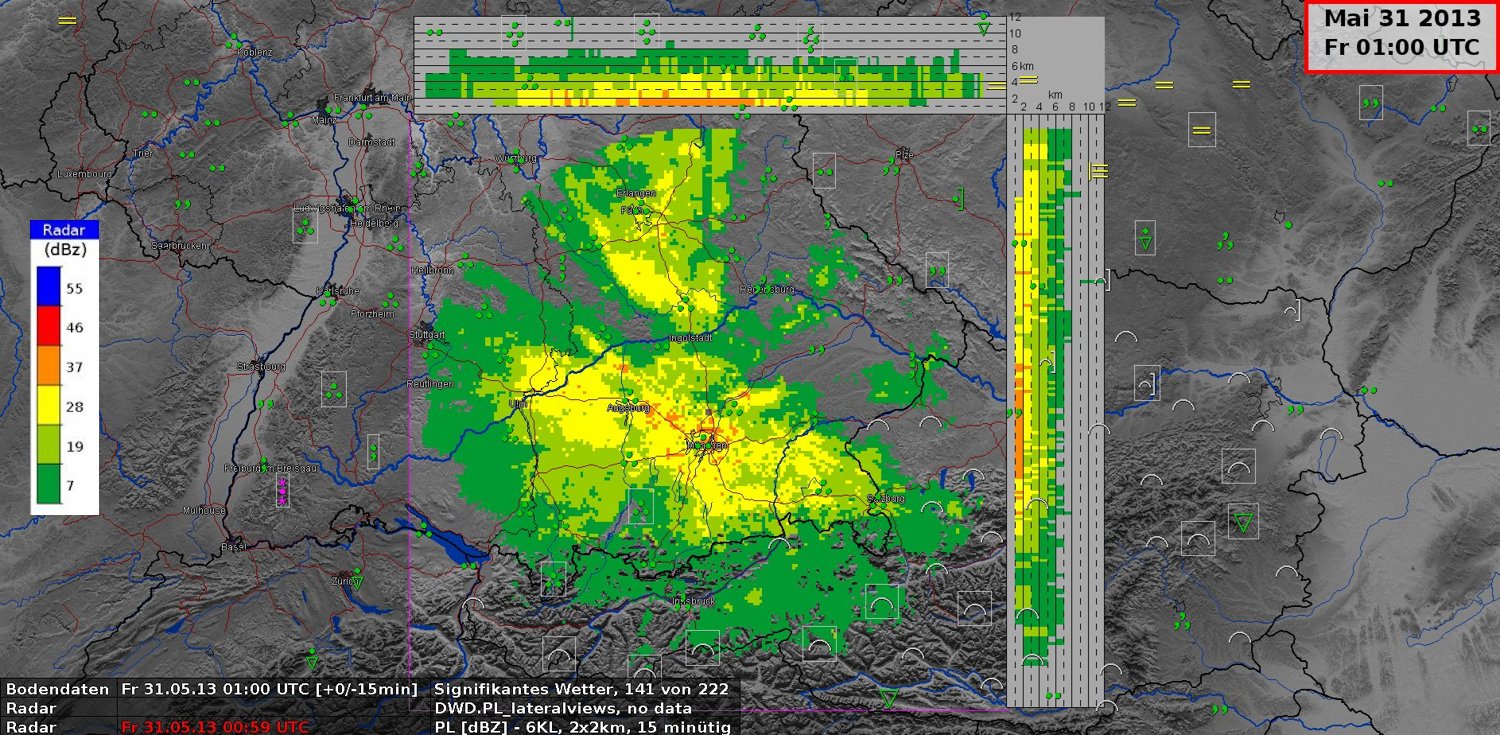
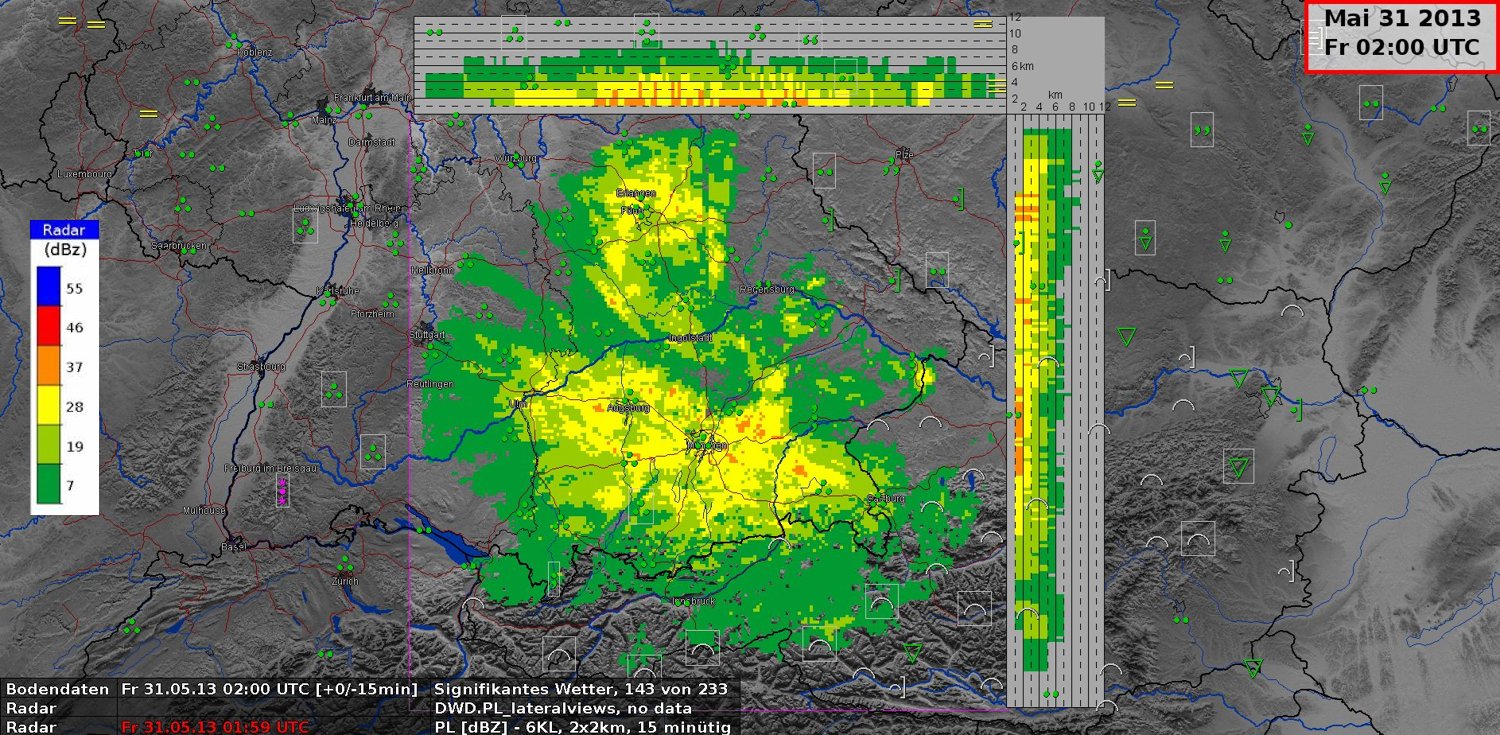
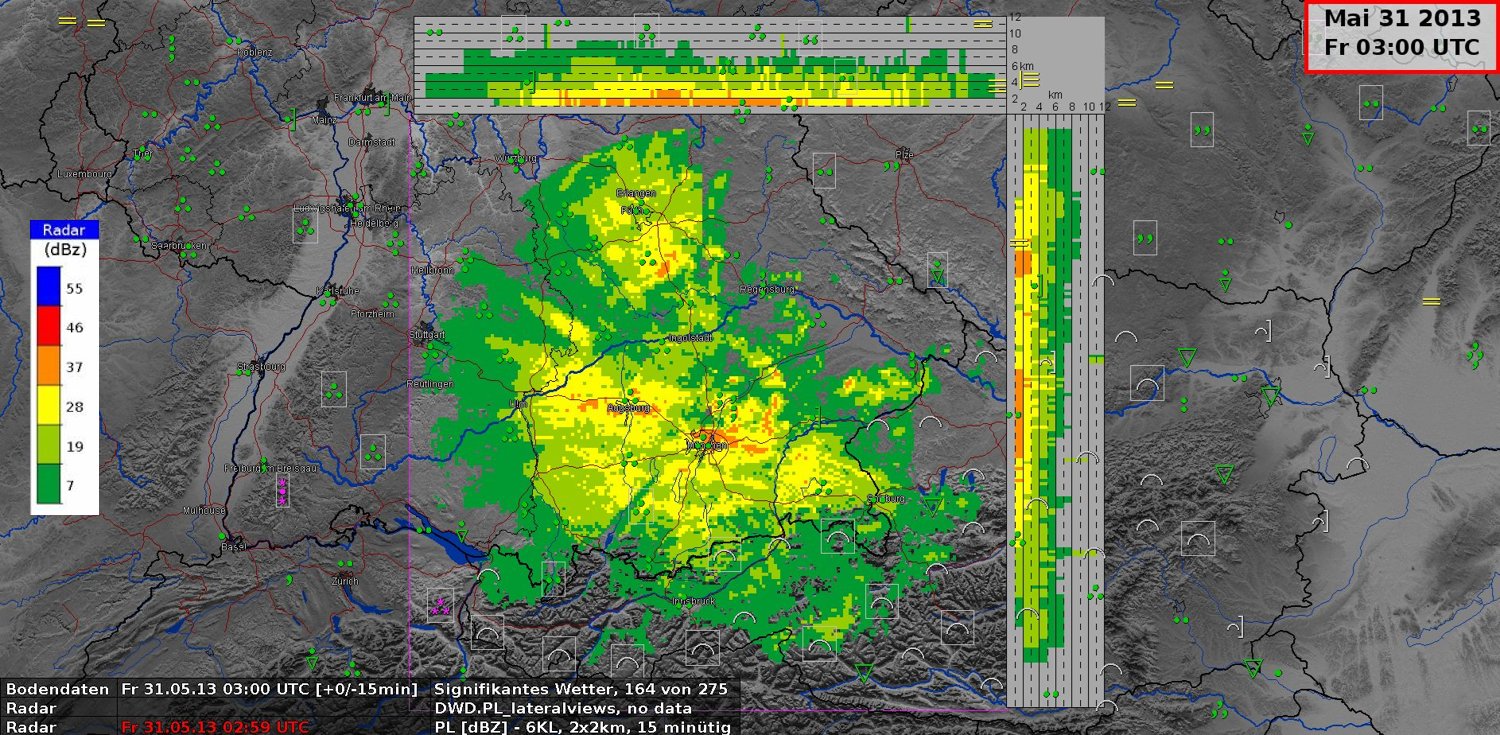
Radar composite image PM with Satellite image IR10.8, 31 May 2013, 00 UTC - 23 UTC (Source: DWD)
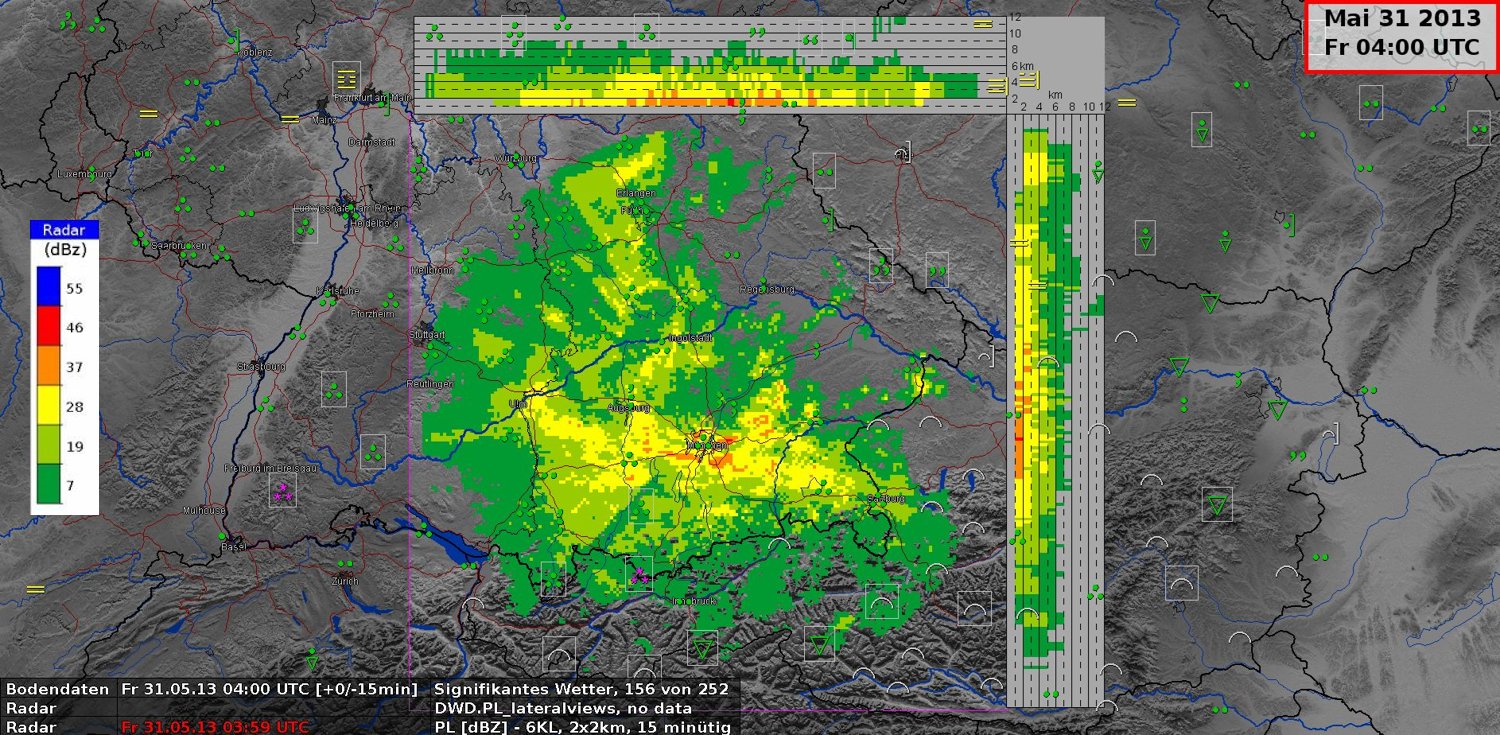
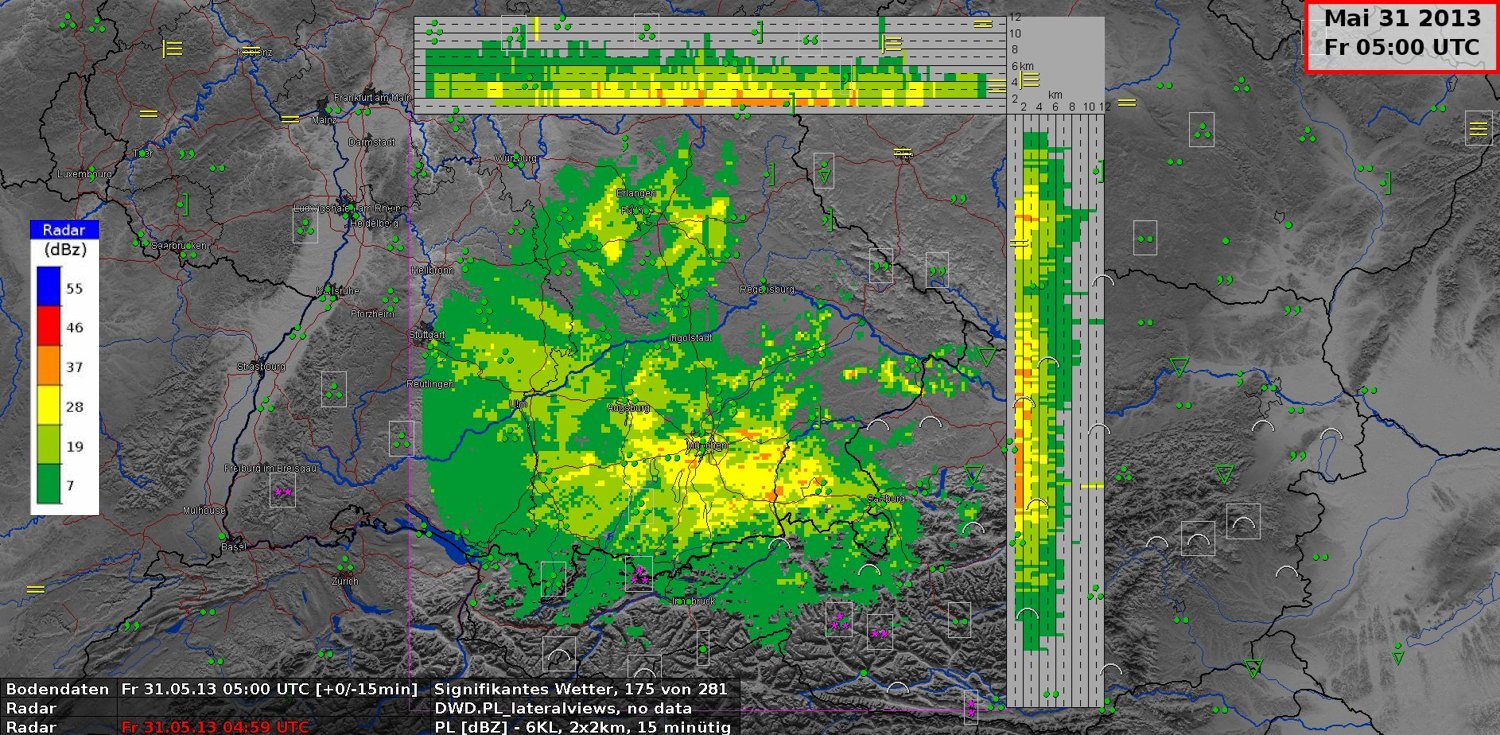
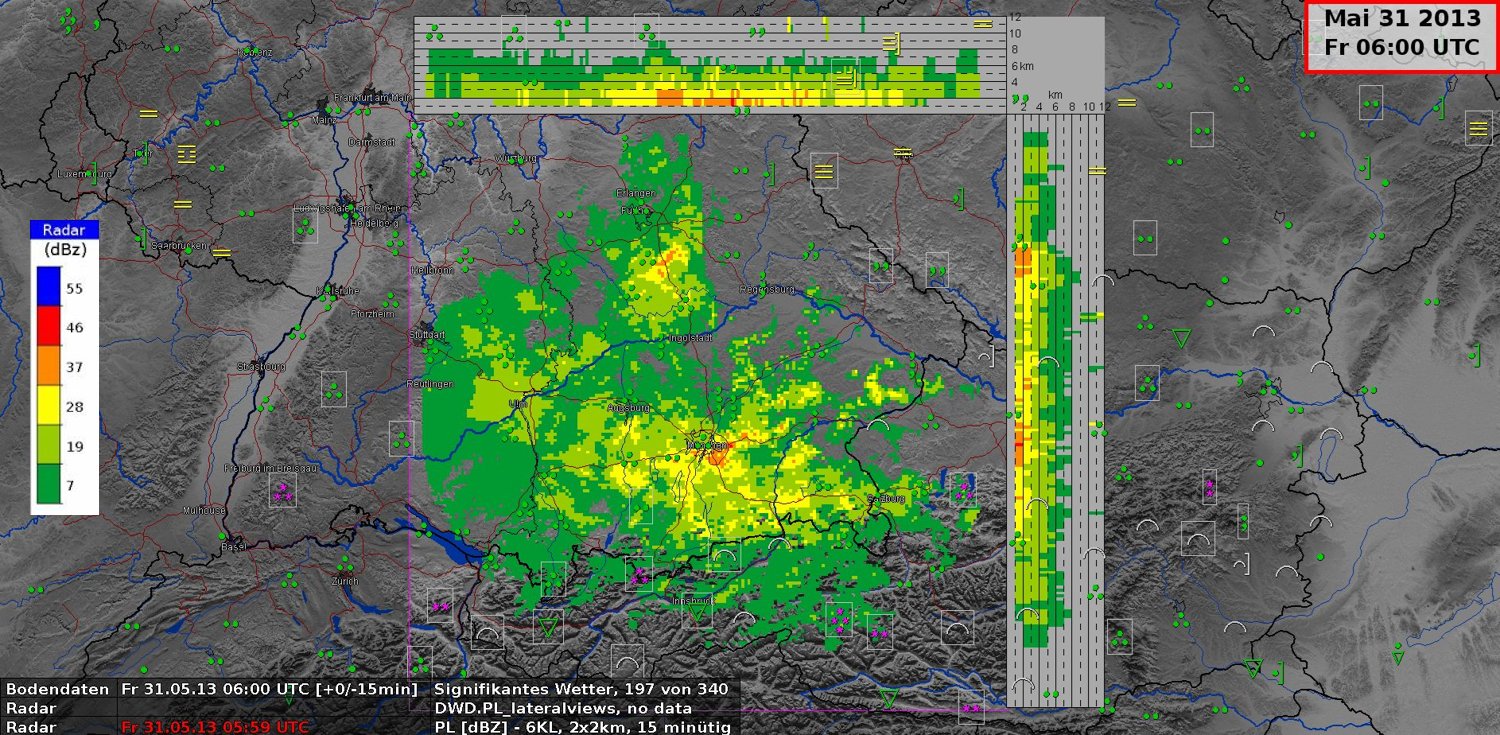
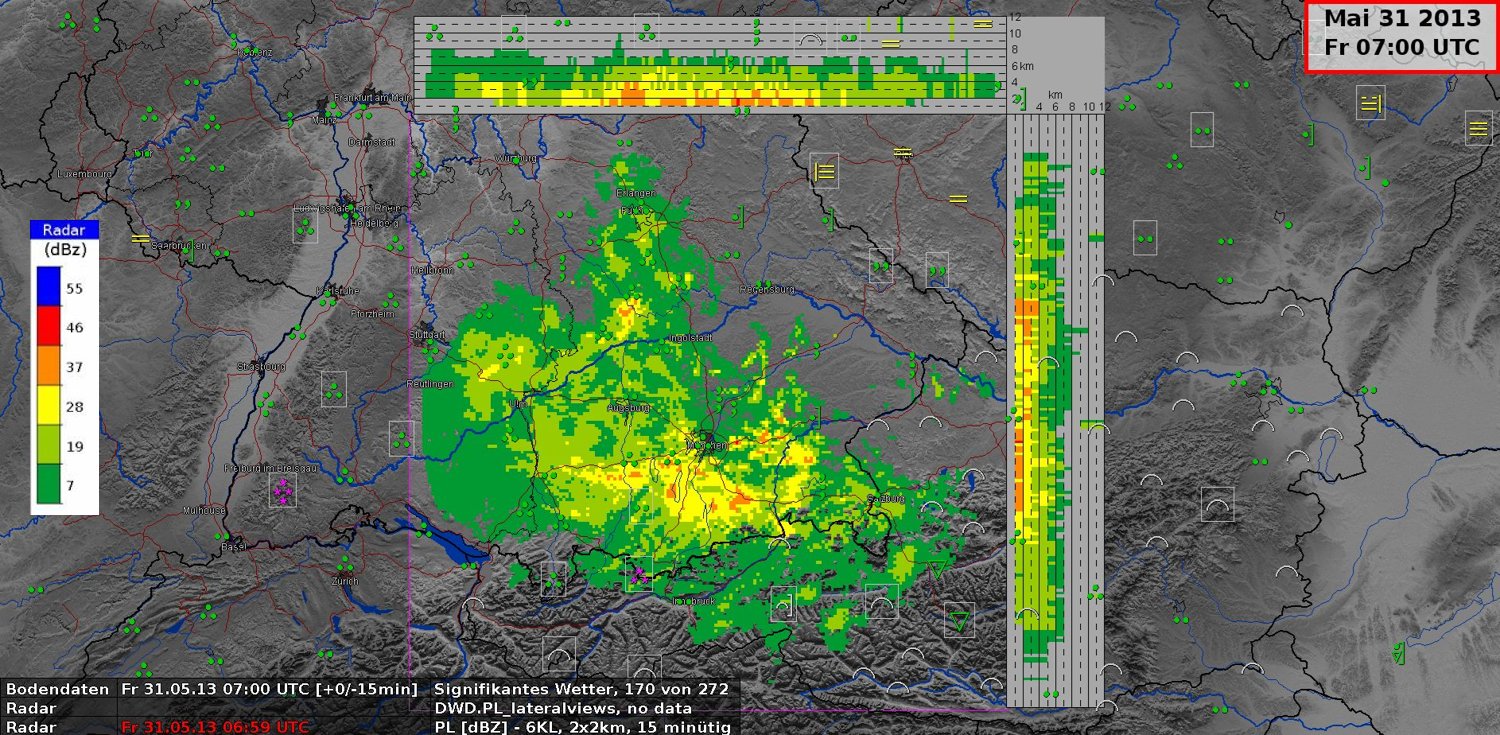
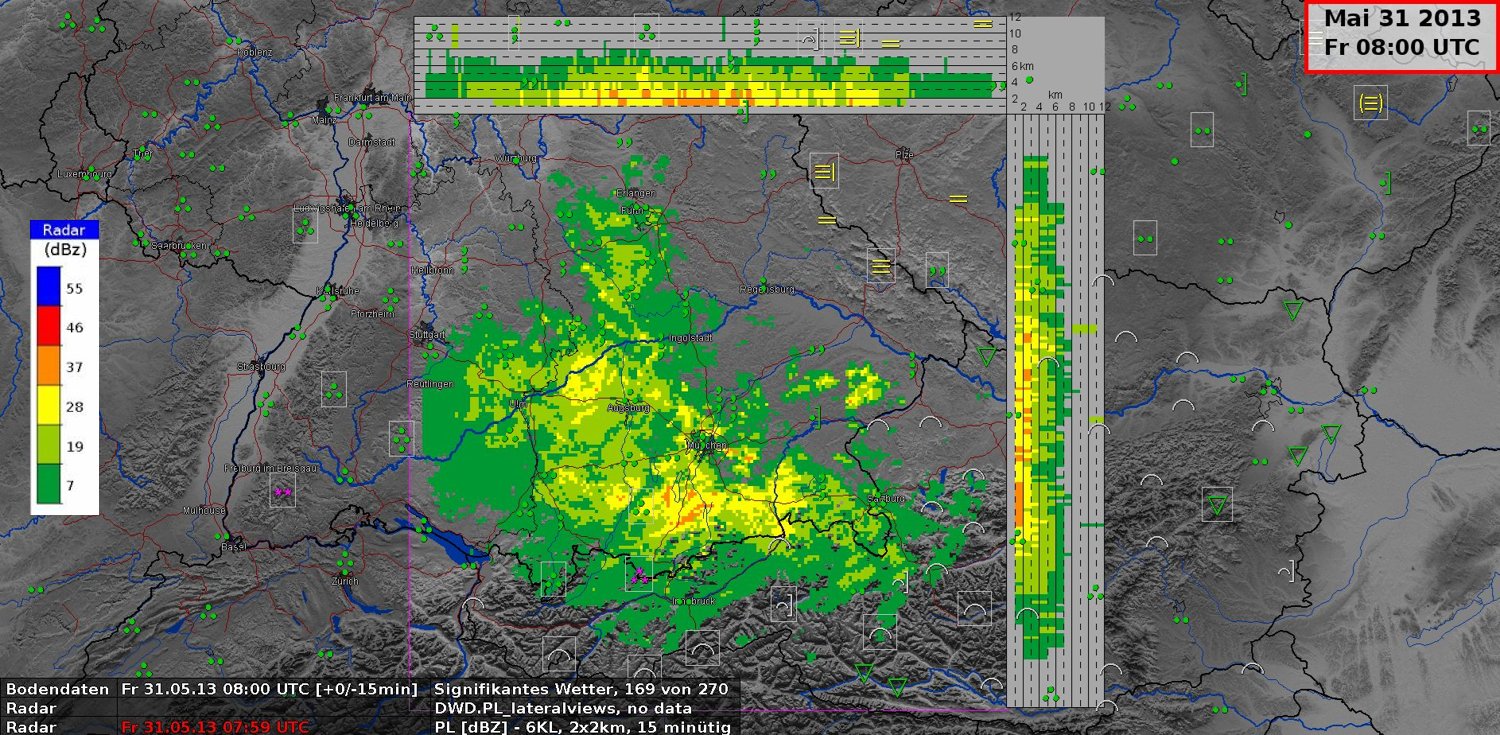
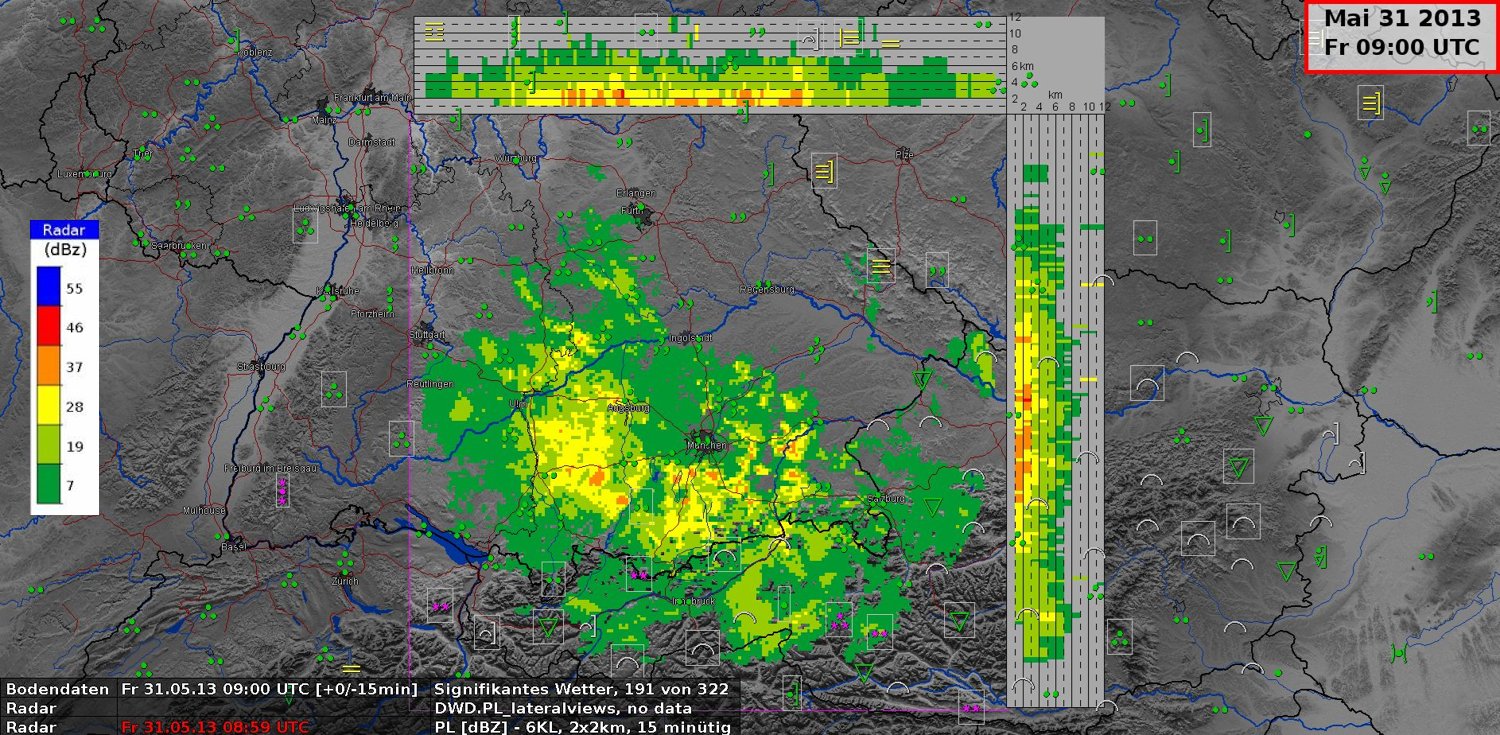
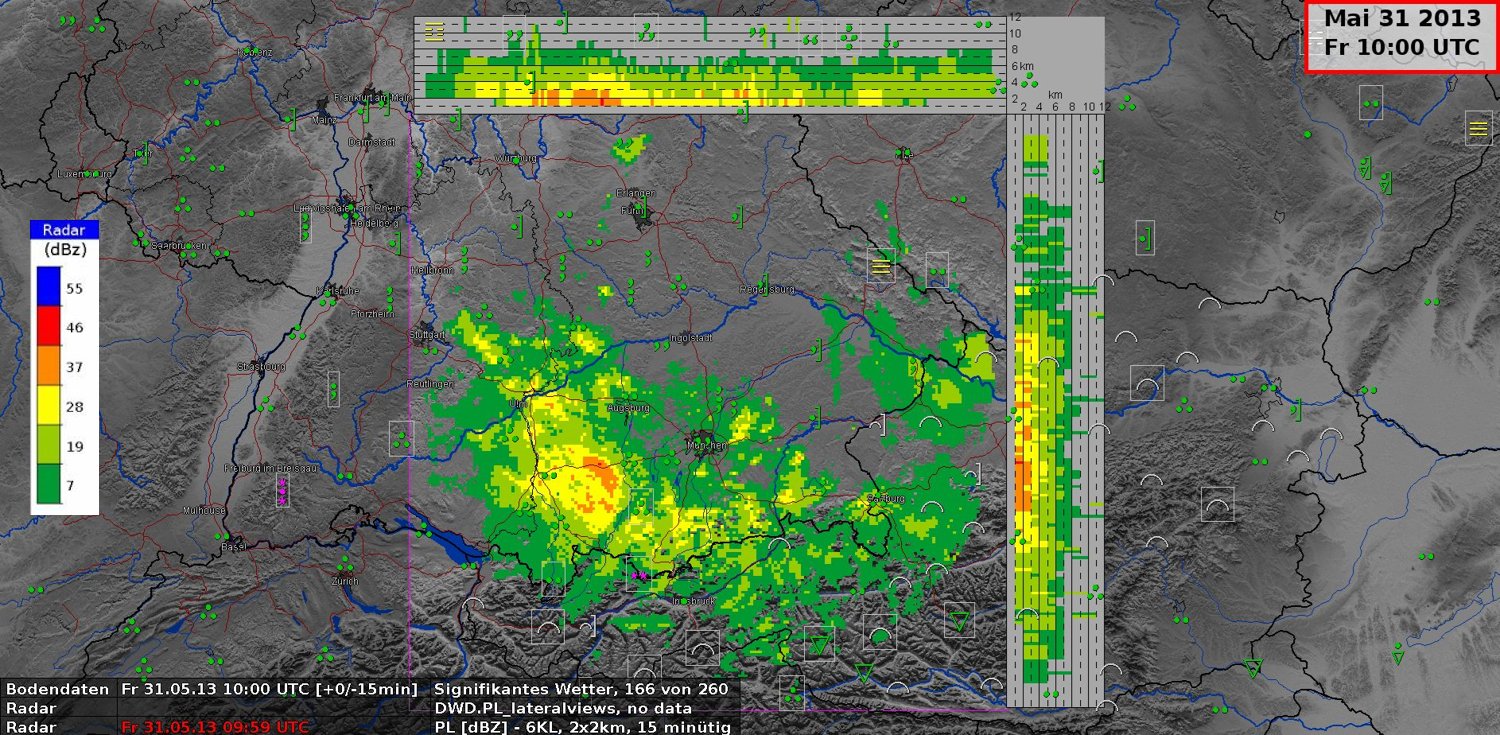
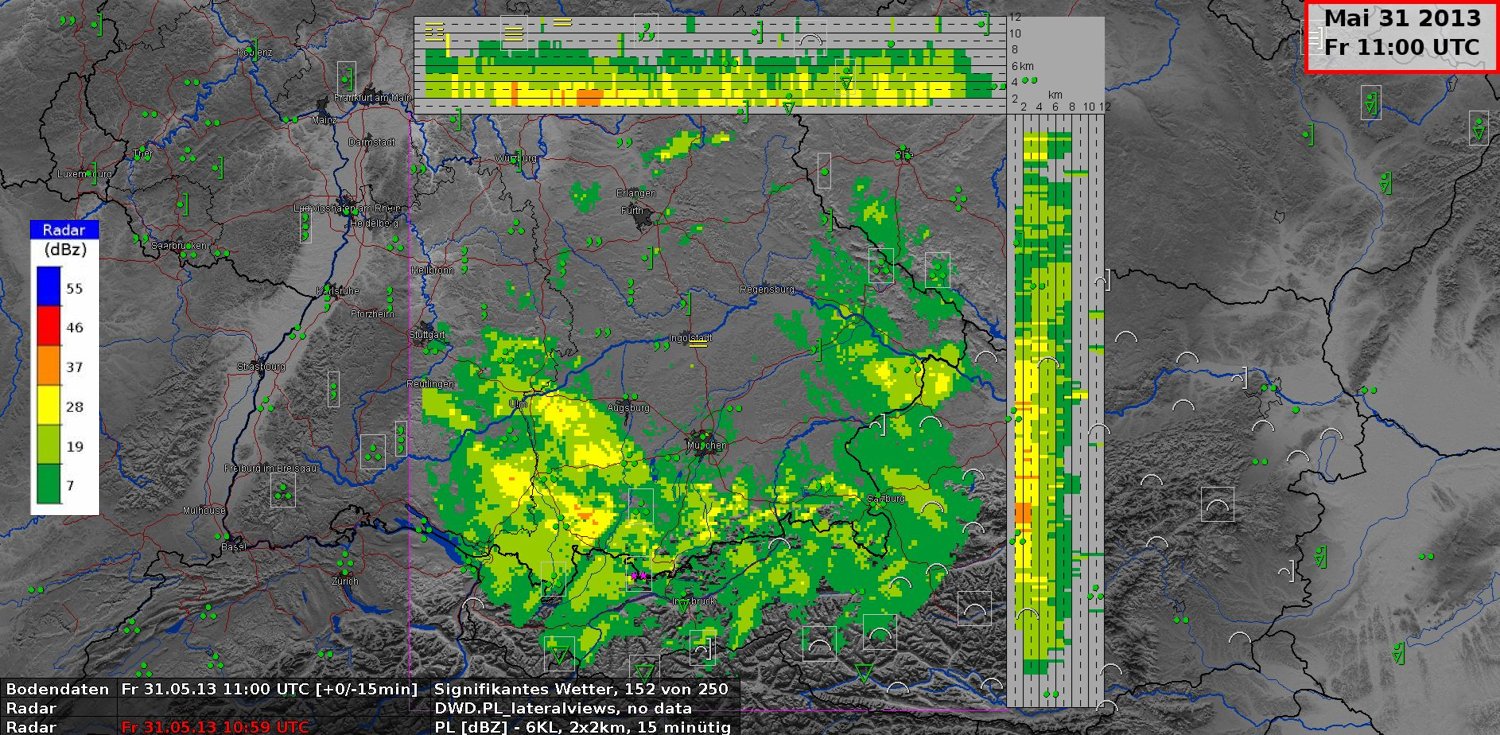
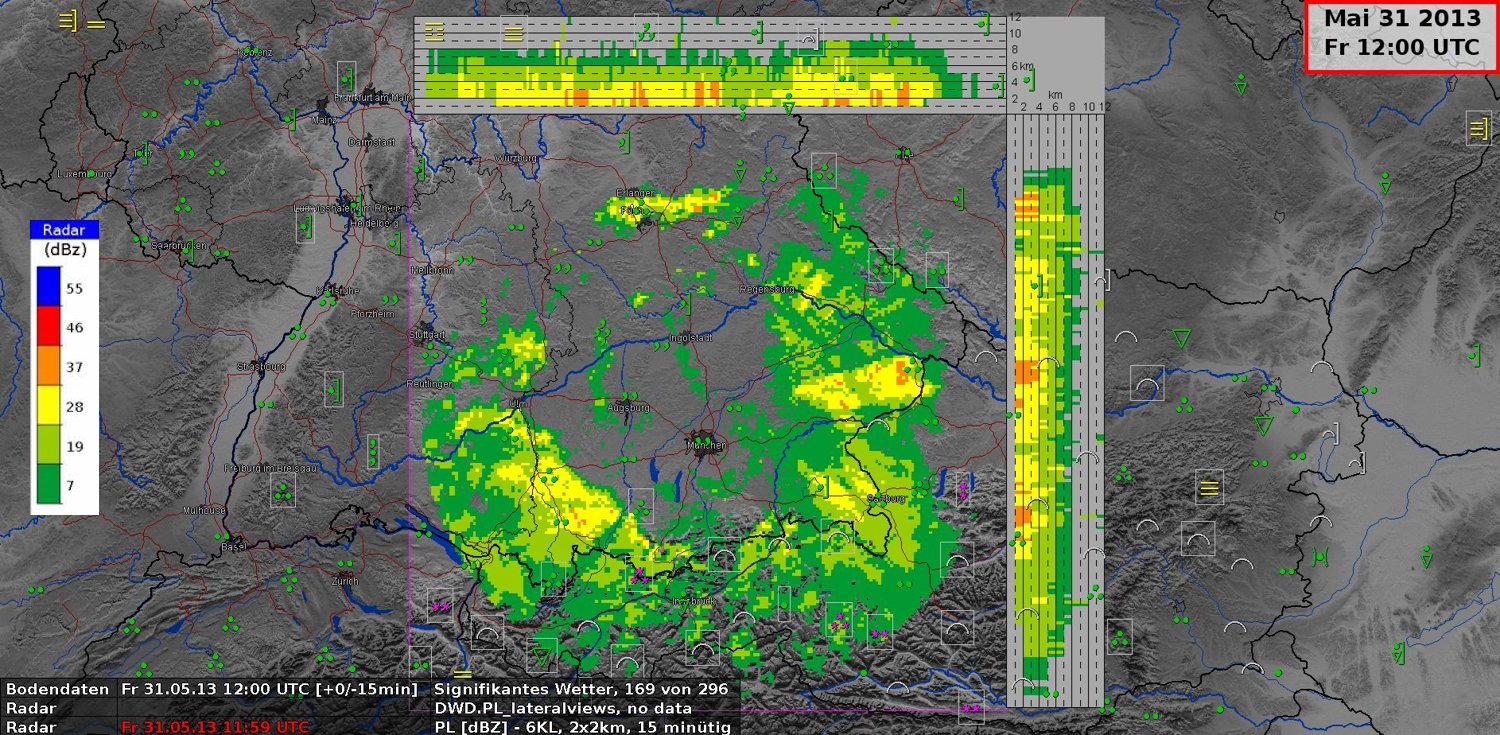
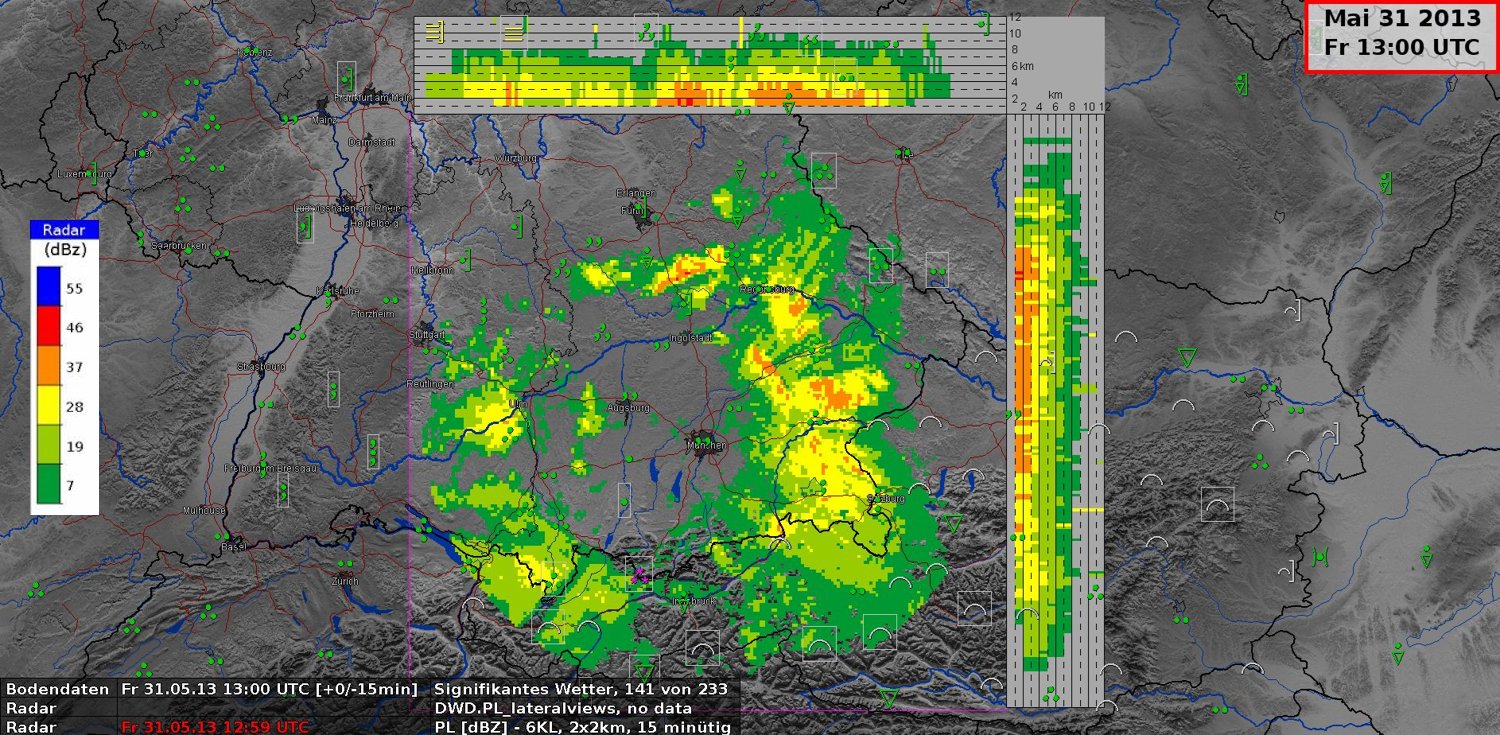
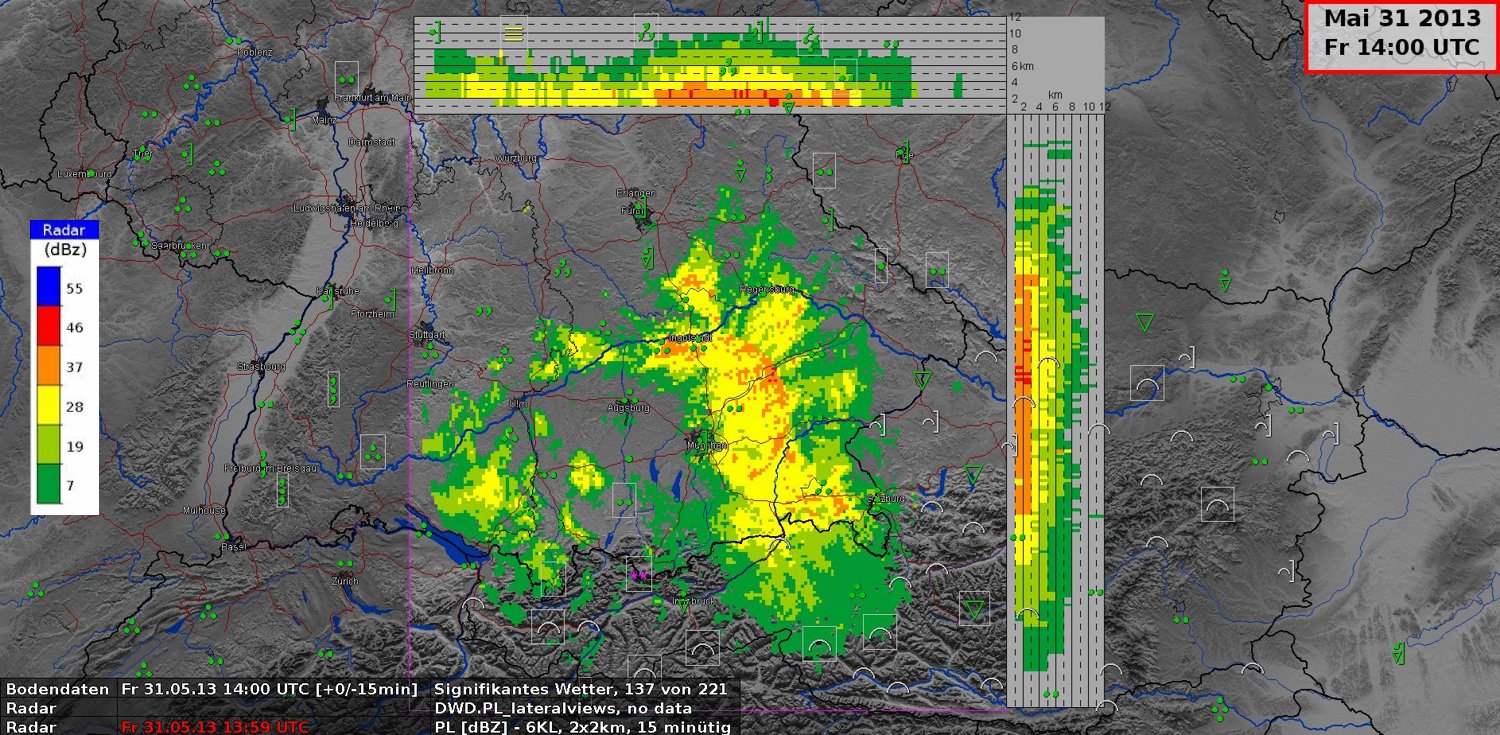
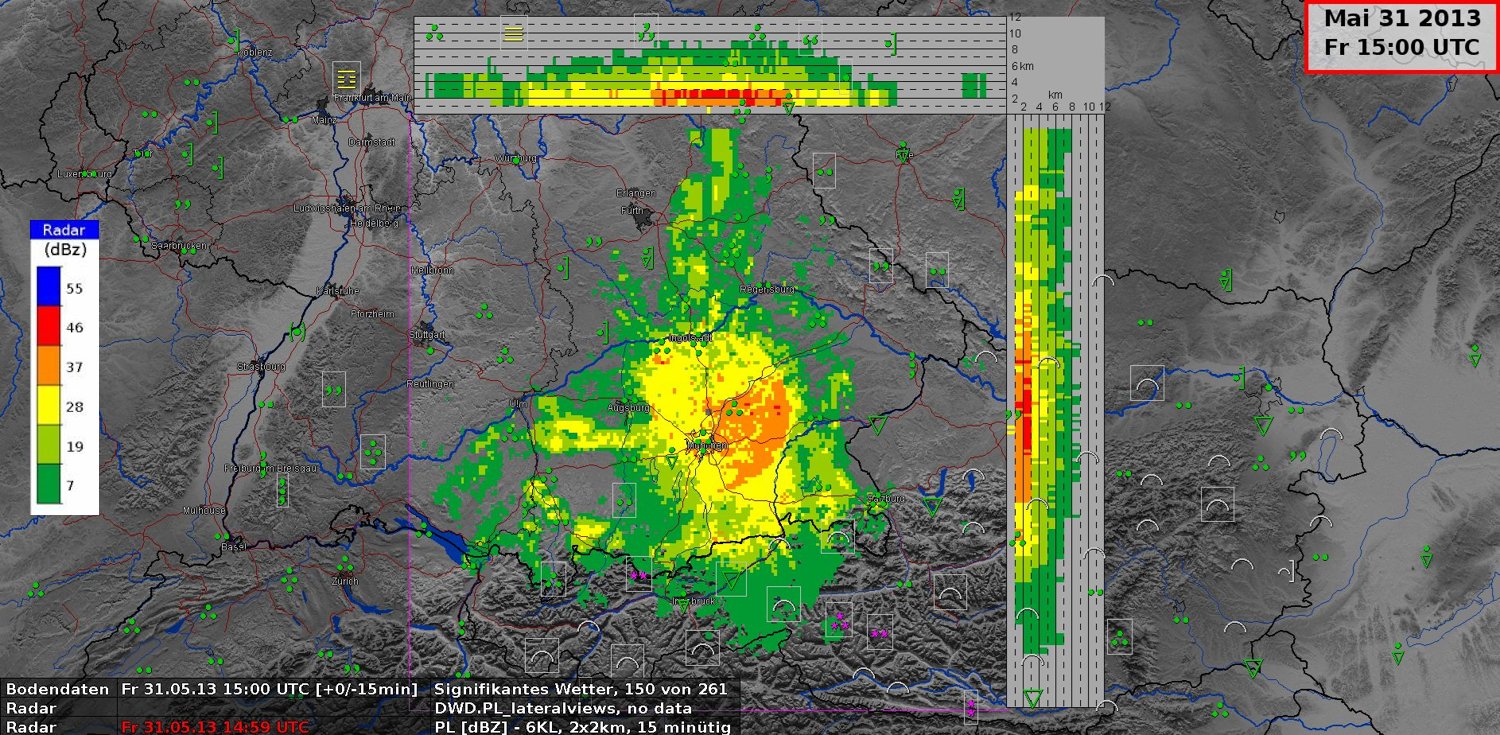
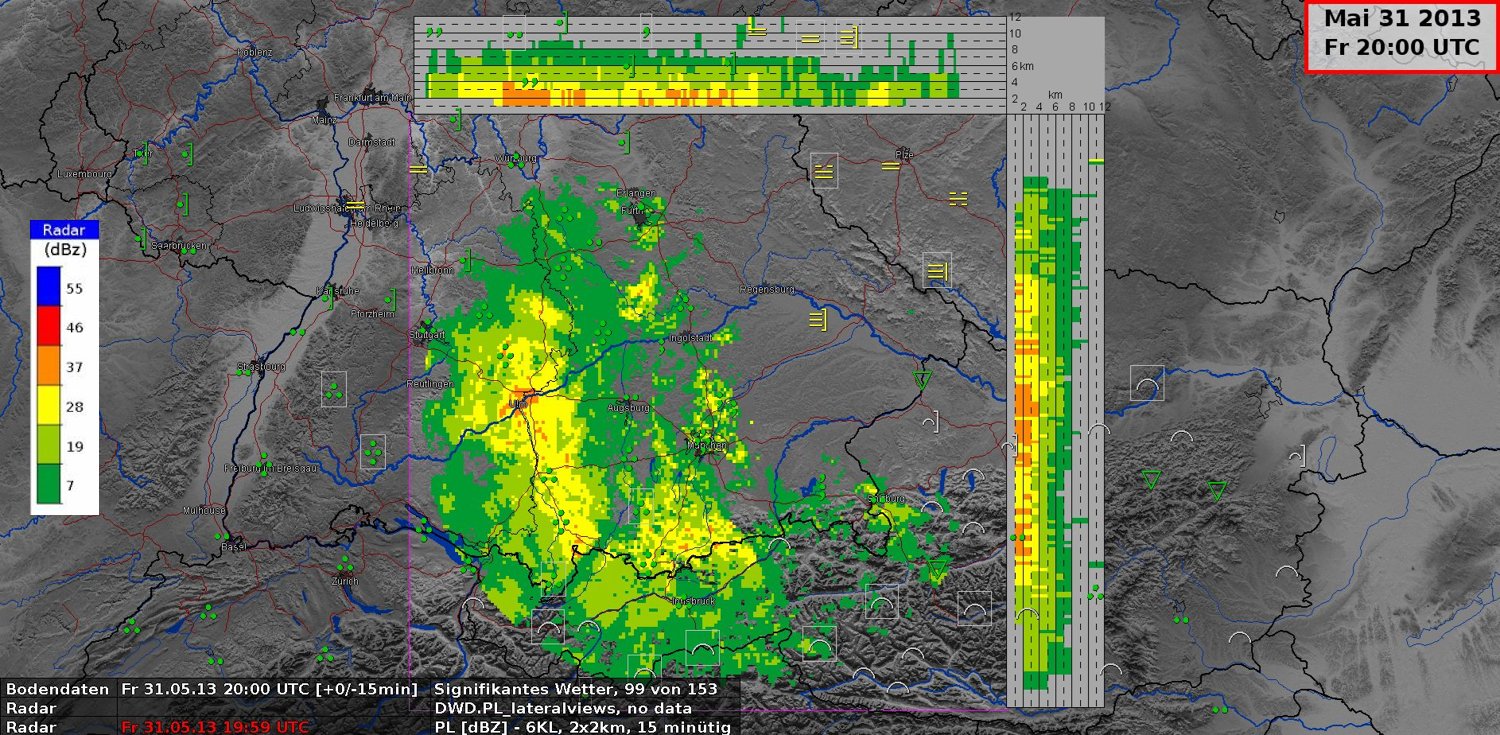
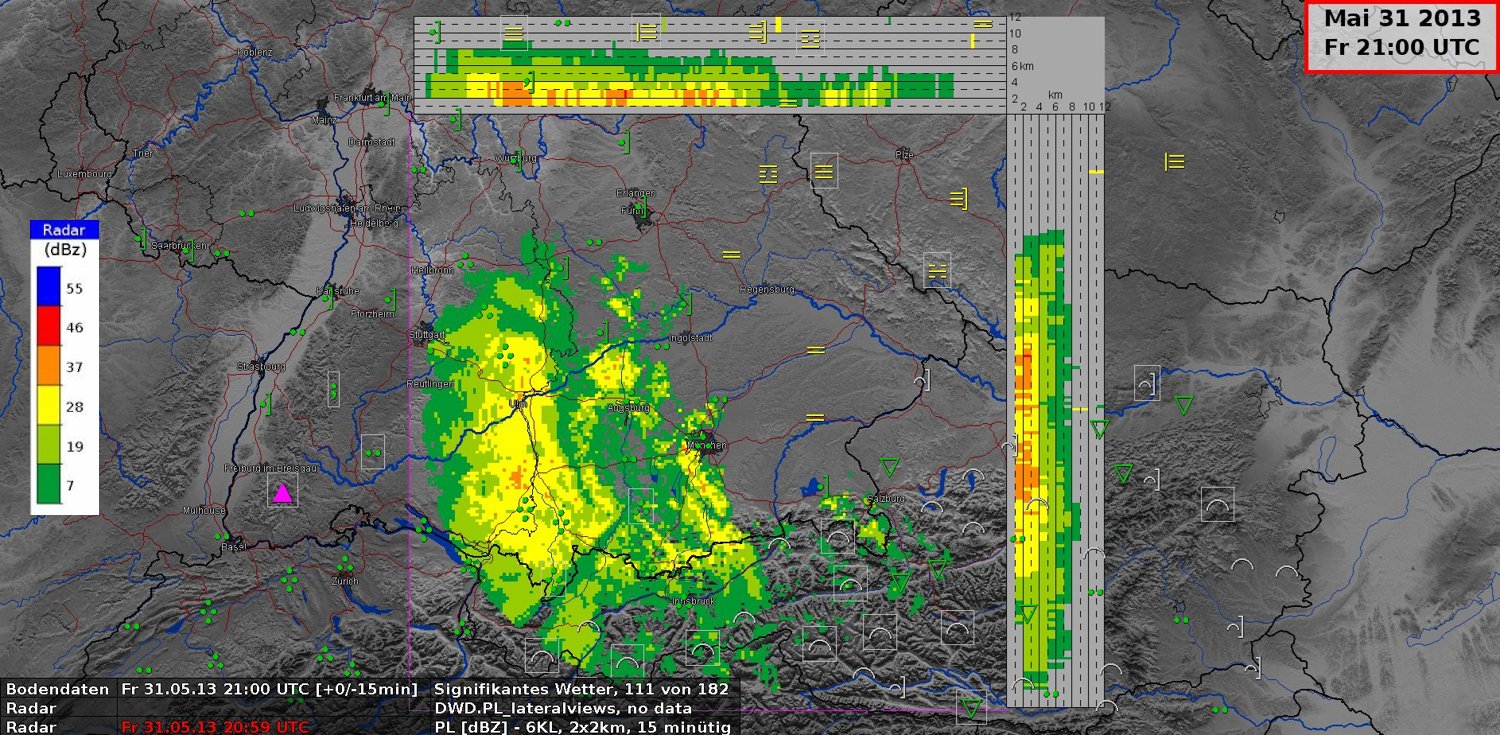
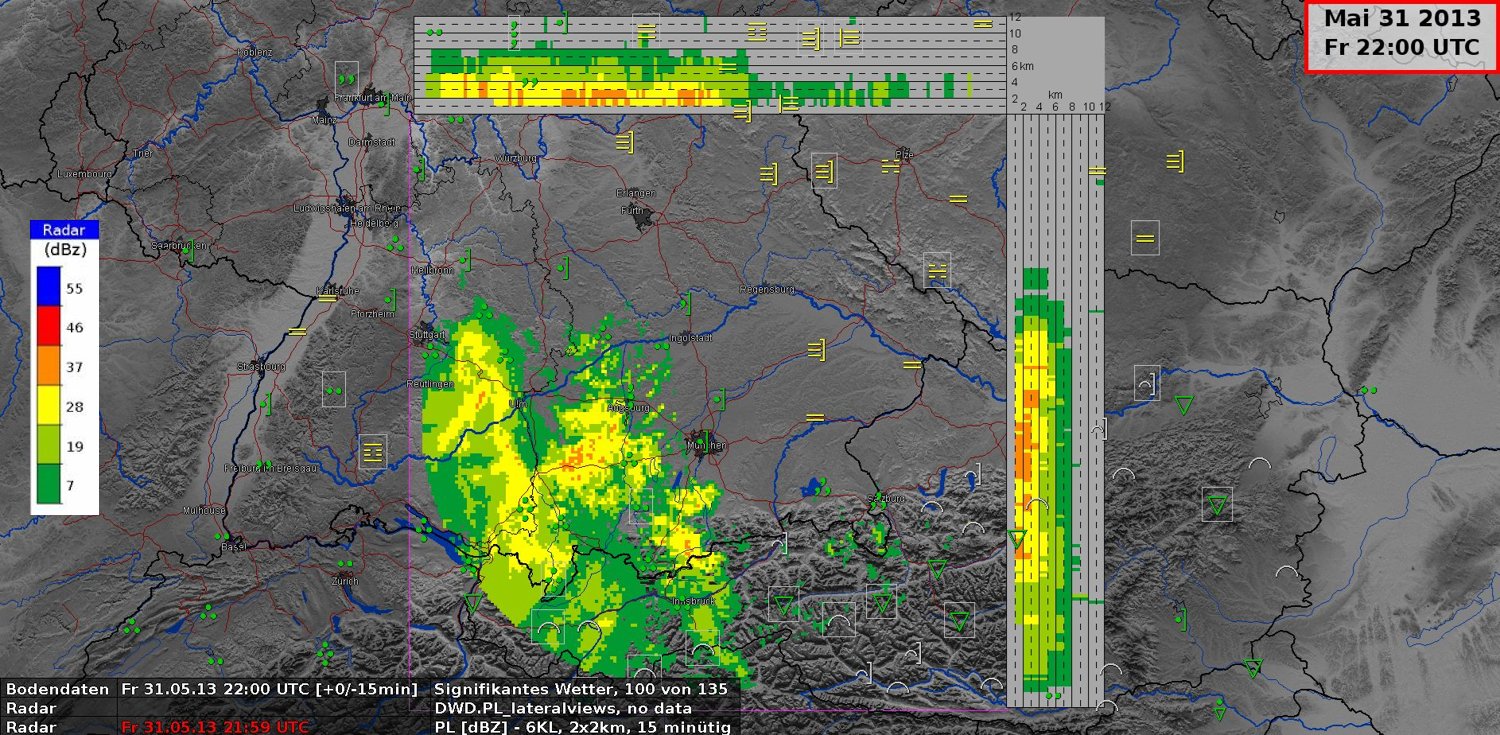
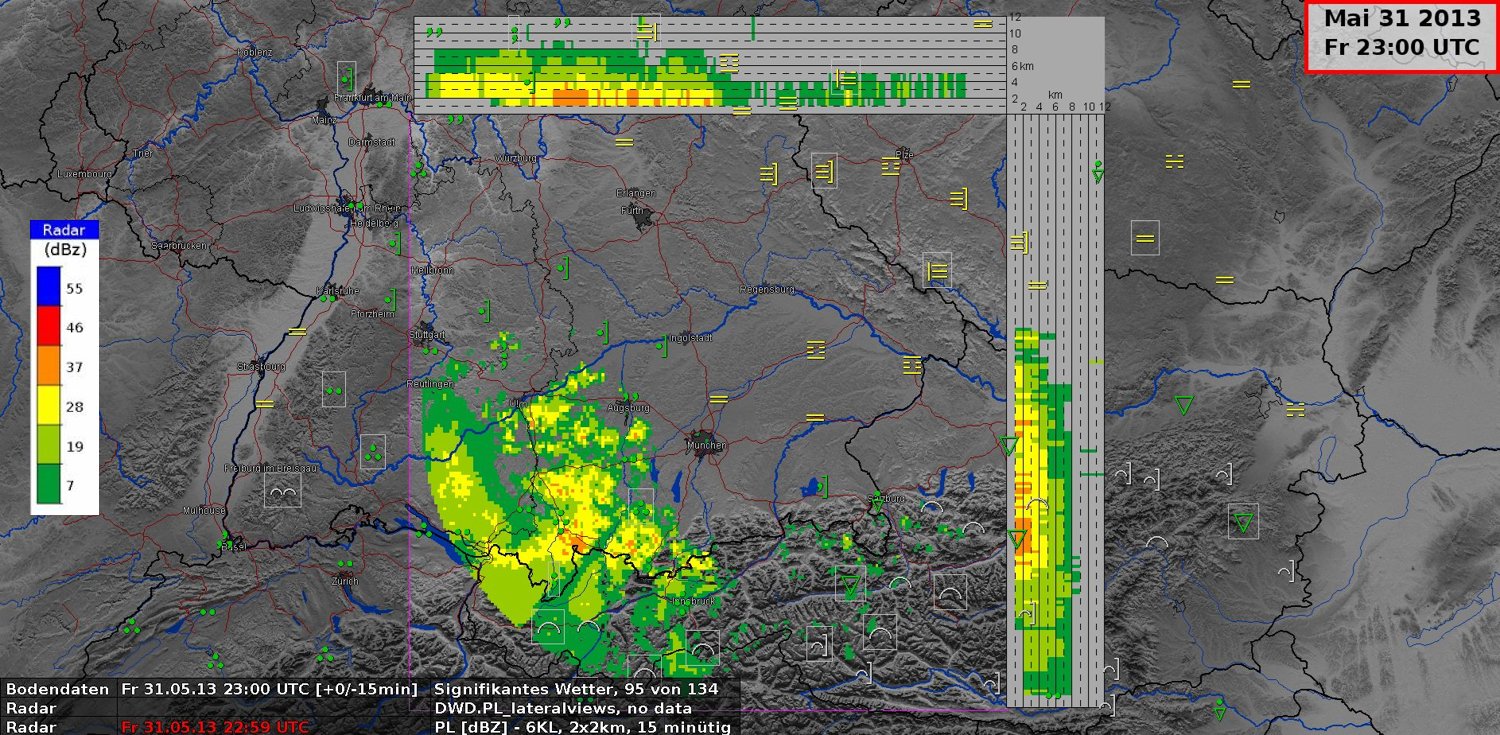
Local radar image "PL" from a volume scan in the Munich area
With 3-dimensional information, the forecaster will have an idea about the vertical precipitation structure up to 12 km. Here we see precipitation from nimbostratus clouds, with ice particles which have lower reflectivity shown in yellow and greenish colors above 3 km. In the melting layer between 2 km and 3 km, the reflectivity is very high with more than 46 dBZ, shown in a reddish color. This is seen clearly at 15:00 UTC. At lower altitudes the radar signals have lower reflectivity due to the presence of rain droplets.
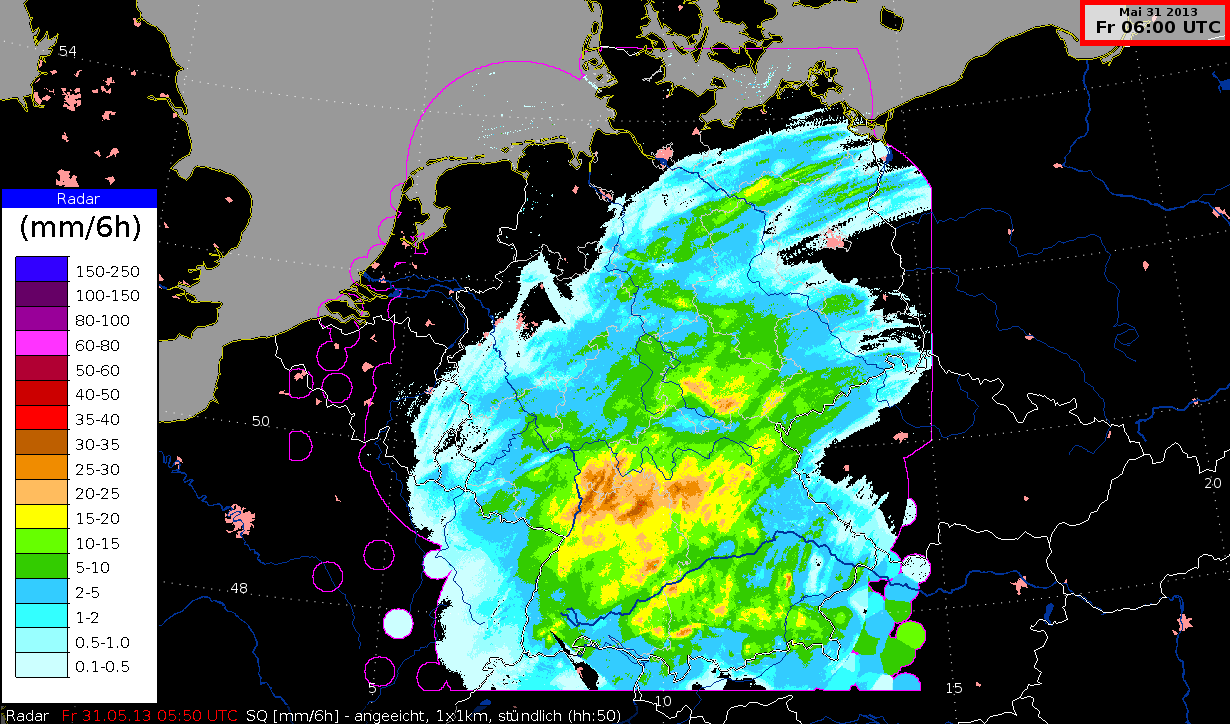
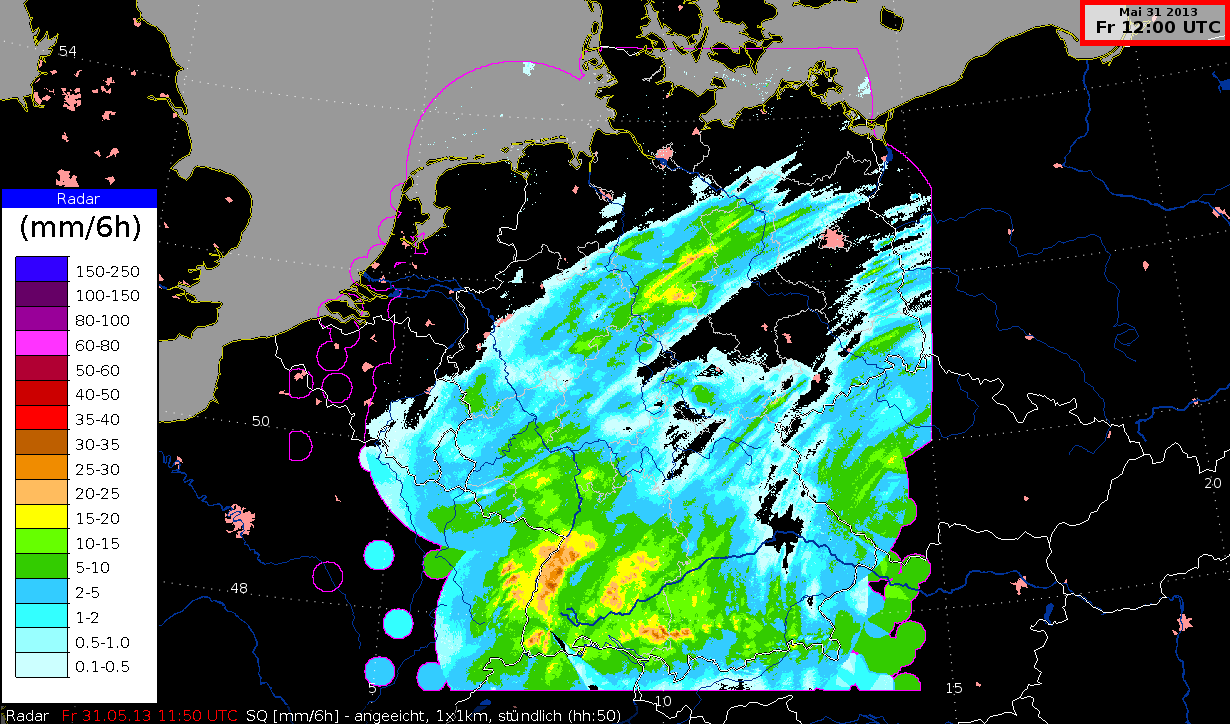
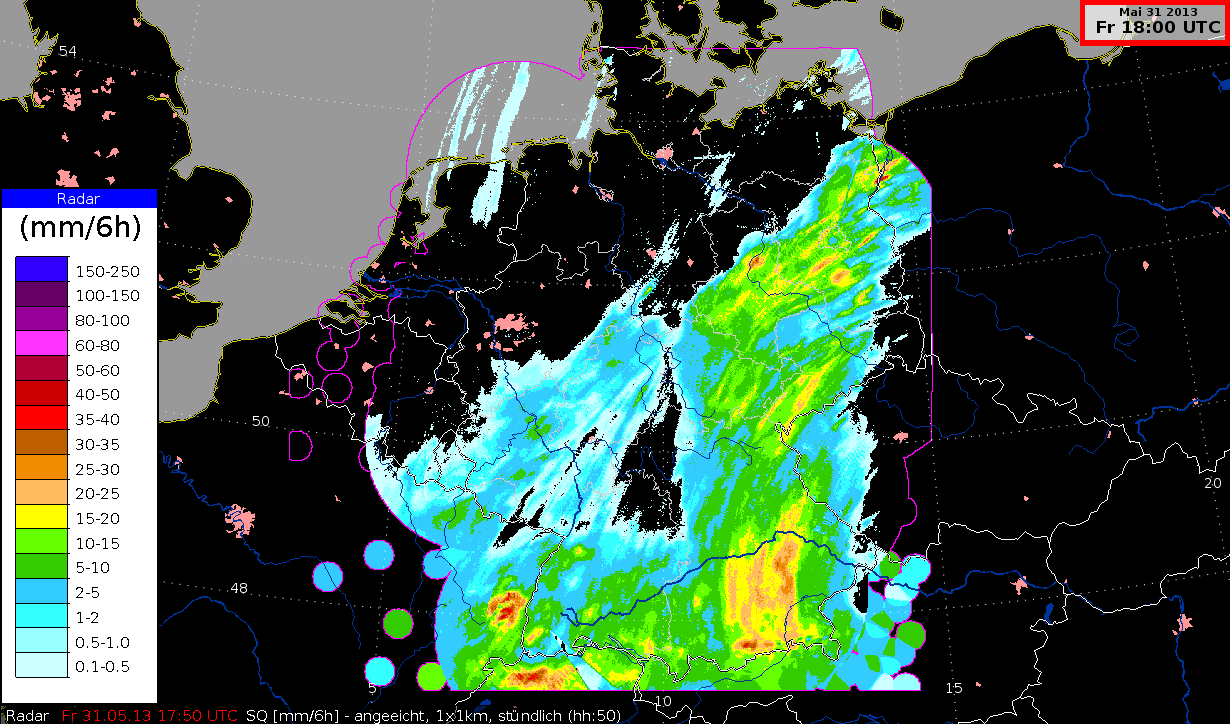
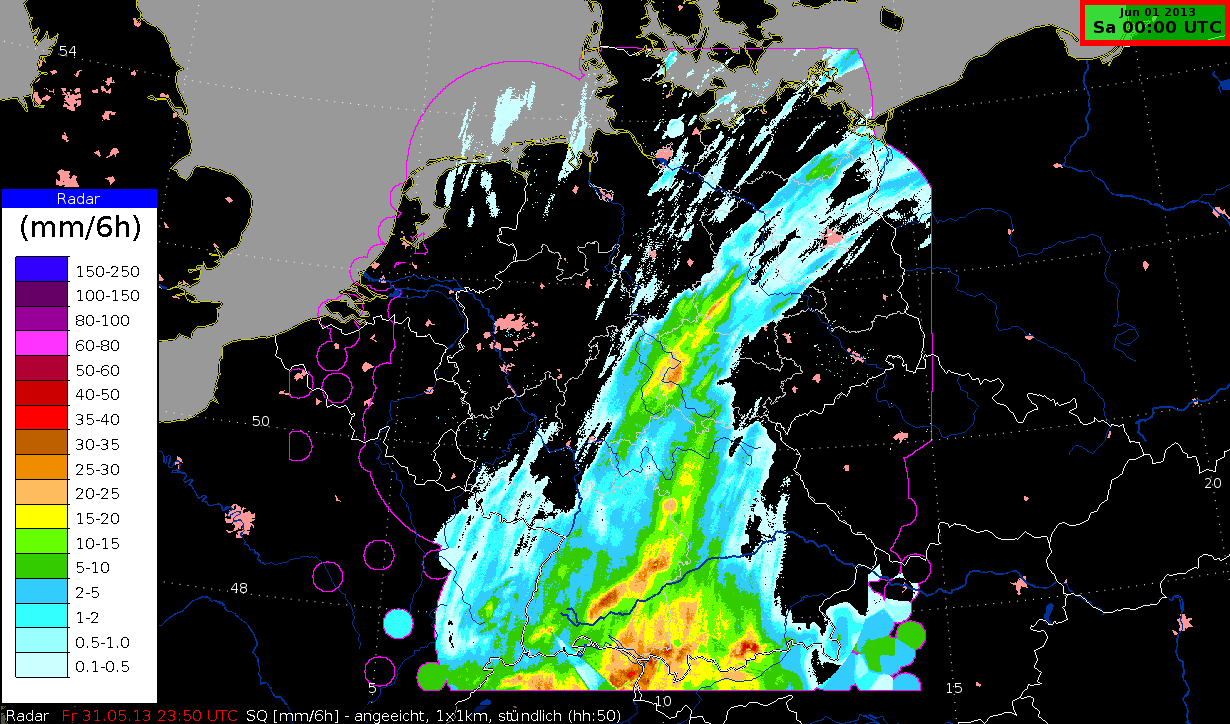
Composite image "SQ" with calibrated radar values in mm per 6 hours
Radar measurements can be improved by combining them with data from ca. 1000 ombrometer stations in Germany. Together they provide accurate results, measured in mm, every 6 hours. This data forms the basis of flood forecasts in Germany.
Shown here is a summary of the six hours before the image's timestamp. The movement of the cells is typical for these images and it serves to indicate wind direction.