Chapter IV: Synoptic situation
Table of Contents
- Chapter IV: Synoptic situation
- Synoptic situation
Synoptic situation
On 29 and 30 May the center of a low pressure area moved from the West Alps over Upper Italy northeastward. A trough from this upper low moved from the Adriatic over the Dinaric Alps and into the Pannonian Plain. This was the beginning of the low's intensive development, and the point where the air mass began to rise in a wider area. Warm air moved around the low to Germany, and this process brought about intensive formation of precipitation.
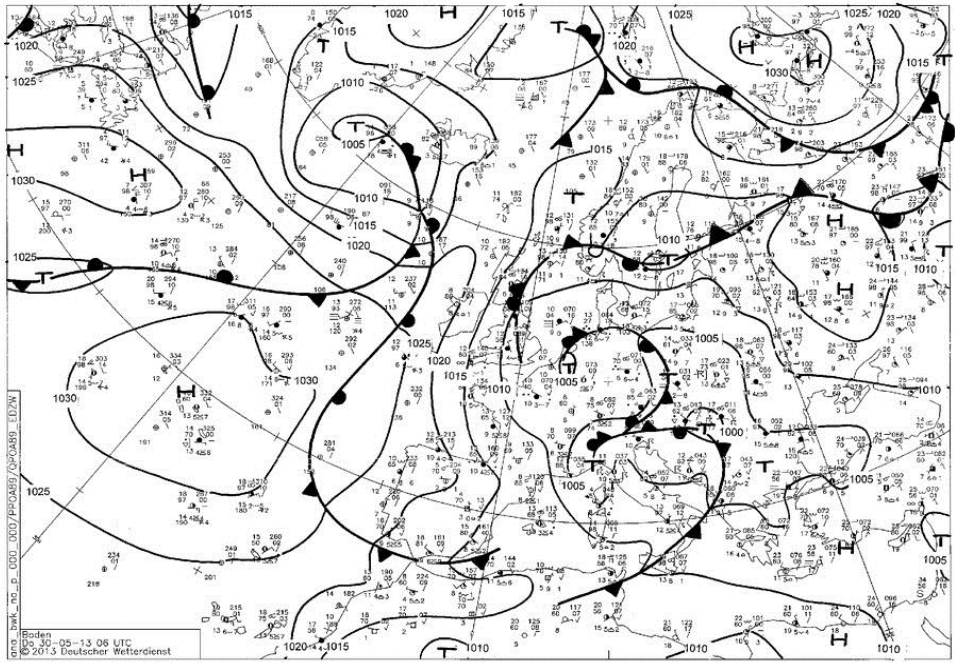
Figure 4.1: Analyses of mean sea level pressure and fronts. 30 May 2013, 06:00 UTC. Source: DWD
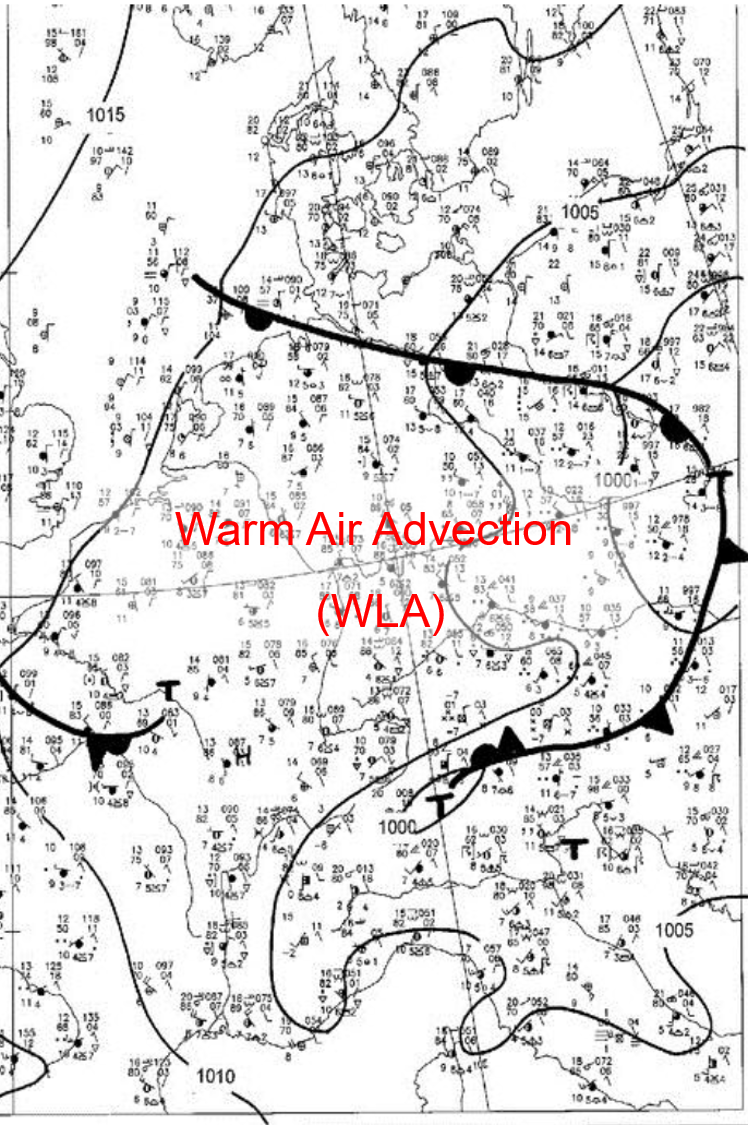
Figure 4.2: Analyses of mean sea level pressure fronts. 30 May 2013, 15:00 UTC. Source: DWD
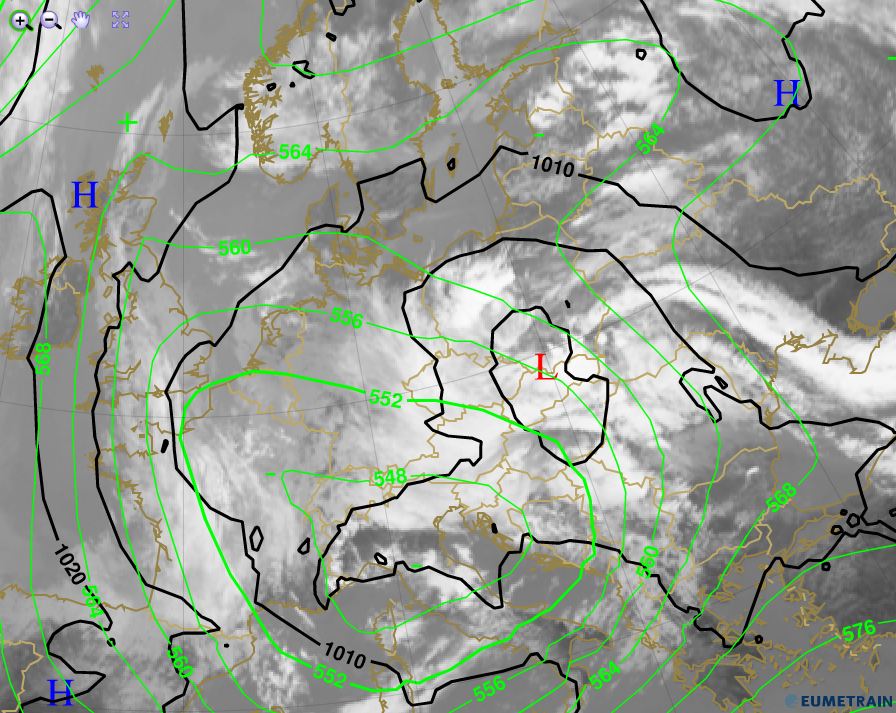
Figure 4.3: Mean sea level pressure (black lines) and geopotential height at 500 hPa (green lines)
IR10.8, 30 May 2013, 12:00 UTC. Source: EUMeTrain, ePort
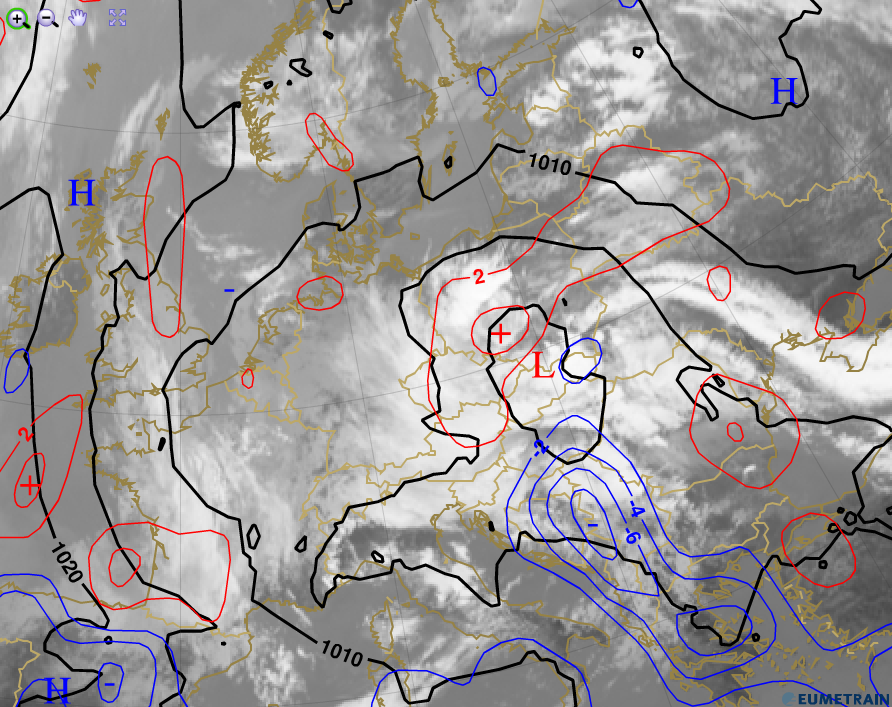
Figure 4.4: Mean sea level pressure (black), temperature advection at 700 hPa (red-blue).
IR10.8, 30 May 2013, 12:00 UTC. Source: EUMeTrain, ePort
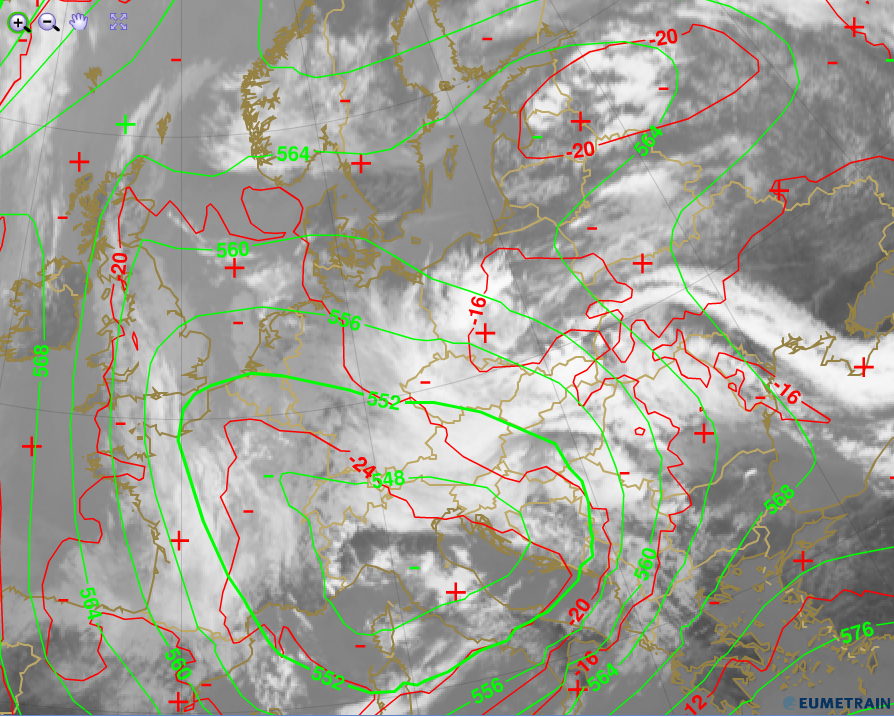
Figure 4.5: Geopotential height at 500 hPa (green) and temperature at 500 hPa (red). IR10.8, 30 May 2013, 12:00 UTC. Source: EUMeTrain, ePort
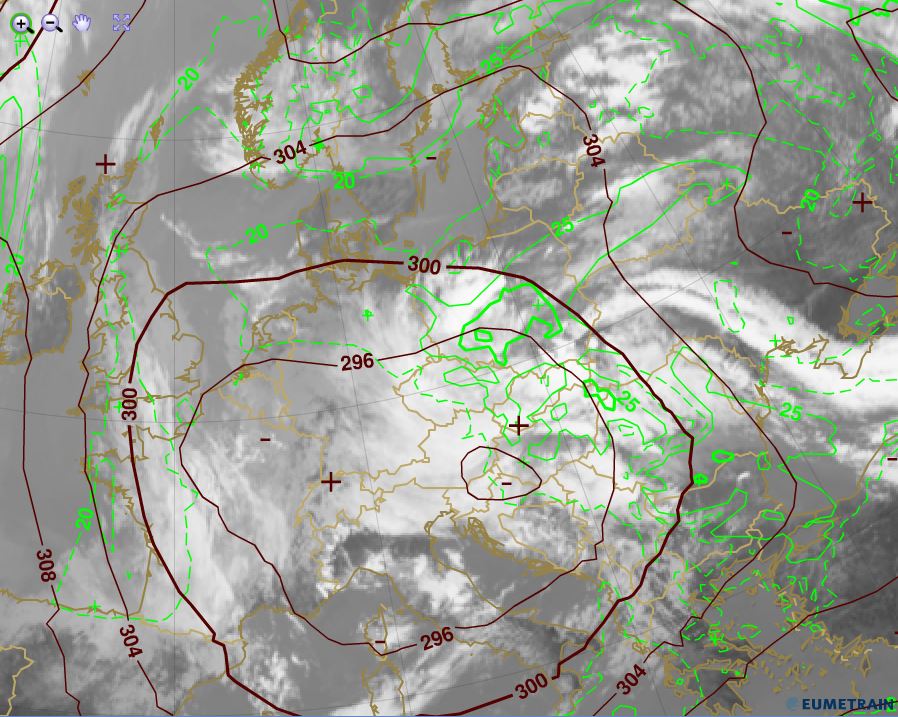
Figure 4.6: Geopotential height at 700 hPa (black) and total precipitable water (green). IR10.8, 30 May 2013, 12:00 UTC. Source: EUMeTrain, ePort
As seen in Fig. 4.5, the coldest air (below -24°C) is found near the upper low around 500 hPa.
Cold air advection affected an area from Croatia to Greece, while warm air advection was dominant over Poland (Fig. 4.4).
In the middle troposphere the air flow comes from the southeast. The surface low strengthened this influence and moved toward Bohemia on a track quite similar to a Vb cyclone. A northwesterly airflow started along its west flank.
An unstable air mass and moist air at all levels flowed into northeast Germany along the trough's northern flank. The amount of total precipitable water was very high (Fig. 4.6).
The warm front over northern Germany (Fig. 4.2) stands out clearly in the mean sea level analysis from 30 May. In the north and northeast of Germany the temperature maxima are over 20°C, e.g. 23.4°C in Angermünde.
The temperature values in the rainy areas in Saxony and north of the Alps are below 10°C. The warm air advection intensified greatly in the second half of 30 May 2013 (Fig. 4.7 and 4.8).
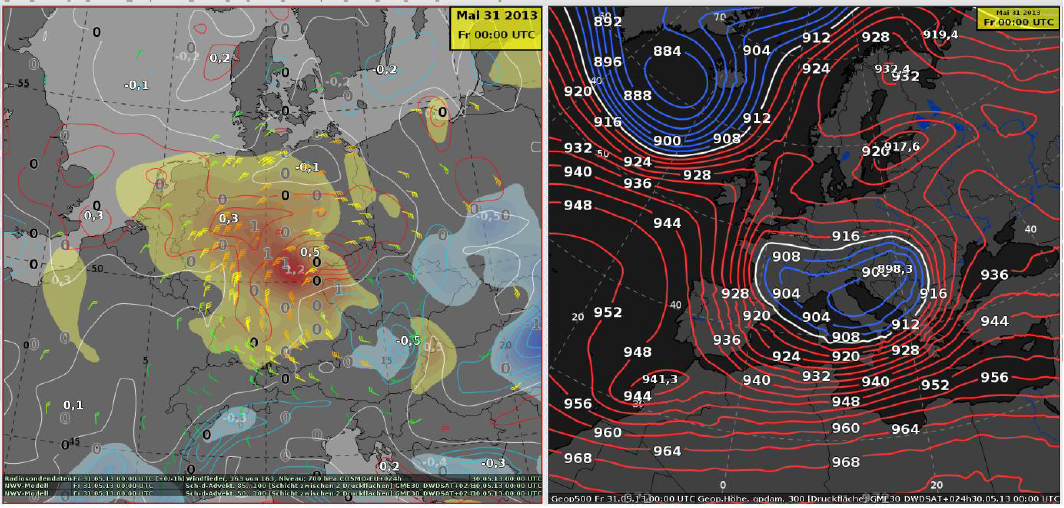
Figure 4.7-8: Forecast for 31 May 2013, 00:00 UTC.
Fig 4.7 (left): Advection at 500/1000 hPa (area) and 850/1000 hPa (isolines), wind at 700 hPa, warm advection in yellow and red areas, and cold advection in blue areas.
Fig. 4.8 (right): Geopotential height at 300 hPa and the central low in blue lines. Source: DWD (1)
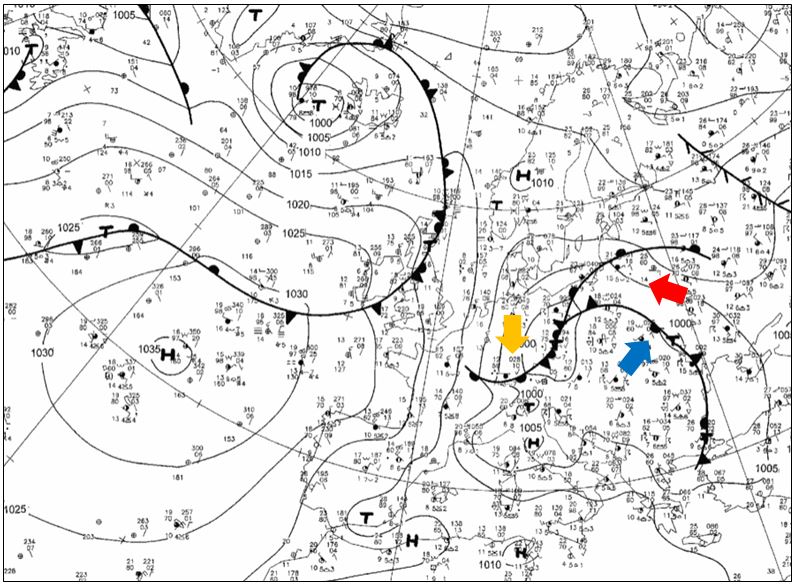
Figure 4.9: Surface Analyses with fronts, 31 May 2013, 12 UTC, source: DWD Movement of the cold airmass (blue) and the warm airmasses (red and orange). Analysis of surface fronts from 31 May at 12 UTC. The arrows indicate the directions in which the air masses moved: blue for the cold air mass, and red and yellow for the warm air masses. Source: DWD
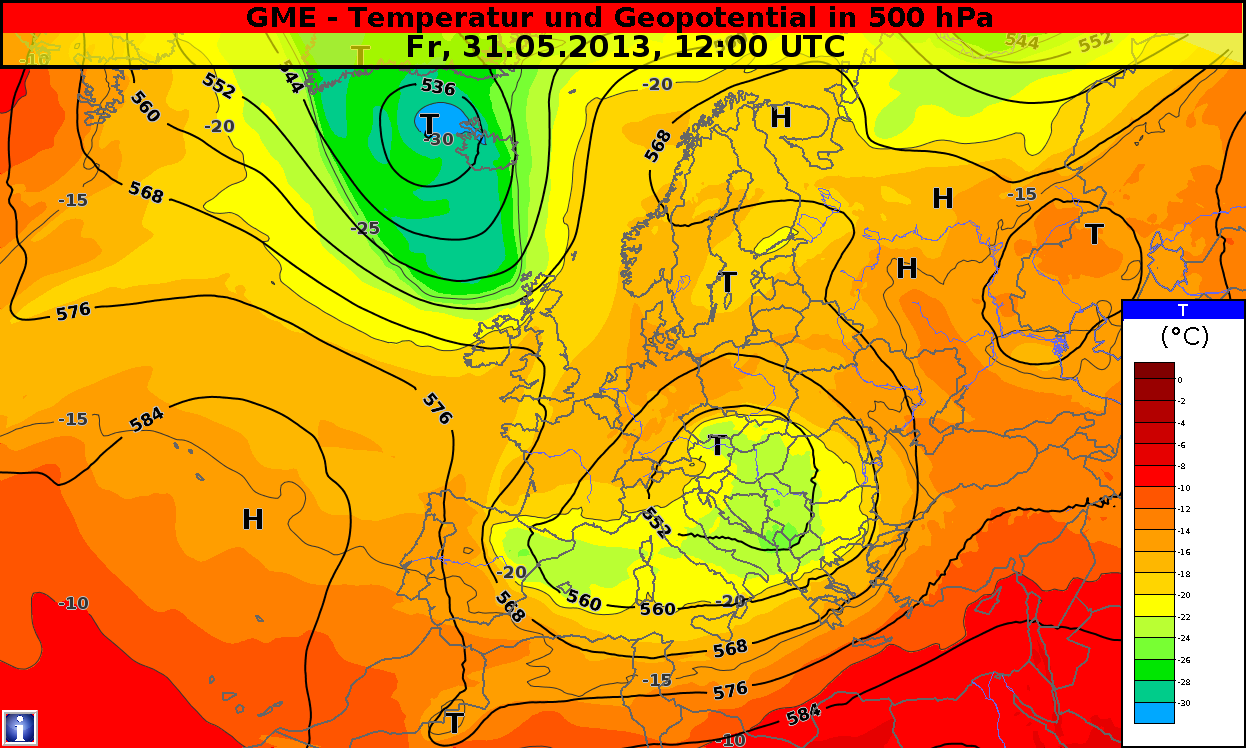
Figure 4.10: Geopotential and temperature at 500 hPa, 31 May 2013, 12 UTC. Source: DWD
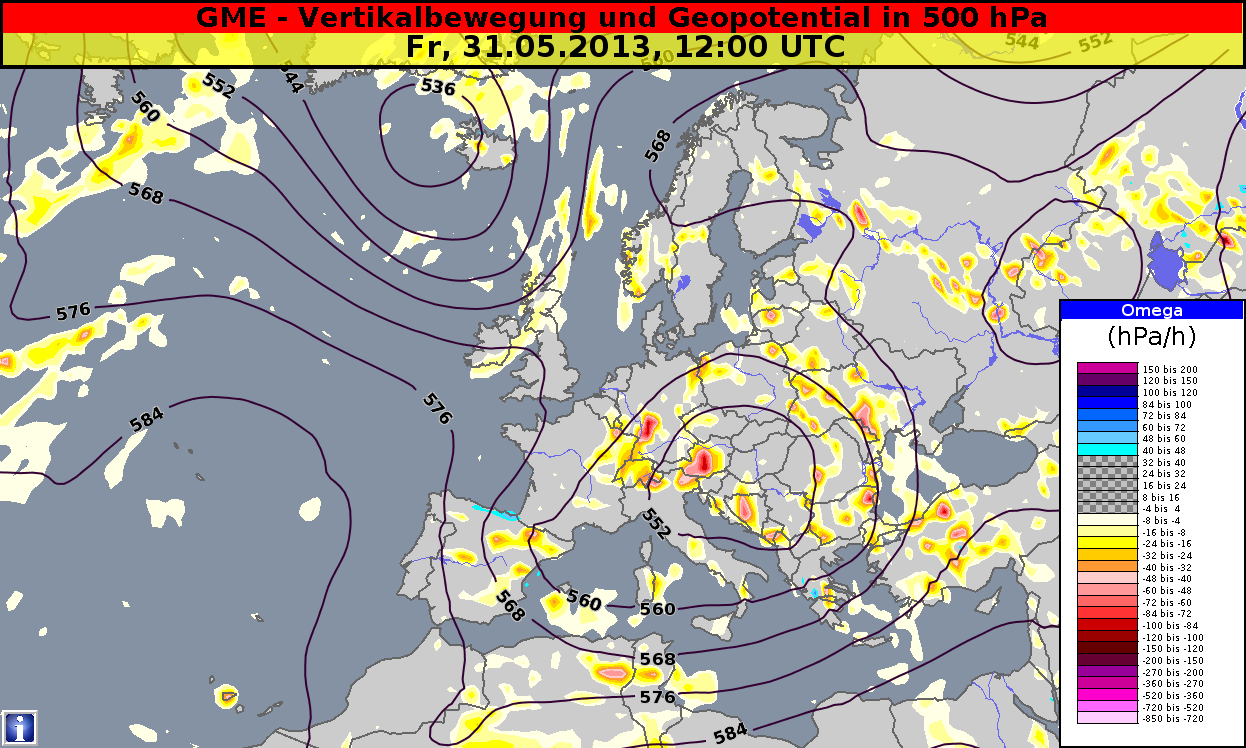
Figure 4.11: Geopotential and omega, 31 May 2013, 12 UTC. Source: DWD
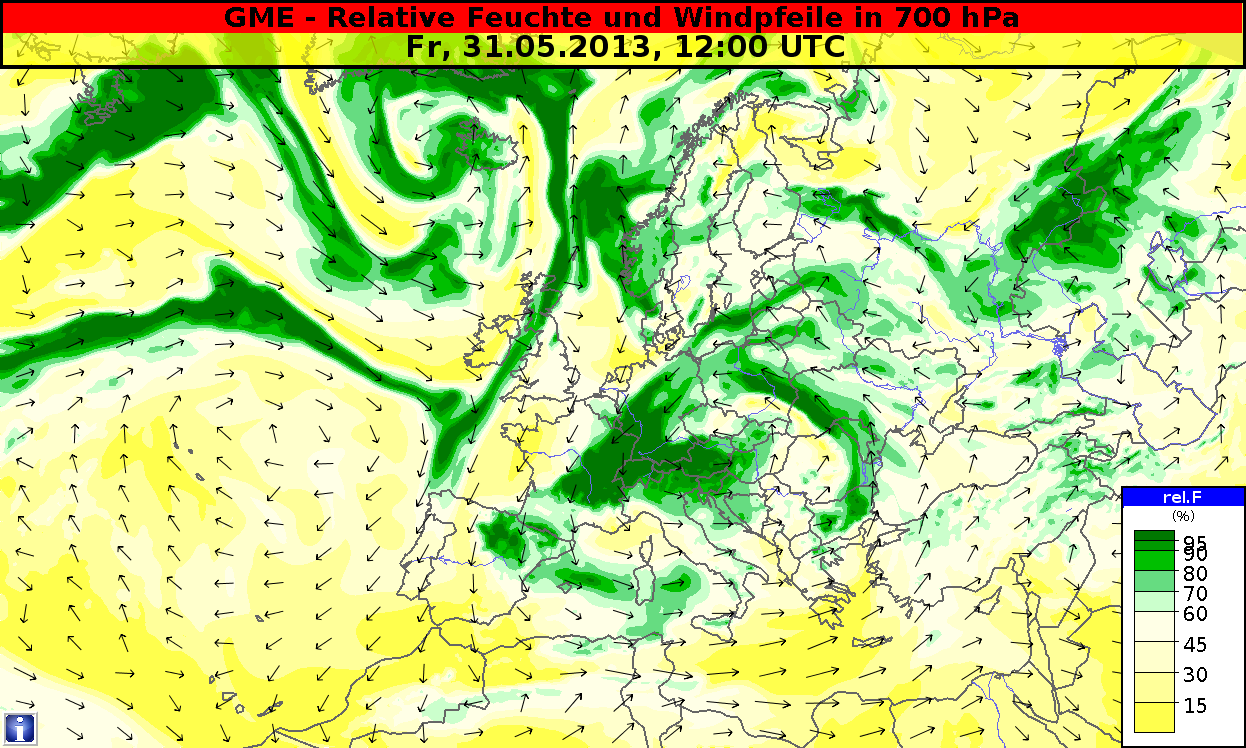
Figure 4.12: Relative humidity and wind arrows at 700 hPa, 31 May 2013, 12 UTC. Source: DWD
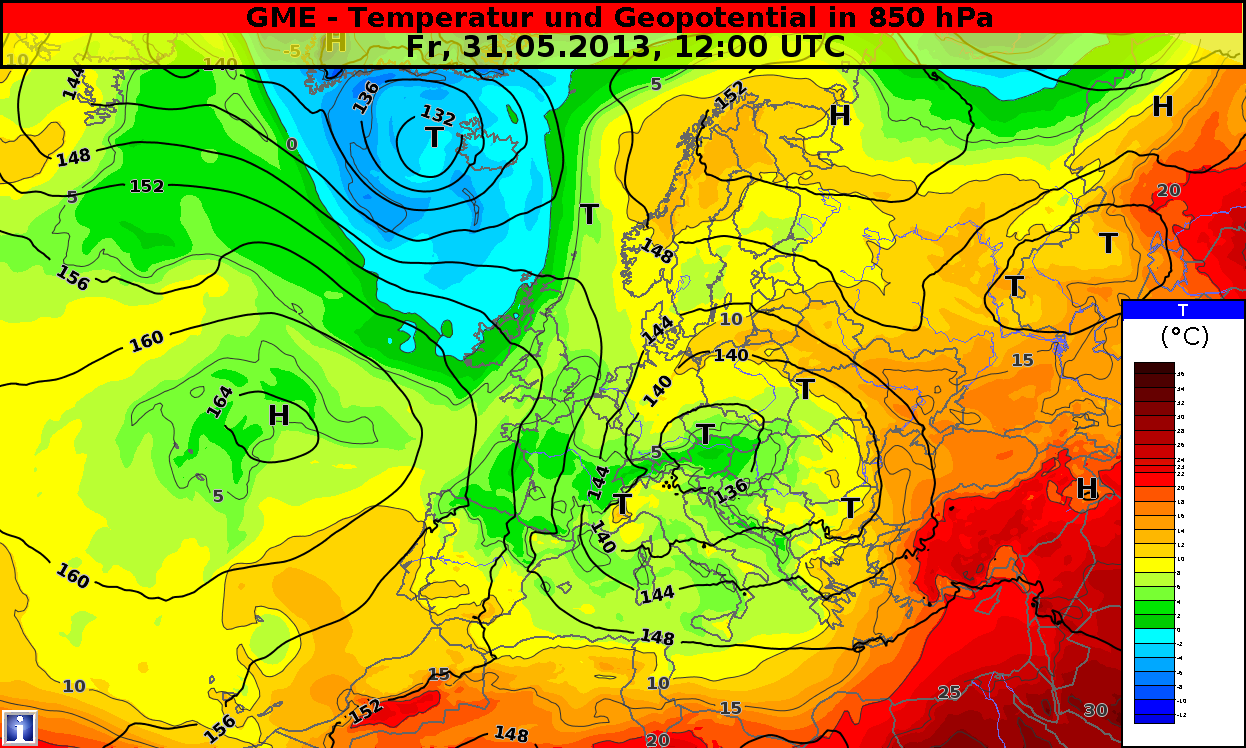
Figure 4.13: Geopotential and temperature at 850 hPa, 31 May 2013, 12 UTC. Source: DWD
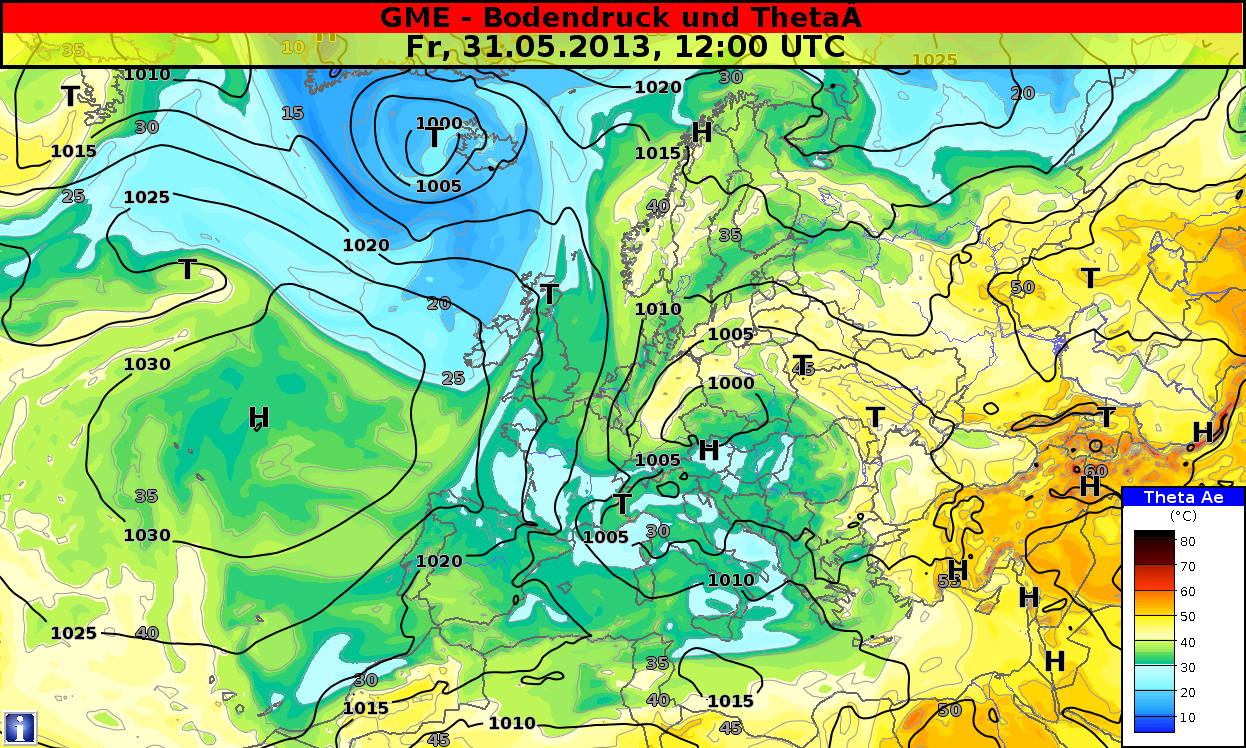
Figure 4.14: Mean sea level pressure and theta-e, 31 May 2013, 12 UTC. Source: DWD
On 31 May a second thrust of warm air was moving around the low, after which precipitation intensity increased again. This was the reason for continuous rain lasting over two days (2 and 3 June) in the middle and southern parts of Germany. Figures 4.9 through 4.14 depict the situation on 31 May at 12:00 UTC.
Fig. 4-13 shows the low over Bohemia and the tongue of warm air that extends from Poland over the northern and southwestern parts of Germany. The theta-e chart in Fig. 4 gives an even better contrast of the values. The extended clouds with high humidity (Fig. 4.12) are seen in Fig. 4.11's omega chart with small areas that contain strong vertical motion.