
Dust polluted thick ice clouds
Thick ice clouds are depicted in red or yellow colours in the Severe Storms RGB images. In the areas where the particle size is small and/or the cloud top is very cold it will appear yellow. When ice particles become large the cloud colour will turn into red. Transitional colours (e.g. orange) may also appear.
Dust polluted ice clouds usually depict yellow in the Severe Storms RGB, because their tops consist of small ice crystals due to the high number of the condensation nuclei. As a consequence clouds which are usually red (like a front) on Severe Storms RGB may become yellow in case they are highly polluted.
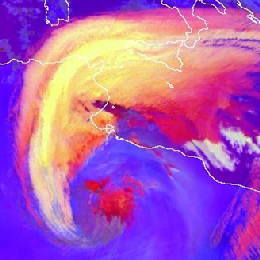
Below two different RGB images are seen. In the Dust RGB (left) the pink colour shows a fully developed, spectacular dust spiral in conjunction with a low-level depression. Generally, the entrainment of desert dust into Cb or Ns clouds leads to the formation of small ice particles, and indeed the yellow colour of the high-level ice clouds in the Severe Storms RGB image (right) indicates the presence of small ice crystals.
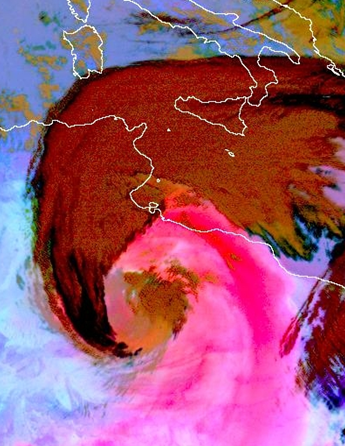
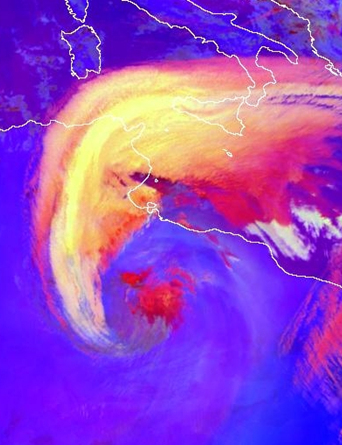
Meteosat-8, Dust RGB image (left) and Severe Storms RGB image (right) for 22 February 2007, 12:00 UTC
Small ice particles can stay up in the air without evaporating or falling out, such clouds typically preserve their characteristics over a longer period of time, see below the images of three successive days. The colour is still yellowish even 48 hours later.
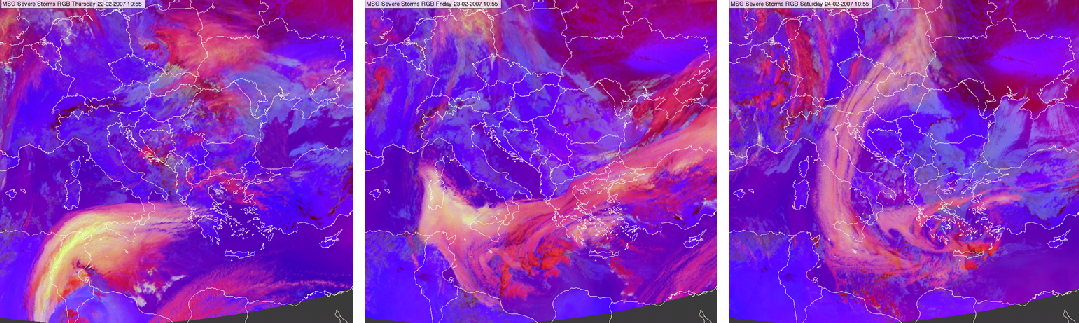
Meteosat SEVIRI Severe Storms RGB images for 22 (left), 23 (middle) and 24 (right) February 2007, 10:55 UTC
Note that small ice crystals may appear on the cloud top not only due to pollution. Small ice crystals can be as well observed: on the top of deep convective clouds with strong updraft, on the tops of storms with cold (high) cloud base and in high level lee clouds.
Explanation of the colours of highly polluted thick ice clouds (see the recipe):
• The difference (WV6.2 – WV7.3) is almost zero yielding a relative high input because the temperature range between -35 K and +5 K is considered.
• The difference (IR3.9 – IR10.8) is high in case the cloud top consists of small particles,
• The difference (NIR1.6 – VIS0.6) is low because the ice cloud reflectivity values are much lower around 1.6 micrometer than around 0.6 micrometer.
As a consequence the signal will be intense in red and green and low in blue colour beams for highly polluted thick ice clouds.