Air mass analysis and stability
In fact, the air mass was very warm and moist, characterized by a wet bulb potential temperature of 18-20°C at 850 hPa (usually classified as equatorial origin) and with Total Precipitable Water (TPW) values of almost 40 mm (Figure 11).
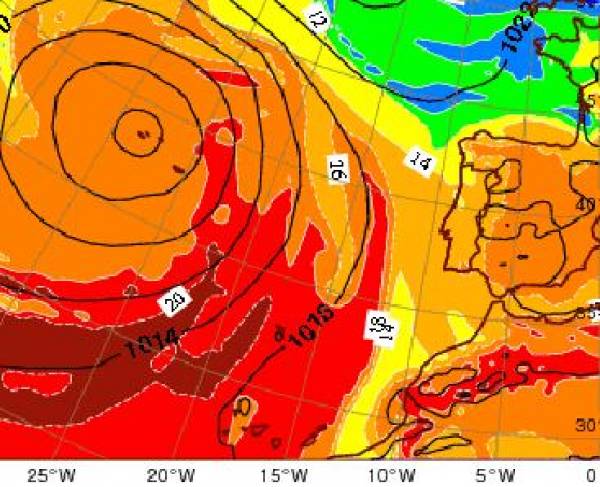
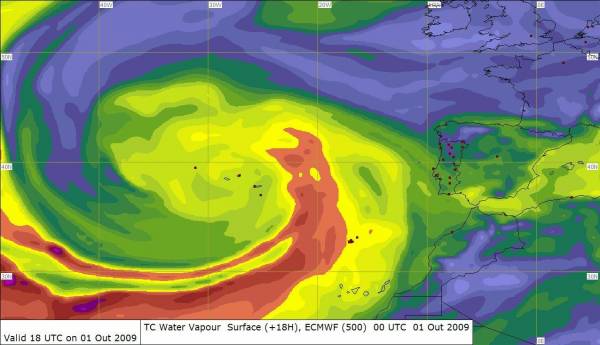

Figure 11: Wet-Bulb Potential Temperature at 850 hPa (in °C, top) and Total Precipitable Water (in mm, bottom) on 01/10/2009 at 18 UTC from ECMWF model run on 01/10/2009 at 00 UTC.
A climatological study for Funchal station in Madeira Island for the period 1984-1997 (Costa, 1997), shows that the highest amounts of TPW were in fact found in the trimester of September, October and November, with a maximum of 57.98 mm. The 90th percentile was 31.47 mm, which means that the values for the current event would be in the top 10% of the trimester if the 15 years time period is considered representative.
It is also interesting to see the evolution of ECMWF TPW every 3 hours at Funchal station and compare it with the maximum of 1 hour precipitation in the past 3 hours at both Funchal and Areeiro stations (between 12 UTC on 01/10/2009 until 12 UTC on 02/10/2009). From Figure 12 it possible to confirm that ECMWF TPW forecast varies between 36 and 41 mm, reasonably in the range of the observed values on the sounding from Funchal at 12 UTC (35 and 41 mm). Also, there is no clear relation between values of the TPW and the maximum of 1 hour precipitation (in the last 3 hours), which reached amounts between 12 and 15mm. This may suggest that TPW could be considered as a general air mass proxy for the event but not a proxy for the instant of precipitation.
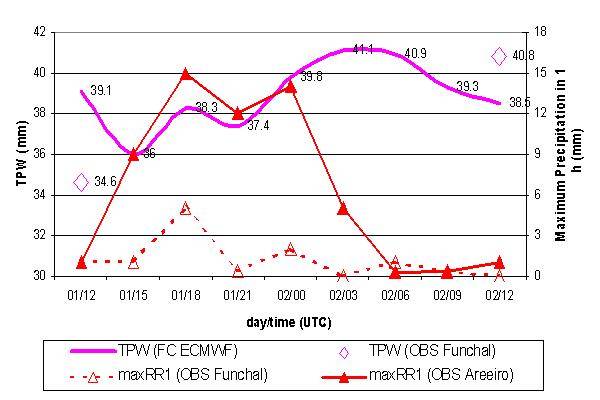
Figure 12: ECMWF TPW forecast between 01/10/2009 at 12 UTC and 02/10/2009 at 12 UTC (smoother pink line). Observed TPW on the sounding from Funchal (open pink diamonds). Maximum 1 hour precipitation in last 3 hours for Funchal (red triangles, straight line) and Areeiro (red squares, dashed line).
The sounding also showed that there was more energy available for convection in reality than model was forecasting (significantly higher observed CAPE values than ECMWF forecasts) and that in fact Convective INhibition (CIN) was observed to be zero, which ECMWF model was not depicting (Figure 13). These values suggest an unstable environment in the area, which is in line with the occurrence of some convection activity to the northwest of the island shown in Figure 7.
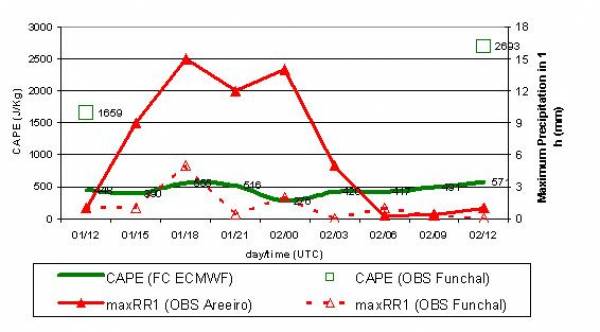
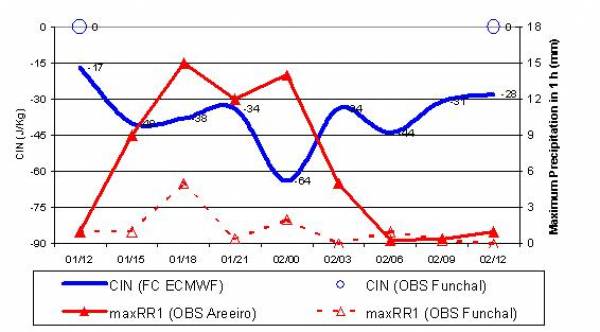
Figure 13: ECMWF forecast between 01/10/2009 at 12 UTC and 02/10/2009 at 12 UTC for CAPE (J/Kg, smooth green line in upper graphic) and CIN (J/Kg, smoothed blue line in lower graphic). Observed CAPE and CIN on the sounding from Funchal in open green square (upper graphic) and open blue circle (lower graphic), respectively. Maximum 1 hour precipitation in last 3 hours for Funchal (red triangles, straight line) and Areeiro (red squares, dashed line) in both upper and lower graphics.