Satellite precipitation estimates and convection detection
Orography is known to burst convection, which usually can be easily detected by satellite imagery. This episode was relatively "silent" in satellite images as, eg. no "alarming" patterns could be detected in the precipitation products from SAF Nowcasting over the island. On one hand, Convective Rainfall Rate (CRR) over the island was zero at all instants during the analyzed 24 hours (12 to 12 UTC). Alarming values could only be found in areas of clear convective activity over the ocean to the northwest of the island (Figure 7).
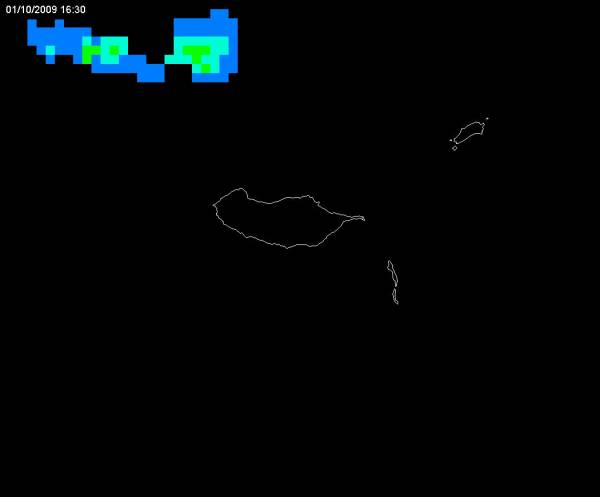
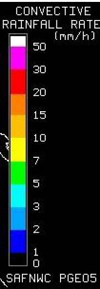
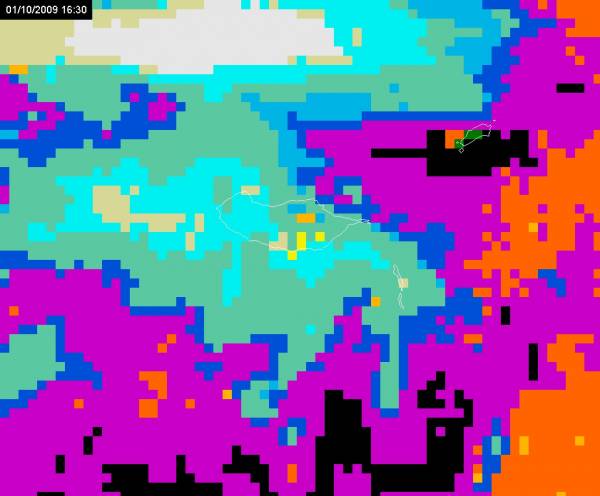

Figure 7: Convective Rainfall Rate in mm/h (top) and Cloud Type (bottom) from SAF Nowcasting on 01/10/2099 at 16:30UTC.
On the other hand, the probability of precipitation (from Precipitating Clouds product) over the island was zero around 80% of the time during the 24 hour period. In the instants when it was not, the values were below 35%, therefore not strongly supporting the occurrence of precipitation from remote observation product (Figure 8).
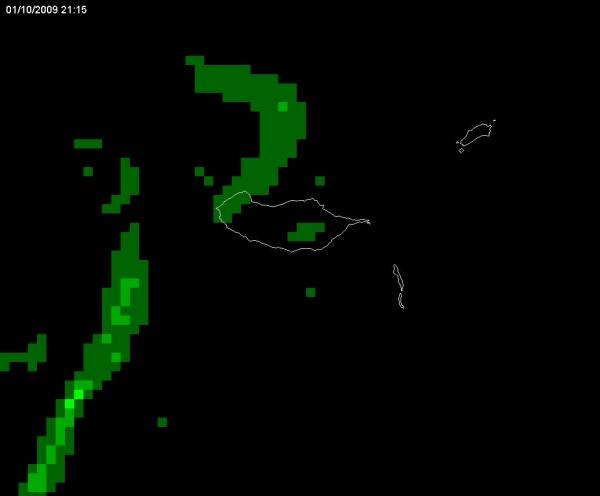
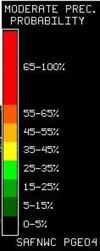
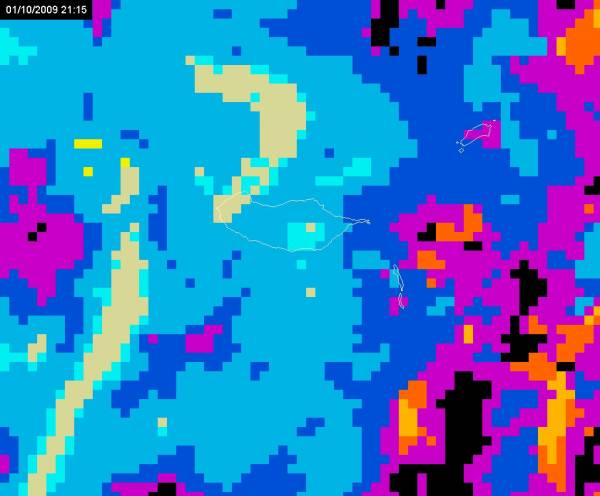
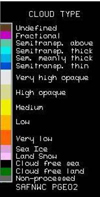
Figure 8: Probability of Precipitation in % (top) and Cloud Type (bottom) from SAF Nowcasting on 01/10/2099 at 21:15 UTC.
During daytime on 01/10/2009, only the High Resolution Visible (HRV) image depicts some convection over Madeira Island. At 16 UTC one can see a couple of small individual convective cells formed over the mountain (Figure 9). At this time, Areeiro station recorded 10 minute precipitation amounts of 1.3 mm (15:50-16:00UTC) and 3 mm (16:00-16:10UTC). A total of 15 mm were measured between 16 and 17 UTC, which was the highest hourly amount during the event. In the vicinity of the island no convection is present, again suggesting the importance of orographic forcing on the observed convection over the island.
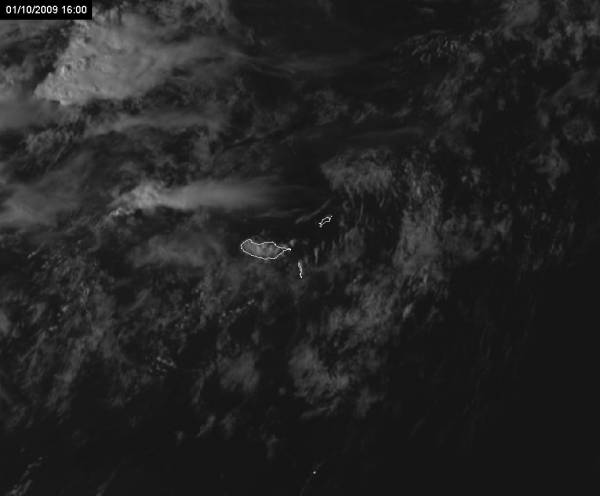
Figure 9: HRV from MSG on 01/10/2009 at 16:00 UTC.
During nighttime, no high resolution images (with sub-satellite 1 km resolution) are available for MSG. From the other 11 channels and combinations from MSG (with sub-satellite 4 km resolution), apart from a cloudy scenario no special convective environment could be spotted over Madeira (Figure 10). In fact, clear organized areas of convection stretch from west of Canary Islands to the northeast and curve anti-clockwise around the low-pressure system over the Azores Islands. In these bluish areas in Figure 10, the most active convective cells with overshooting tops are plotted in yellow and red colors and are clearly away from Madeira Island.
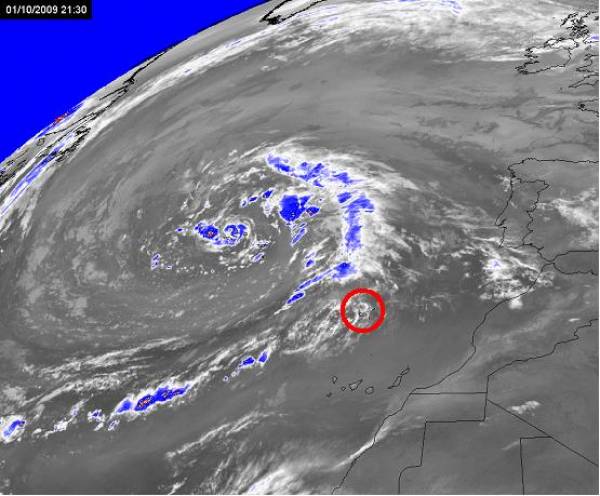
Figure 10: Difference between WV6.2 and IR10.8 channels for MSG on 01/10/2009 at 21:30 UTC. Overshooting tops corresponding to positive values are depicted by yellow and red pixels. Red circle around Madeira Island.