Local model (AROME)
AROME also models the situation acceptably (Figure 5) though over-estimates the fog area, especially in the South-West coast and over the Baltic Sea. The behaviour of the fog, especially the advection inland, is really well modelled in the region around Helsinki. The colourbar in Figure 5 presents the amount of vertically integrated cloud condensate (cloud water + cloud ice) [kg/m2]. Vertical (|) , horizontal (_) and tilted (/) lines show the amount of high, low and medium clouds in octas, respectively.
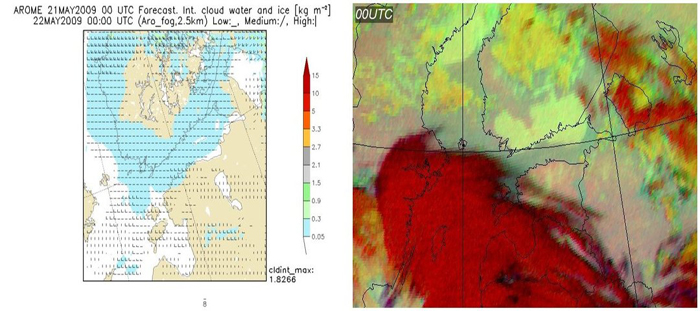
Fig. 5: AROME 00UTC forecast and fog-product from SEVIRI data from 12UTC to 00UTC.
The advection inland can be seen in Animation 2, where a cross section through Helsinki is presented. The over-estimation of the fog area on the ocean area is easy to notice also.
Animation 2: Cross section evolution from AROME 00UTC forecast +12h to +24h. Cross section line presented on the right hand side figure.
Lastly a meteogram presenting three different locations (Helsinki - ocean, Helsinki - near shore inland and Helsinki - inland ) illustrates again how well AROME performed in modelling the advection inland in the Helsinki region. Blue tones show the amount of cloud condensate (cloud water + cloud ice) in each model layer in units of kg/(m2). The green solid line surrounds the area with cloud water present, whereas the blue line surrounds the cloud ice. The gray solid line is the isotherm of the 0*C. Red arrows show the wind direction and speed on selected model levels. The speed is obtained by summing the barbs, counting a short barb as 2.5 m/s, a long barb as 5 m/s and a triangle as 25 m/s. Numbered dashed isolines indicate the air pressure.

Fig. 6: Meteograms of three positions from AROME 00UTC forecast. Top one "ocean near Helsinki", middle one "inland place close to shore in Helsinki" and bottom one "further inland".