Synoptic situation
In this case the flow was from South-West over the Baltic Sea and the average wind speed was adequently slow (~5m/s) so that the fog wasn't dispersed. The humidity of the incoming air mass (70-80% RH) was also favourable for the formation of the fog. In addition, wind direction itself had a crucial role, as it turned more coastward near the shore thus generating upwelling of cold water on the coastal water due to Ekman transport. The synoptic maps in Figure 2 show how the fog covered most of the coastal areas of Gulf of Finland and Gulf of Bothnia as well as moved inland during the evening.
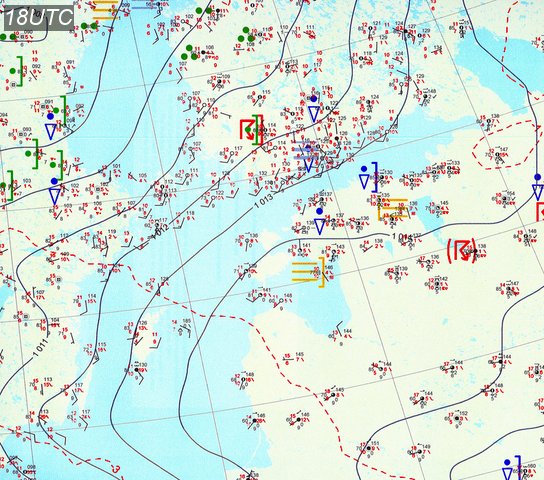
Fig. 2: Synoptic maps from 21st May 18UTC and 22nd 00UTC.
Figure 3 presents NOAA AVHRR images from the same day. Top one is 0.6μm,0.9μm,10.9μm-combination taken at 17:31UTC and lower one 3.7μm,10.9μm,12.0μm-combination at 23:24UTC. Like Figure 1 these RGB-combinations also show the fog very well.
Fig. 3: NOAA AVHHR images. Top one: 17:31UTC. Lower one: 23:24UTC.