Chapter VIII: Case Study: Floods in Central Europe 2021
Case Study: Floods in Central Europe 2021
In July 2021, a low-pressure system called Bernd caused heavy floods in Central Europe, mainly over Belgium, the Netherlands, Austria, and Germany. Bernd later developed into an upper-level low that was characterized by high amounts of precipitation while remaining quasi stationary for several days over Central Europe. As a consequence, rivers and streams broke their banks, overflowing streets and towns.
While being well predicted by numerical weather prediction models, the floods nevertheless caused severe damage and more than 200 casualties. Local precipitation rates were increased by thunderstorms and hail was recorded in France and Switzerland.
The impact of the continuous rainfall was very different from region to region. In some places, such as western Germany, rivers rapidly burst their banks and flooded nearby towns. In other regions, such as Switzerland and Austria, mountains and convection created localized precipitation spikes and flooding.
Early Phase: 10 - 12 July 2021
A low-pressure system formed over the Atlantic on 10 July and moved quickly over the British Isles and France by 12 July. Bernd's low-pressure core formed north of the polar front, which extended far south over Spain, forming a large upper-level trough (see Figure 1). At this stage Bernd already shows more characteristics of an upper-level low than a classical low-pressure system. A high-pressure zone at mean sea level is found below the core of the ULL. Related to this, a weaker surface low can be found northeast of the ULL.
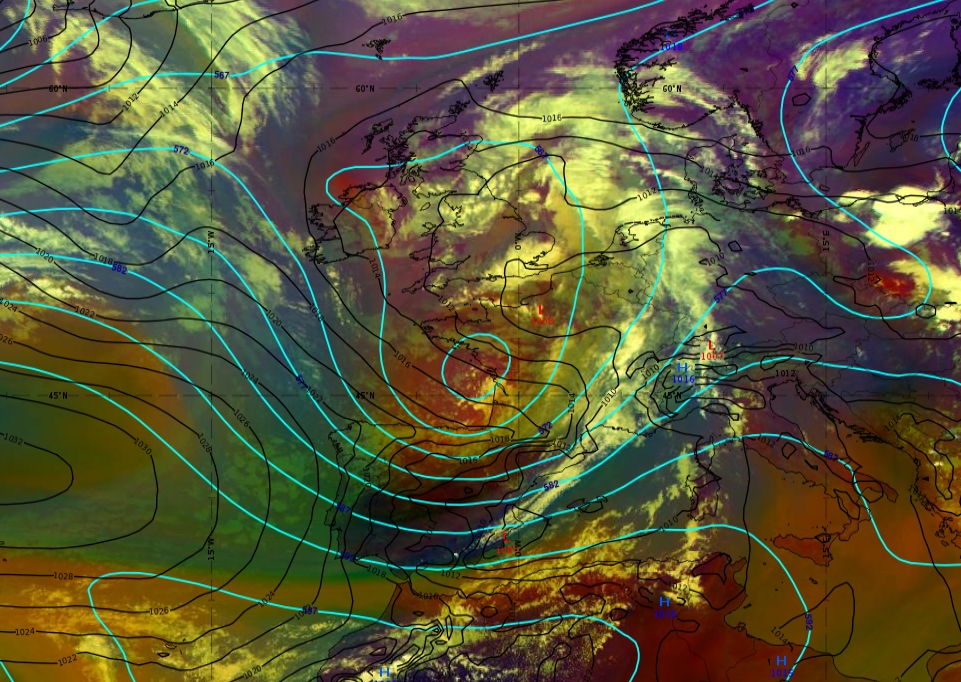
Figure 1: Airmass RGB from 12 July 2021 at 15:00 UTC. Cyan lines indicate the geopotential height at 500 hPa, black lines indicate the mean sea level pressure.
13 July 2021
Late on 13 July the core of the upper-level low slowly moved over the western Alps. Intense convective precipitation can be found in an arc pattern around the core of the ULL, spanning from the Adriatic Sea over Germany and France (see Figure 2a). Due to a weak surface low over northern Germany, warm and moist air masses are advected from the southeast and ingested into the ULL. Surface convergence fuels convection inside the area of the ULL's influence (see Figure 2b).
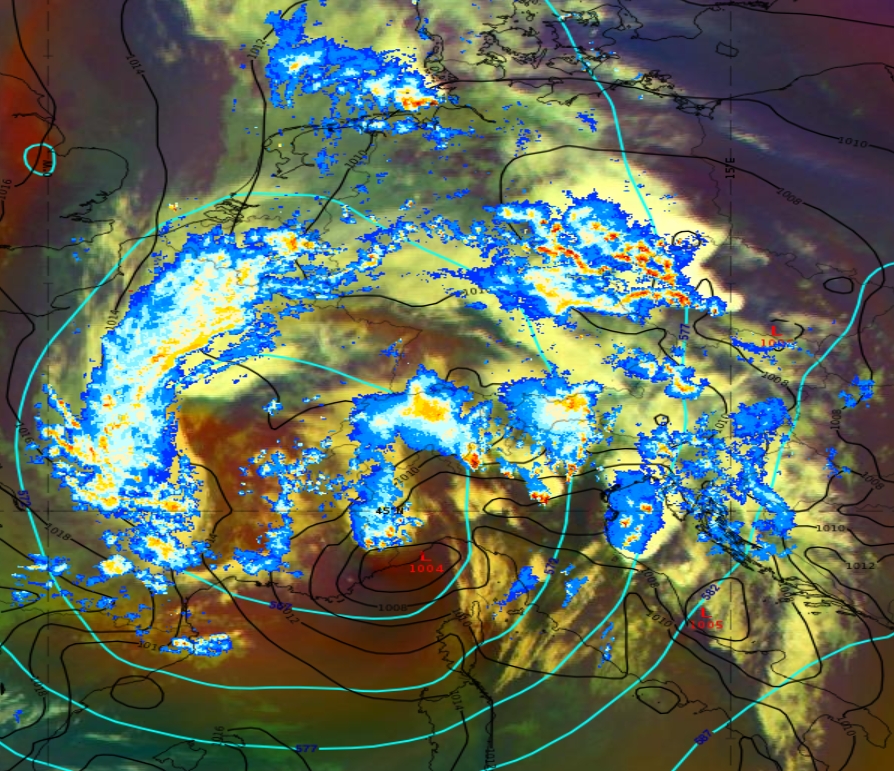
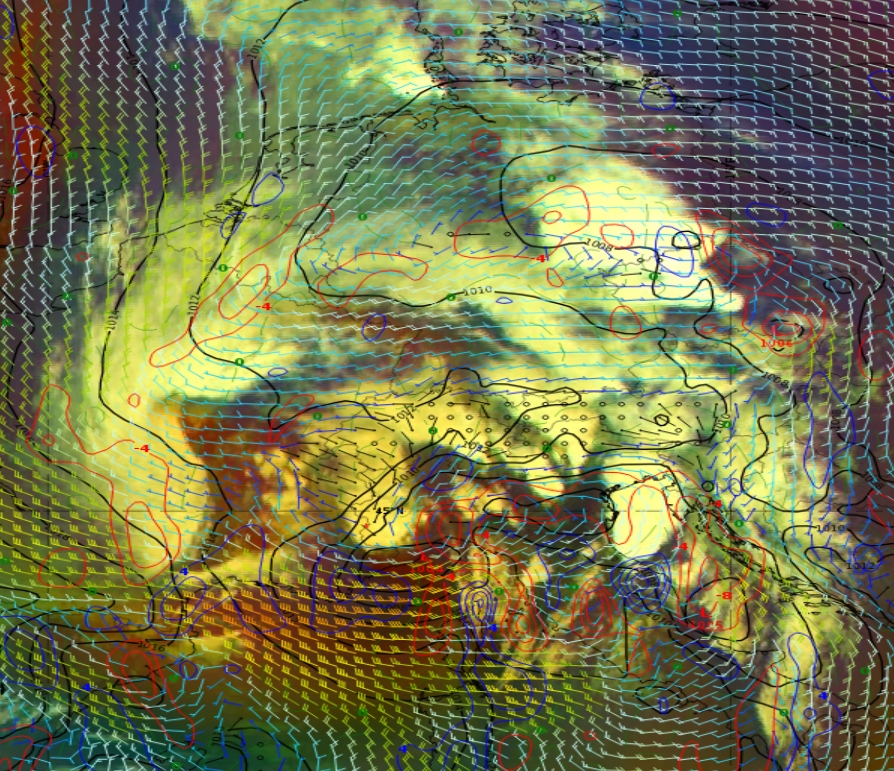
Figure 2: Airmass RGB from 13 July 2021 at 18:00 UTC;
a) Radar reflectivity with geopotential height at 500 hPa (cyan) and mean sea-level surface pressure (black).
b) Mean sea-level surface pressure (black), wind barbs and convergence (red) at 950 hPa.
The slow motion of the ULL, the advection of warm air from the south and the lifting effects over the Alps result in high accumulated precipitation (see Figure 3) over Belgium, Germany and Austria. Side troughs of the ULL increase the lifting effect locally.
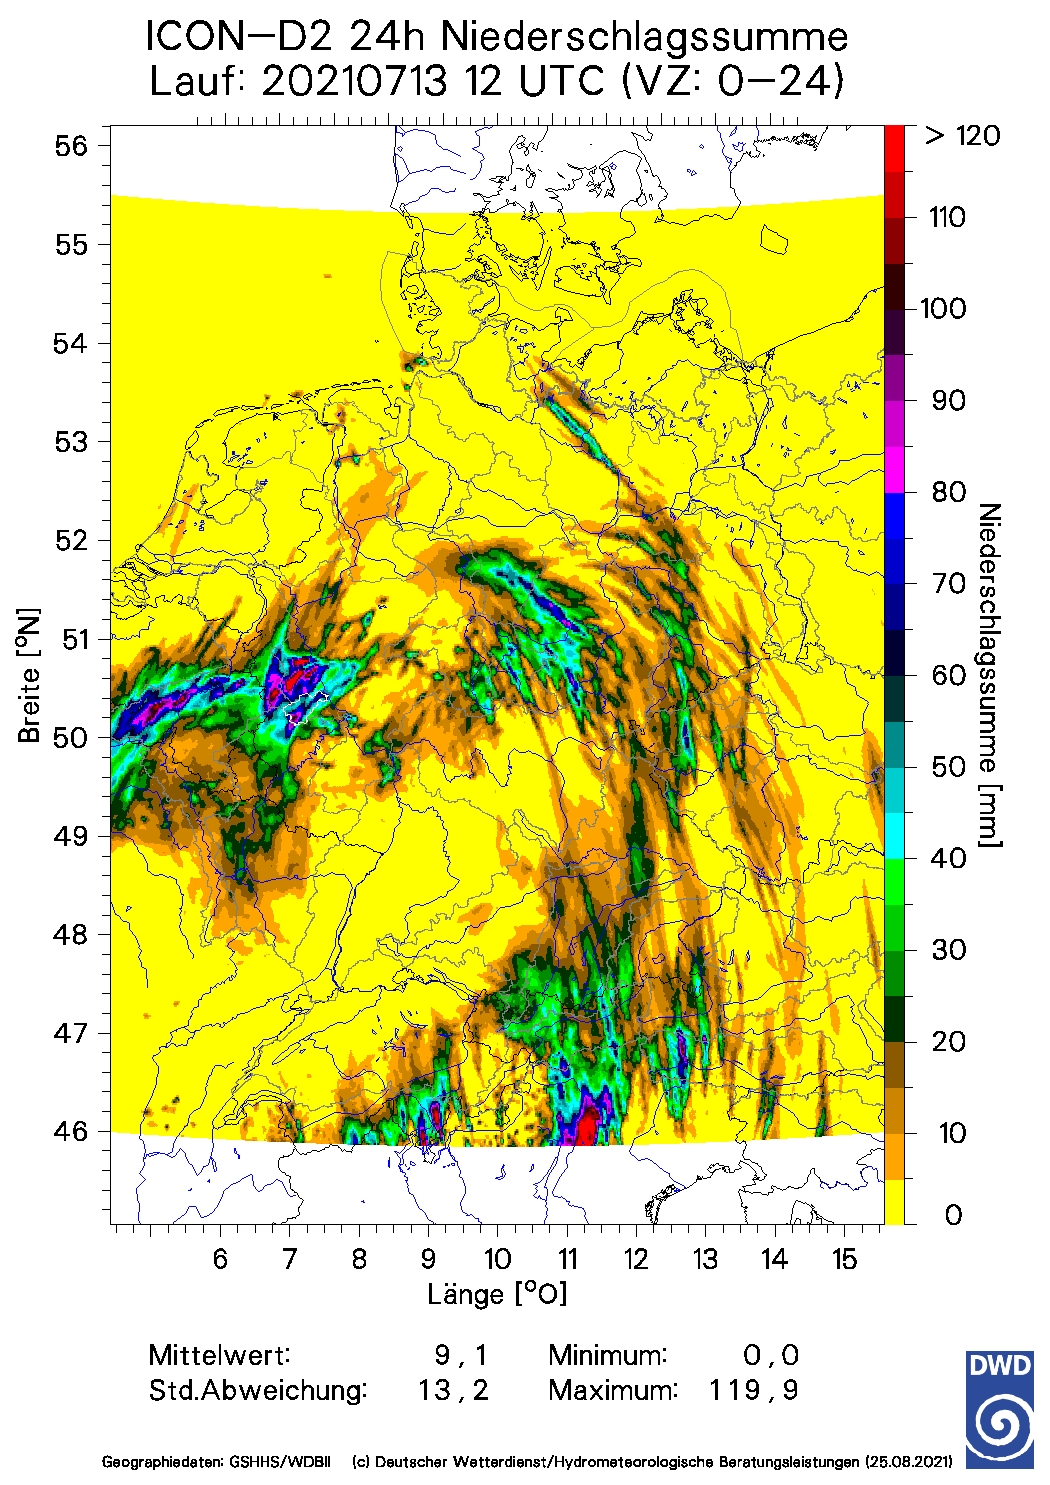
Figure 3: 24-hour accumulated precipitation over Germany based on ICON-D2 model run for 13 July 2021 at 12:00 UTC (copyright DWD)
14 July 2021
On 14 July the system becomes stationary over Central Europe. The surface low over northern Germany has deepened, while high pressure prevails below the ULL core. Warm air from the Mediterranean is brought north along the eastern side of the ULL. This is seen in the Airmass RGB as an occlusion-like cloud band (see Figure 4).
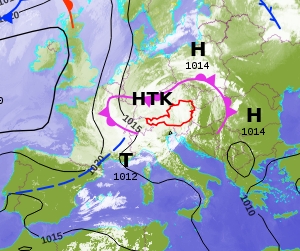
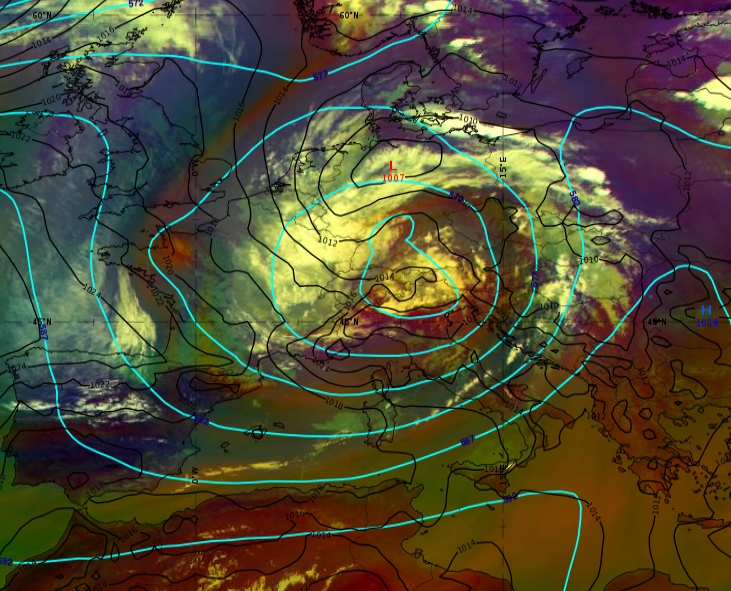
Figure 4: Left: Frontal analysis from 14 July 2021 at 12:00 UTC. H = High pressure system, T = Low pressure system (Tiefdrucksystem) and HTK = Upper-level low (Höhentiefkern).
Right: Airmass RGB from the same date. Cyan lines indicate the geopotential height at 500 hPa, black lines indicate the mean sea level pressure.
The OPERA radar composite image in Figure 5 shows the precipitation center over north-western Germany and the Benelux. The corresponding ECMWF forecast of total precipitable water amount for this area and point in time describes the situation quite well.
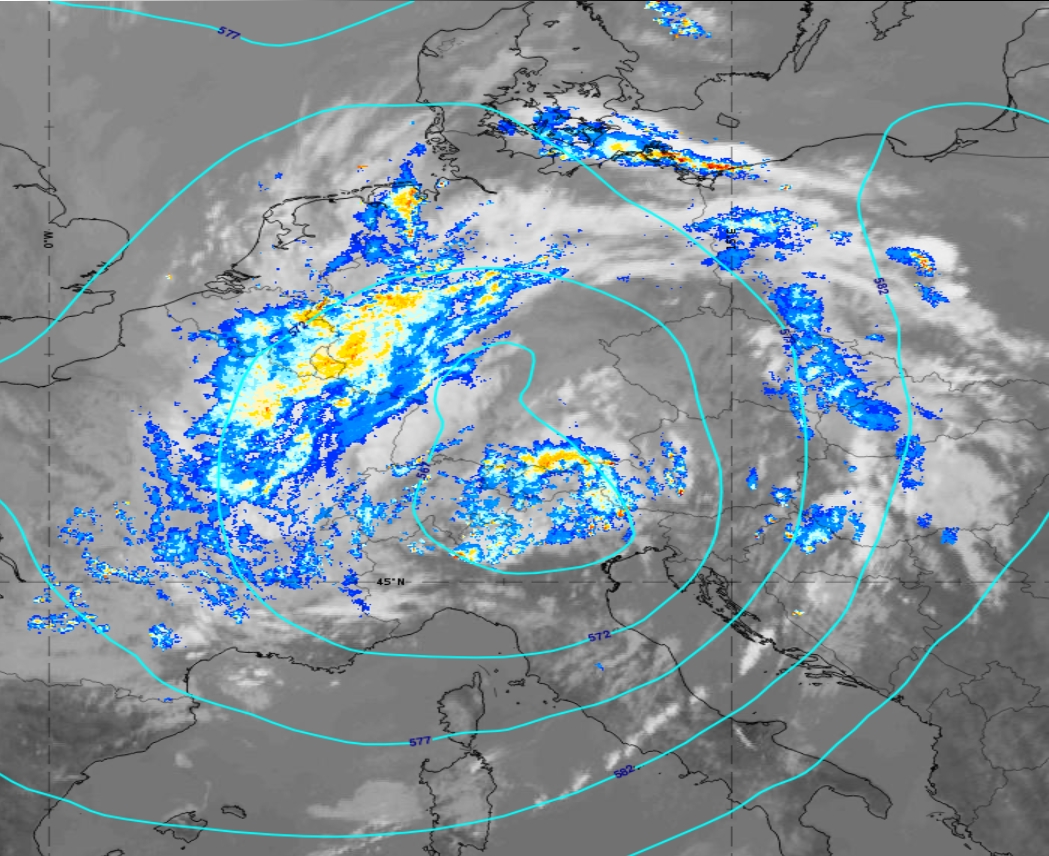
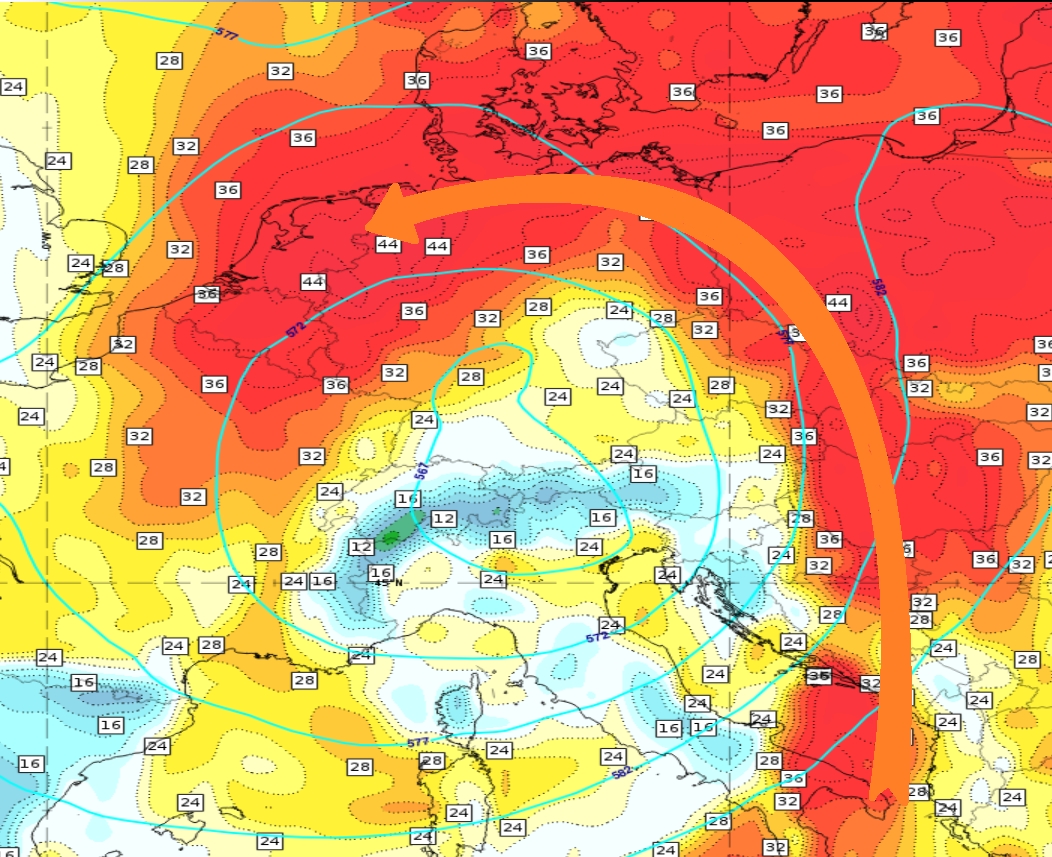
Figure 5: Left: Radar image from 14 July 2021 at 12:00 UTC.
Right: Total Precipitable Water parameter from ECMWF (12 hours forecast for 14 July 2021 at 12:00 UTC). The orange arrow symbolizes the warm conveyor belt.
A closer look inside the conveyor belt that wraps around the ULL (Figure 5, right side) by means of a vertical cross section (VCS) provides more information. The VCS starts in the center of the ULL and ends over the North Sea (Figure 6) so that it crosses the area of heavy precipitation. The equivalent potential temperature field at 850 hPa shows the tongue of warm and humid air masses advected from the southeast.
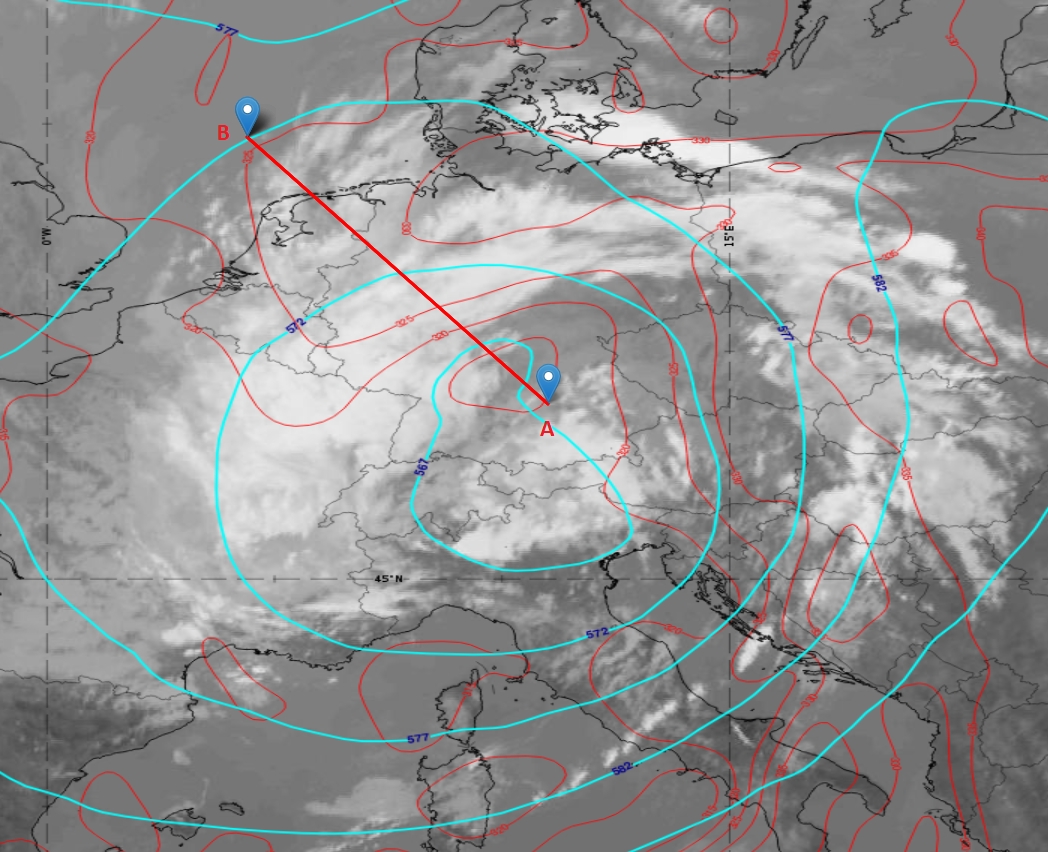
Figure 6: IR image from 14 July at 12:00 UTC. Equivalent potential temperature at 850 hPa (red) and geopotential height (cyan) at 500 hPa. The location of the VCS is indicated by the red line starting at A and ending at B.
The most striking feature the ECMWF model shows in the VCS (A -> B) is a pronounced vertical motion within the warm conveyor belt (see Figure 7). Lifted moist air is the main reason for intense precipitation over the Benelux and northwestern Germany. The VCS below shows that humidity is concentrated in the layers below 500 hPa.
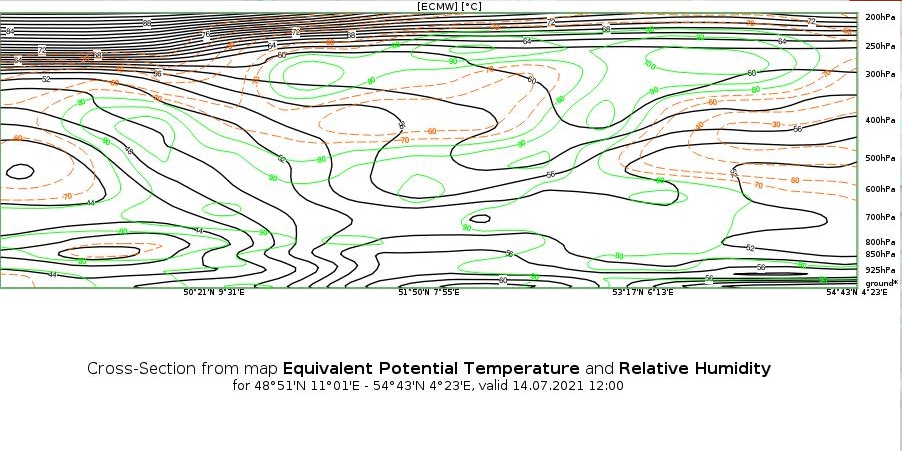
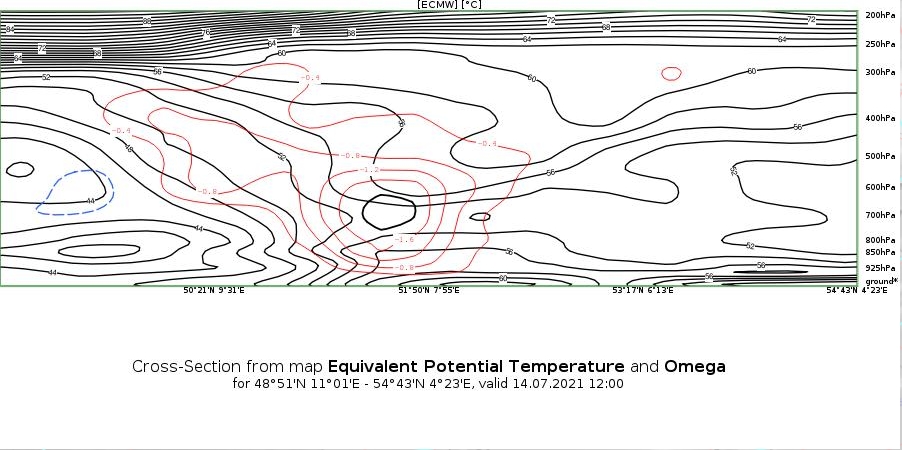
Figure 7: Vertical cross section as shown in Figure 6 for the ECMWF parameters Relative Humidity (green), Omega (red) and the Equivalent Potential Temperature (black).
Surface convergence and upper-level divergence can be seen in the next VCS (Figure 8). Both features result from the nearby low-level pressure minimum that boosts convection and precipitation (Figure 4, right side).
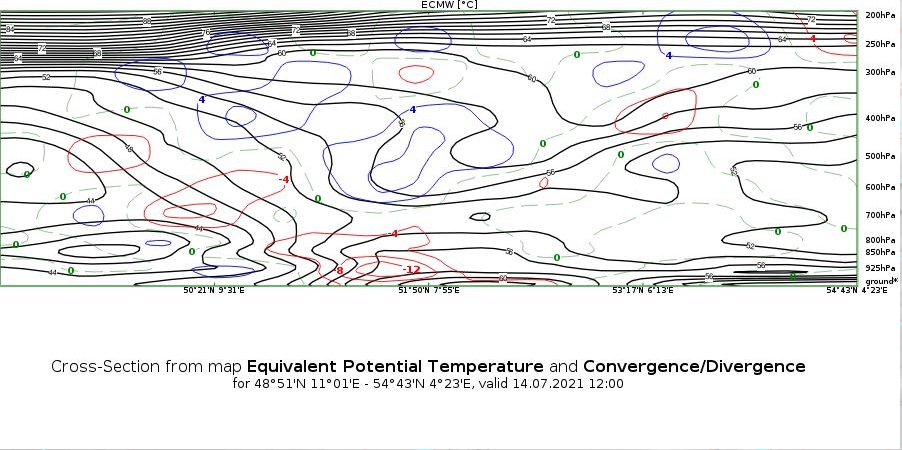
Figure 8: Vertical cross section as shown in Figure 6 for the ECMWF parameters Convergence (red), Divergence (blue) and the Equivalent Potential Temperature (black).
Final Phase: 15 - 18 July 2021
On 15 and 16 July 2021, the ULL Bernd moves slowly south and crosses the Alps (see Figure 9). During this period the precipitation that took place in the Alpine region was mainly caused by the barrage effect: peaks in precipitation were caused by convection.
Figure 9: Airmass RGB loop from 15 July at 12:00 UTC to 16 July 2021 at 18:00 UTC. Radar reflectivity and geopotential height (cyan) at 500 hPa.
On the morning of 17 July 2021, the center of the ULL was located over the Adriatic Sea. Warm and moist air is conducted around the eastern Alps and then lifted again at the alpine main ridge when arriving from the northeast. Embedded thunderstorms north of the alpine ridge increased precipitation locally, while the barrage effect causes continuous rainfall.
The Bernd system finally moves further south on 18 July so that Central Europe is not under its influence anymore. A weak cold front arriving from the northwest (see Figure 10) activates convection over the alpine region once again.
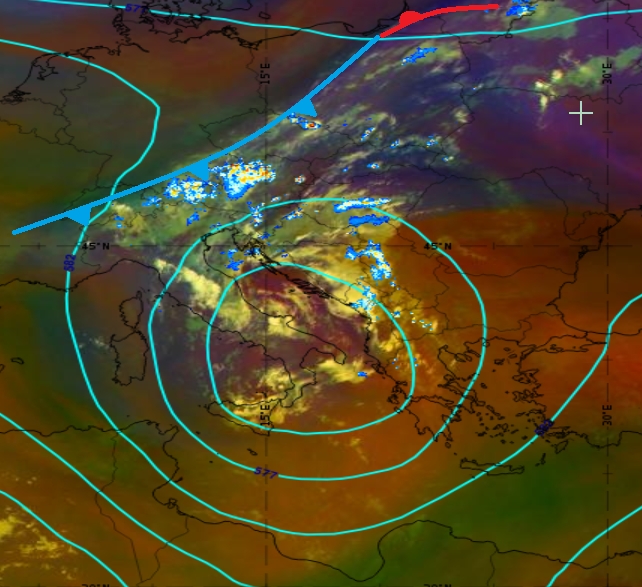
Figure 10: Airmass RGB from 18 July 2021 at 06:00 UTC. Radar reflectivity and geopotential height (cyan) at 500 hPa.
The Impact of Upper-Level Low Bernd on Germany and Austria
Germany
In the period from 12 to 19 July 2021, the cyclone Bernd caused high rates of rainfall over many parts of Europe and especially over Germany. Precipitation rates exceeded 150 mm/24 hours in some areas. The incidence of such events ranges from once every 100 to 1000 years. These high precipitation rates caused floods particularly in the western parts of Germany. More than 180 people were killed by the floods.
Water caused severe damage to railroad infrastructure and power plants had to be switched off, thus leaving many people without electricity and telecommunications for days. A huge ecological problem was caused by petrol leakages from heating installations and cars drowned in the floods.
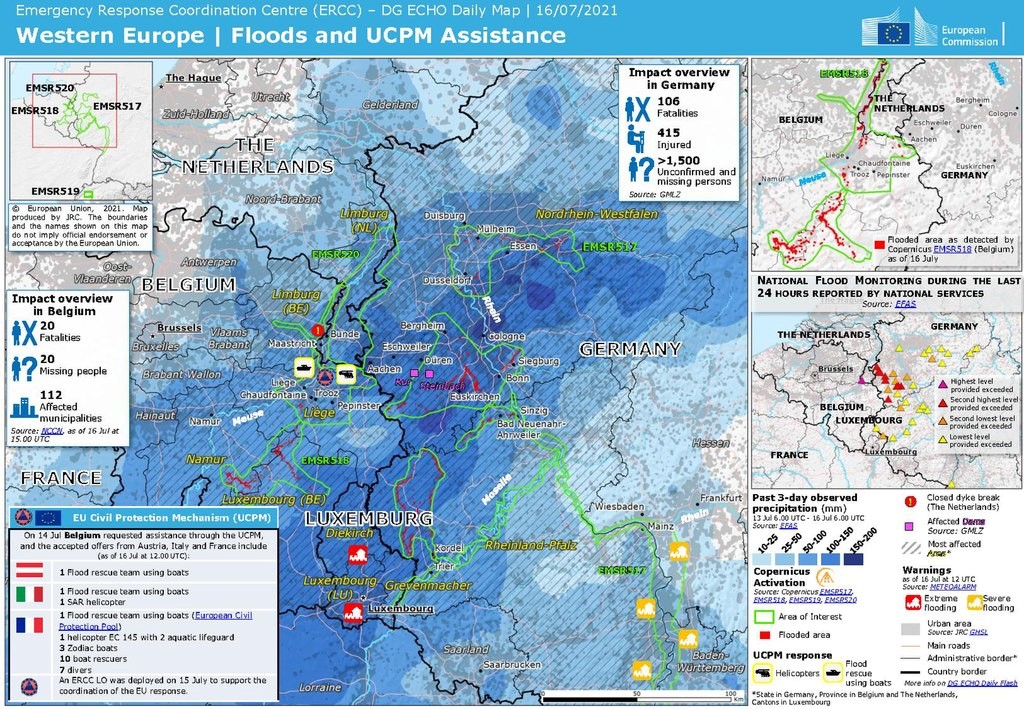
Figure 1: Western Europe | Floods and Union Civil Protection Mechanism (UCPM) Assistance chart (JRC, European Commission).
Timeline:
On 13 July 2021 rain showers were present over western Germany throughout the day and embedded thunderstorms appeared in the late evening. The air mass in this area was very humid containing around 40 mm of total precipitable water equivalent. These weather conditions caused intense local precipitation and high short term rain rates.
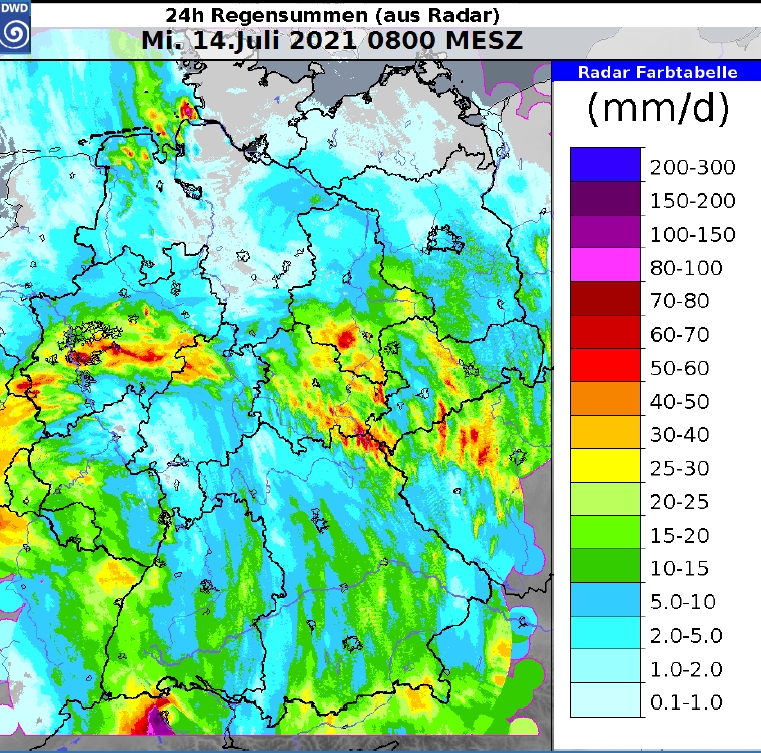
Figure 2: 24-hour accumulated precipitation over Germany based on radar measurements from 13 to14 July 2021 at 06:00 UTC (copyright DWD)
The ULL Bernd had a side-trough whose presence strengthened the lifting process of moist air over western Germany on 14 July. This dynamic process led to even higher precipitation rates than the day before (see Figure 3).
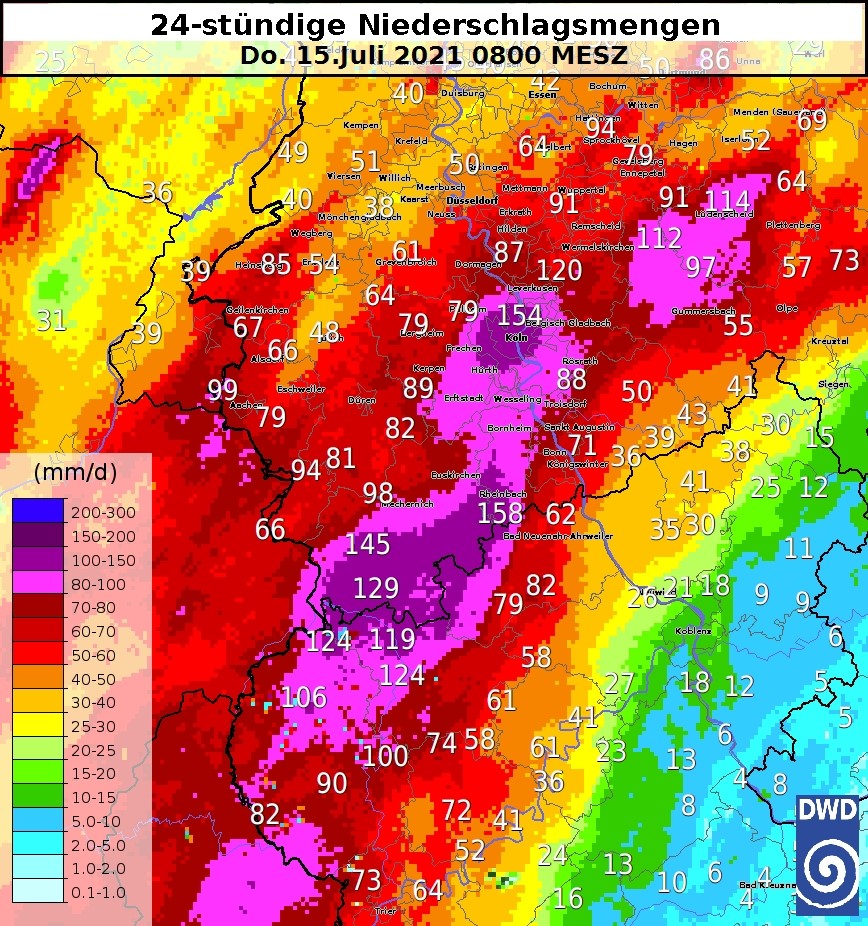
Figure 3: 24-hour accumulated precipitation measurements over western Germany from 14 to 15 July 2021 at 06:00 UTC (copyright DWD).
As a consequence of the high rain rates, the water levels of rivers increased dramatically and reached points recorded only every 50 years. Figure 4 presents an example for the river Lieser at the town of Daun in Rhineland-Palatinate. Most losses of life resulted from rivers overflowing and flooding inhabited areas, sweeping away cars, streets and houses.
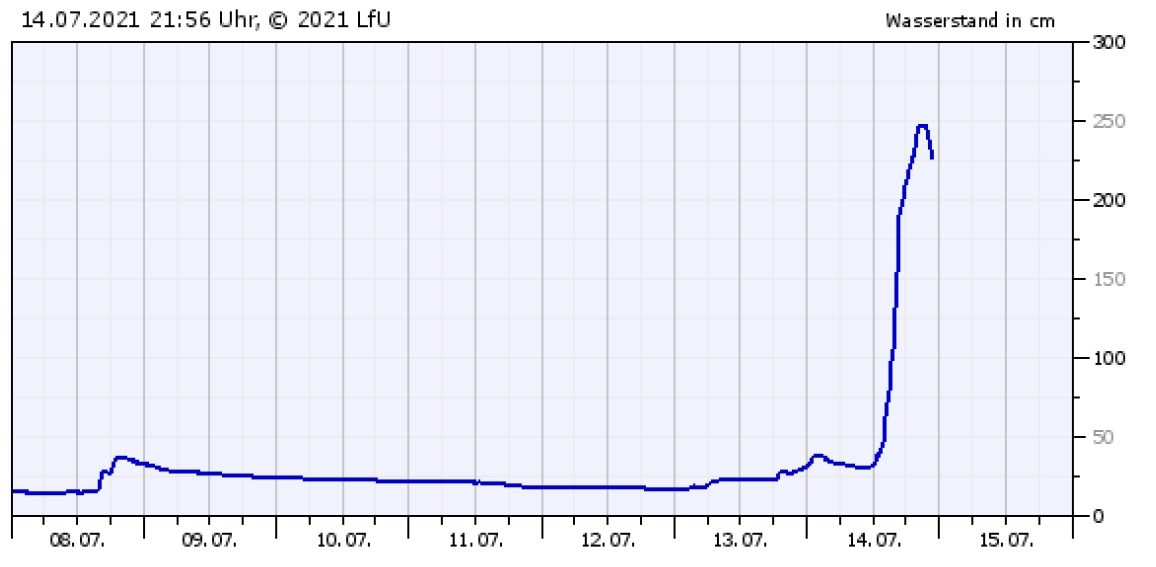
Figure 4: A rise in water level from 25 cm to 2.5 meters within a few hours was recorded for the river Lieser at the town of Daun in western Germany.
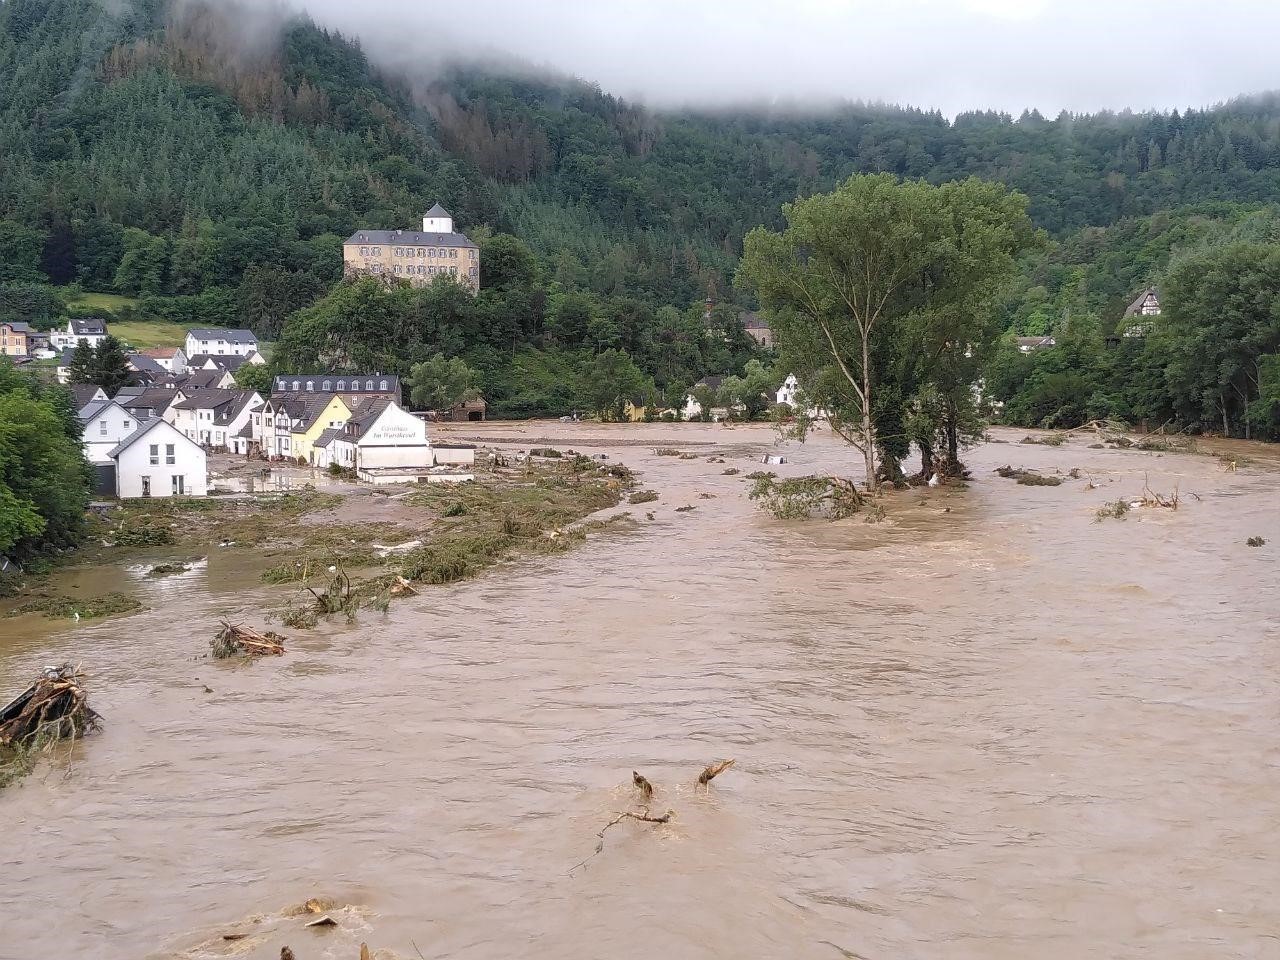
Figure 5: Flood in the town of Kreuzberg in Altenahr on 15 July 2021 (Martin Seifert).
Austria
Austria was less affected by the cyclone Bernd than Germany or the Benelux as far as loss of life and damage to property are concerned, although the 24-hour precipitation rates were only a little below those recorded in Germany. After being stationary for a few days, Bernd moved to a position south of the Alps quickly, within two days. There were no fatalities, but the economic losses were considerable. Houses and railway lines were flooded, villages had to be evacuated, a bridge was swept away and mudflows had to be cleared.

Figure 1: The flooded town of Hallein near Salzburg on 17 July 2021.
The highest precipitation rates in Austria were recorded between 17 July in the morning and late 18 July. Precipitation fell mainly along the north side of the Alps from Tyrol to Lower Austria. Continuous rain was recorded in most places, while locally the amount of precipitation varied greatly due to the presence of thunderstorms. 16 838 convective cells were detected by the Austrian radar network on 17 July and another 11 365 the next day.
In regions not affected by orographic rain caused by the barrage clouds north of the Alps, thunderstorms were the cause behind most of the measured precipitation, especially in the flatter parts of eastern Austria. The top 18 precipitation records exceeding 100 mm/48 hours were all located north of the Alps (see Table 1).
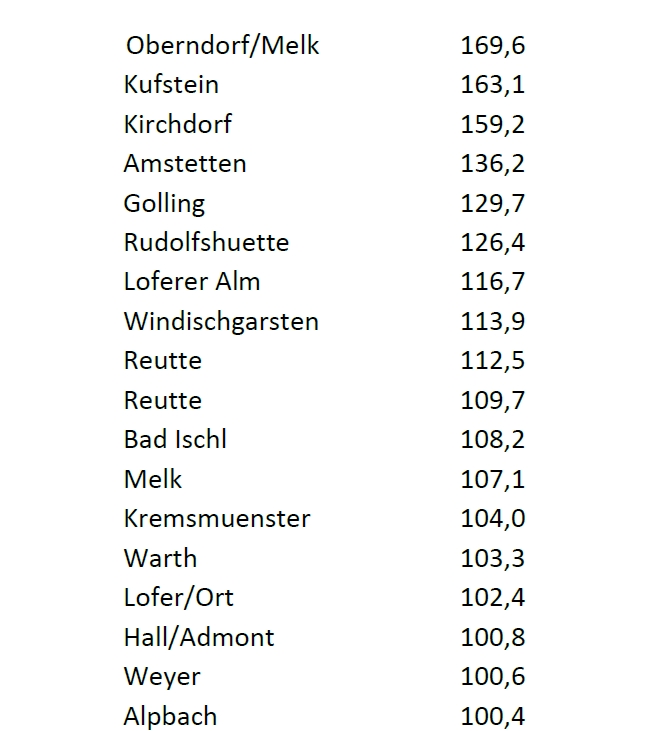
Table 1: 48-hour accumulated precipitation amounts recorded from 17 July at 00 UTC to 19 July 2021 at 00 UTC by the ZAMG-Tawes network.
These precipitation figures also stand out in terms of how often they occur. For example, Kufstein in Tyrol only experiences precipitation this heavy once in 200 years. Most of the precipitation fell between 17 July 00 UTC and 19 July 00 UTC. The graph below shows two distinct rain rate maxima that were caused by convective cells passing over Kufstein (see Figure 2).
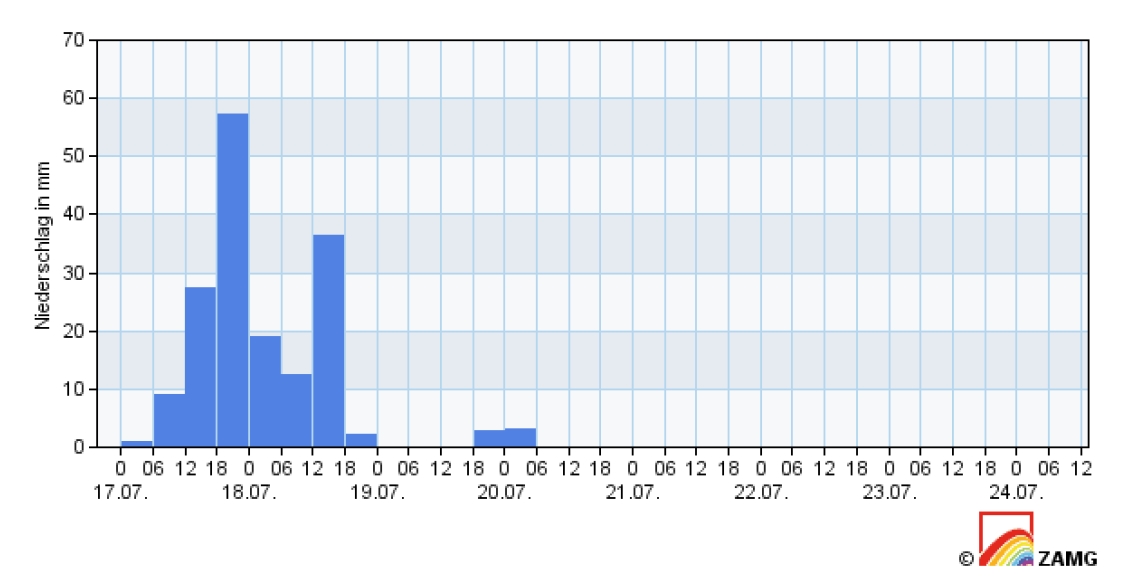
Figure 2: 6-hourly precipitation rates recorded at Kufstein (Tyrol) between 17 July at 00 UTC to 19 July 2021 at 00 UTC by the ZAMG-Tawes network.
The 24-hour accumulated precipitation charts for Austria on 18 and 19 July show the hot spots of precipitation evenly distributed along the alpine ridge (see Figure 3). Two of them, Kufstein and Hallein, are marked on the first chart.
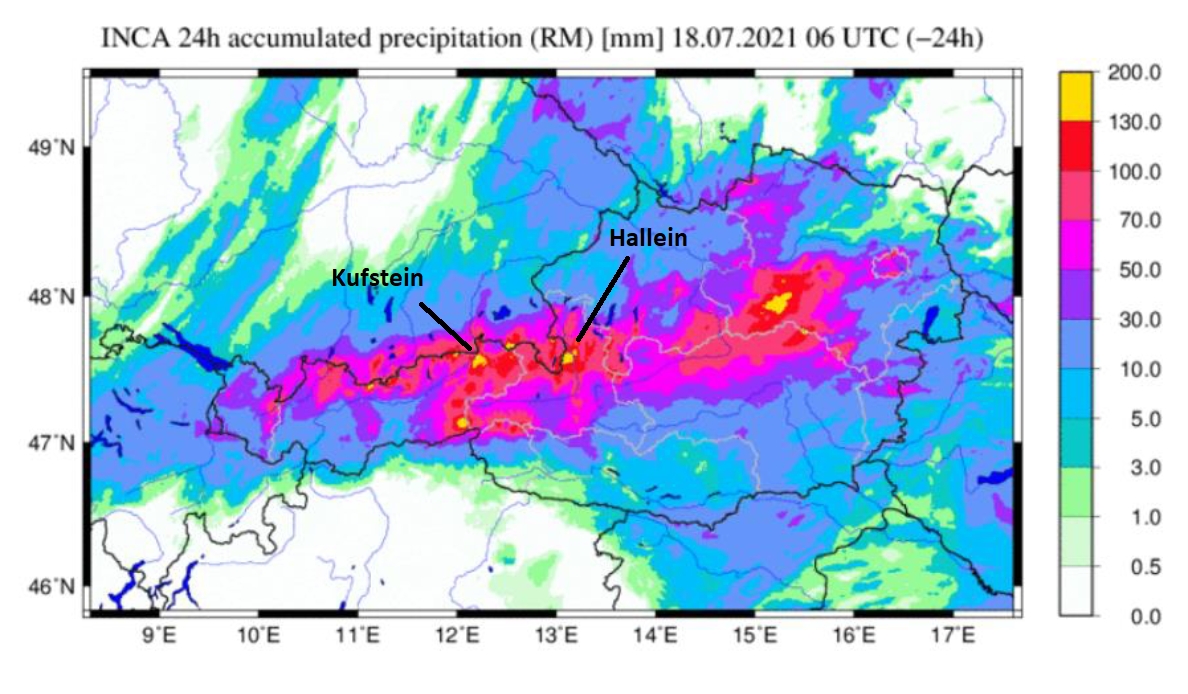
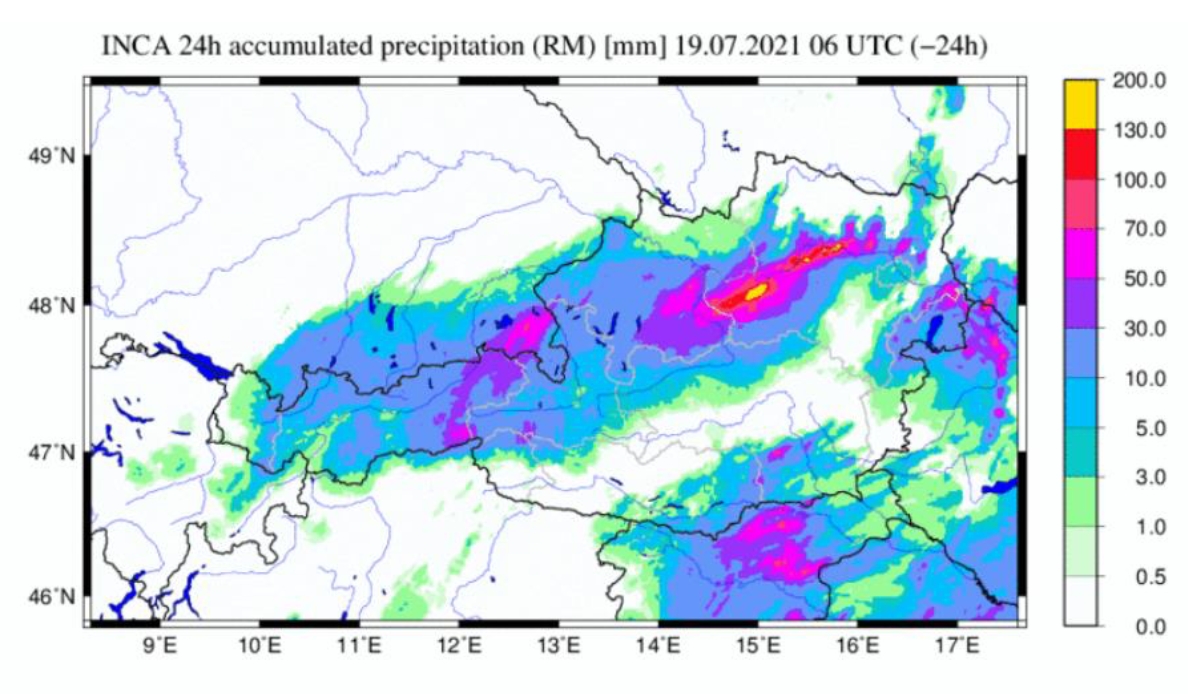
Figure 3: Accumulated 24-hour precipitation charts derived from the INCA nowcasting model on 18 and 19 July 2021 at 06:00 UTC.
The town of Hallein, located south of Salzburg, was heavily flooded due to a log jam in the Kothbach river that crosses the town. Streets and alleys were flooded and many buildings damaged. People had to be rescued by fire brigades, but luckily there were no fatalities. Follow the link below to see a short video of the flooding:
https://www.youtube.com/watch?v=Wst9rXUHFfE
The local weather station recorded a precipitation rate of 80 mm in 12 hours from 17 July at 12 UTC to 18 July at 00 UTC (Figure 4). Approximately 20 mm of this amount was due to local convection.
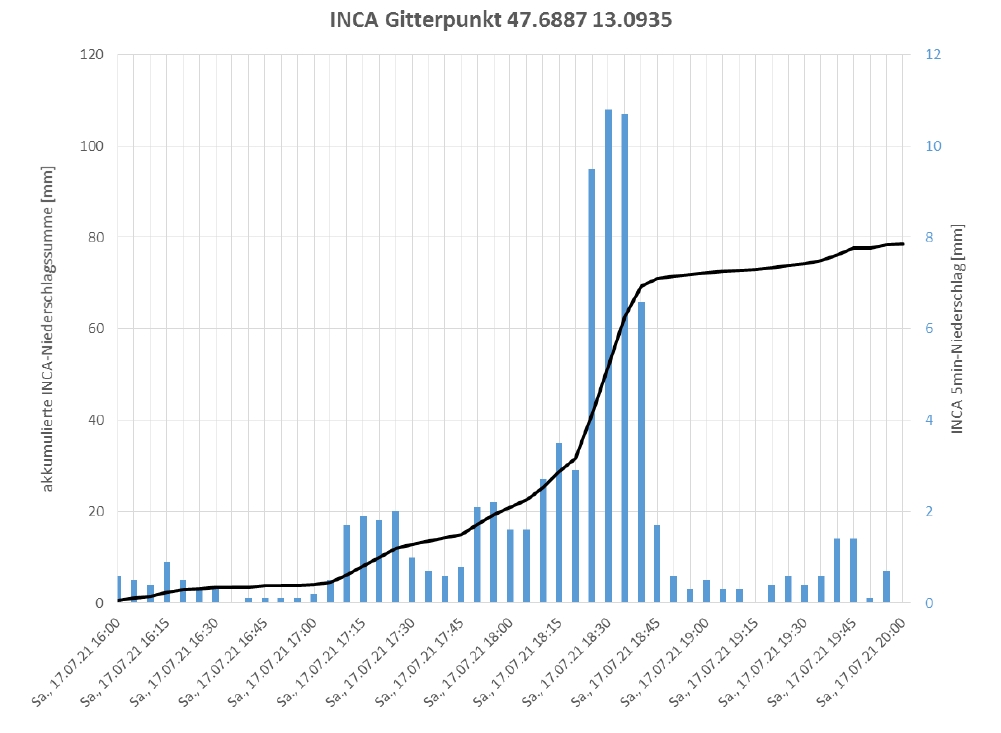
Figure 4: Cumulative precipitation chart (black line) for the grid point of Hallein. Blue bars show the precipitation amount for every 5 minutes as given by the INCA nowcasting model.