Synoptic Situation and satellite overview
The synoptic situation remained practically unchanged during the whole fog episode. Synoptic scale fronts remained mostly well outside the British isles, only occasionally passing over Scotland. Even when the fog finally lifted (0n 23 December), the large-scale synoptic situation didn't change much but remained the same even up till Christmas Eve.
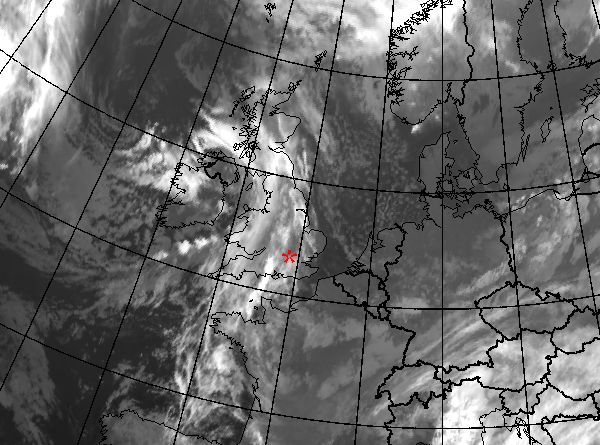
18 December 2006/00 UTC Meteosat 8 IR10.8 image. Location of London shown with a red asterisk.
|
|
The IR10.8 image loop shows the 6-hourly-development from 18th to 24th December 2006. In the classical IR 10.8 image the frontal clouds can be seen passing UK from west and north towards east and southeast, along the edges of the high pressure. Within the high pressure itself the IR images show little details. Some rather extensive stratocumulus sheets can be seen, but the low stratus decks remain mostly invisible in traditional satellite IR channels.
On December, 21 the clear land areas warm up a little during daytime, thus producing better contrast with land and stratus cloud tops. At night-time the distinction between stratus and cloud-free areas remain virtually impossible, as often is the case.
The following chapters enable you to look at the stages of the development as seen in satellite images and basic meteorological fields. We only concentrate on the period 19-23 December from now on.
Satellite overview
For monitoring of night-time or wintertime fog the RGB combination "Night Microphysical" is by far the best tool to use. During daytime at middle-latitudes there is enough daylight to use RGB combinations exploiting the visible channels. Two RGB combination loops are shown: they are otherwise identical, but for the daytime image (12 UTC) the first loop will have HRV input, the second loop will have traditional Visible channels and 1.6 µm channel.
Recently a better RGB combination for monitoring low clouds both day- and nighttime has been introduced. Main difference between this "Advanced Night Microphysical" RGB abd the traditional "Night Microphysical" RGB is that 8.7 micrometer information is used instead of 3.9 micrometer channel. A loop of this RGB is also shown (images not reprojected).
Meteosat 8 (IR12.0 µm- IR10.8 µm) + (IR10.8 µm- IR3.9 µm) + IR10.8 µm "Night microphysical" (for 00,06 and 18 UTC) and HRV + HRV + IR10.8 µm (for 12 UTC) images
Meteosat 8 (IR12.0 µm- IR10.8 µm) + (IR10.8 µm- IR3.9 µm) + IR10.8 µm "Night microphysical" (for 00,06 and 18 UTC) and 1.6 µm + 0.8 µm + 0.6 µm (for 12 UTC) RGB images
Meteosat 8 (IR12.0 µm- IR10.8 µm) + (IR10.8 µm- IR8.7 µm) + IR10.8 µm "Advanced Night Microphysical" RGB images
Basic synoptic parameters
Basic synoptic parameters are shown in 12 hour intervals, at 00 and 12 UTC.The stationary synoptic pattern can be seen in the basic synoptic fields of the height of 500 hPa and Mean Sea Level Pressure fields.
Geopotential Height and Equivalent Potential Temperature at 500 hPa
Summary The satellite image RGB combinations as well as basic meteorological fields show a very typical synoptic background for a winter-time environment favouring radiation fog formation. Over the land areas winds remain calm, air is basically dry at the mid-troposphere allowing strong radiative cooling of the boundary layer, and general subsidence basically resulting in negligible mid-level and upper cloudiness.
The next chapter deals in more detail the meteorological parameters to help analysing the event.