MPEF Divergence Product
The MPEF Upper troposphere Divergence product (in the following: DIV) is operational through EUMETCast since 2008. The starting point for this product is the MSG 6.2μm WV-channel. The Atmospheric Motion Vectors (AMV) are deduced by tracking cloud and humidity features. As the 6.2 WV channel sees a layer between 100 and 400 hPa, the AMV are situated at this height. The DIV product shows areas where those AMV are divergent, as this is a sign of vertical motions. These vertical motions can either be triggered by ascent due to convective development in areas without upper-level forcing, or by upper-level forcing near the jet axis.
In the following we take a look at the case of the 12th and 13th of September, and whether this product would have been helpful in forecasting the convection, thus eliminating the model error.
On September 12th at midday the PV anomaly was situated over France (Fig 3.1). As already mentioned, the ECMWF model shifted this distinct anomaly approximately 100 to 200 km westward. But regarding the WV-image, one can detect the PV maximum very clearly. in Potential instability is highest and therefore convection is most likely to occurthe moisture boundaries, the most distinct gradient from humid to dry in the WV-image.
Figure 3.1: Meteosat 9 WV6.2 - 12 September 2010 1245 UTC
In Fig 3.2 one can see the DIV product at that time. Upper-level divergent areas are indicated by greenish or blue colours, whereas convergent areas appear in red colours. The green colour is a sign of little divergence (0 to 20 s-1), pale blue for divergent values from 20 up to 40 s-1. The bluer an area is, the stronger the divergence.
The area of the moisture boundary southwest of Belgium approximately corresponds with the divergent zones in the DIV product.
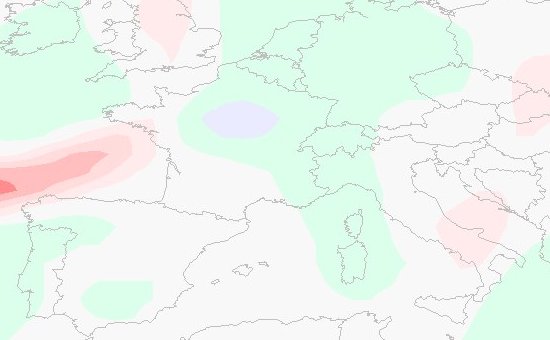
Figure 3.2: Meteosat 9 MPEF DIV product - 12 September 2010 1245 UTC
A look at the Meteosat 9 HRV RGB at 1200UTC (Fig 3.3) indicates and confirms some small cells along the leading edge of the frontal band.
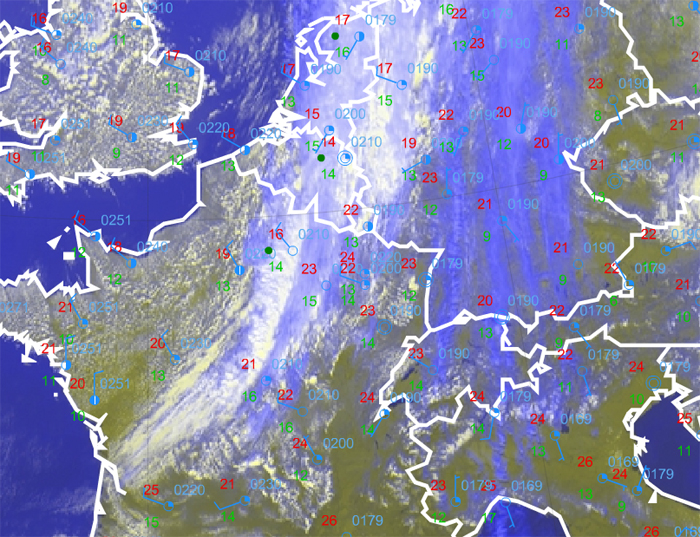
Figure 3.3: Meteosat 9 HRV RGB - 12 September 2010 1200 UTC
In this case the WV satellite image and the DIV product were a good combination for forecasting the convection and could have helped the forecaster when the model failed.
As mentioned in the Synoptic Analysis, in the following a distinct PV maximum occurs over Switzerland. We therefore compare a loop of WV-images (Fig 3.4) with the DIV-product (Fig 3.5).
Figure 3.4: Time animation Meteosat 9 WV6.2 - 12 September 2009 1445 to 1845UTC
Figure 3.5: Time animation Meteosat 9 MPEF DIV Product - 12 September 2009 1445 to 1845UTC
At 1445 UTC the first convective activities, which can be seen as distinct white spots in Fig 3.4, appeared in the western part of Switzerland. The DIV product shows a zone of little divergence in this area. Greater values of divergence are obtained farther west in the eastern parts of France, where convective cells already exist. The maximum values of divergence do not occur until 1745 UTC in Switzerland, at which time convection has already started there.
On the night of the 13th some significant areas of upper-level divergence appear in the DIV product especially over Northern Italy and Austria (Fig 3.6). This seems very plausible, because a sharp trough is situated over this region and some convective cells have developed (see Fig 2.2 and 2.3).
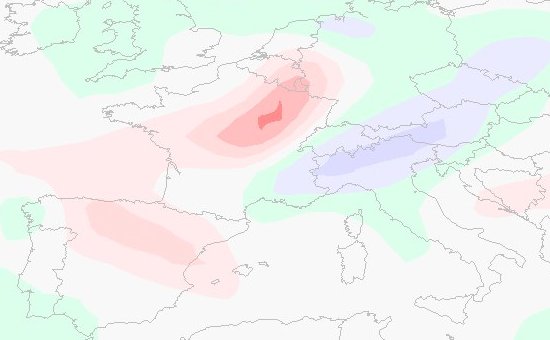
Figure 3.6: Meteosat 9 MPEF DIV product - 13 September 2010 0345 UTC
Until now we have only discussed cases where the DIV product performed well to very well as an indicator of upper-level forcing for vertical motion. But there is no one-to-one correspondence between the upper-level divergent flow and convective development. Deep moist convection occurs where favourable conditions at low and upper levels coincide. In Fig 3.7 the DIV product shows an area of distinct divergence over the southern part of France. But if we look at this region in the IR-Image (Fig 3.8) nearly an hour later, we see that no significant convective development has arisen.
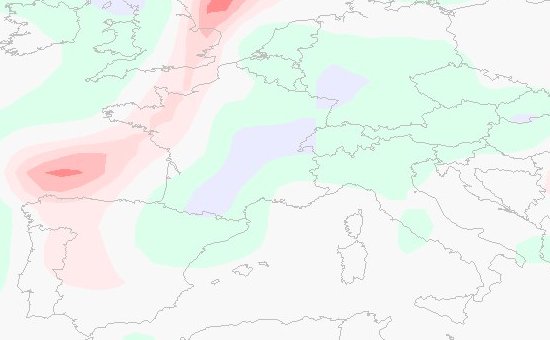
Figure 3.7: Meteosat 9 MPEF DIV product - 12 September 2010 2045 UTC
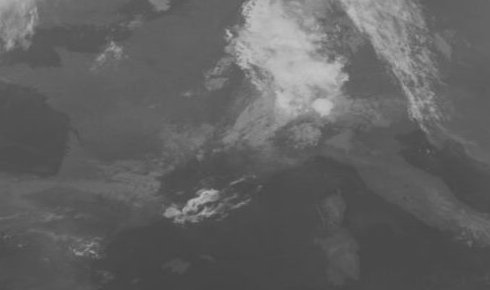
Figure 3.8: Meteosat 9 IR10.8 - 12 September 2010 2130 UTC