Synoptic Situation
The development of an instant occlusion can be divided into the following stages:- Pre-Merging Stage
- Merging Stage
- Mature Stage
The animation below shows the entire development process seen in IR imagery:
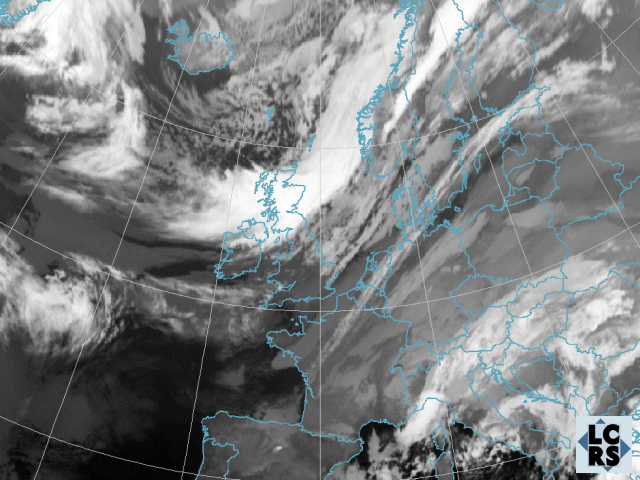
24 Nov 2005, 00 UTC - Meteosat-8 IR10.8
|
|
Satellite Overview
Meteosat-8 IR10.8 time sequence
The first chapter dealing with the synoptic situation describes the developments seen over Central Europe with infrared 10.8μm channel. 3-hourly sequences are shown.
Meteosat-8 WV6.2 time sequence
This chapter describes the development seen in the water vapour 6.2μm channel. 3-hourly sequences are shown.
Colour Enhancement
Meteosat-8 Enhanced IR10.8 time sequence
In this chapter an animation of the IR10.8 channel is presented with enhanced colours. This enhancement enables us to study the vertical structure of the clouds in more detail. 3-hourly sequences are shown.
RGB Composites
Airmass RGB: Meteosat-8; 6.2-7.3, 9.7-10.8, 6.2(i): time sequence
This chapter describes the development process in a set of airmass images. 3-hourly sequences are shown.
Basic Synoptical Parameters
Geopotential Height 1000 hPa: time sequence
In the following chapter the cloud configurations seen in satellite images are related to the basic field of surface pressure represented by geopotential height in 1000 hPa. 6-hourly sequences are shown.
Geopotential Height 500 hPa: time sequence
In the following chapter the cloud configurations seen in satellite images are related to the basic field of surface pressure represented by geopotential height in 500 hPa. 6-hourly sequences are shown.
Summary
In this chapter the merging of a distinct cold air comma-like cloud feature with a cold front cloud band leading to an occlusion spiral can be observed with IR images. But the meteorological processes are totally different from an occlusion process. The three stages according to the conceptual model of an instant occlusion can be followed with the satellite images.
The WV image reveals the influence of upper dry air in the development. A broad dark area of dry air can be observed at the rearside of the cold front in the cold air area. The Airmass RGB shows that stratospheric air coincides well with the dark stripes in WV images.
The geopotential height fields provide a first insight into the dynamic development. A strong surface low as well as an upper air low is connected with the process of this instant occlusion. Quite remarkably, the surface low remains almost stationary over a long period of time.
In the next chapter, a number of derived meteorological parameters will help to better understand the dynamic processes involved in this case.