Numerical model output
The numerical models used in this study were ECMWF and AROME which are of course quite different, the resolution being 9 km for the first and 2.5 km for the latter. Furthermore. the two other important differences for this case study are the orography and the land-sea mask for Madeira Archipelago. The real orography indicates that the highest mountain is 1862 m, while for ECMWF it is 709 m and for AROME 1611 m (fig. 3.15). Nevertheless, both models showed a generally good performance, with AROME giving more detail as expected.
The blocking of low-level air is known as one of the mechanisms for foehn formation and the Froude and M number results from AROME are consistent with this situation (table 3.2). These numbers were computed for two locations along the cross section, i.e. D80 and D95 (D is the distance, fig. 3.15).
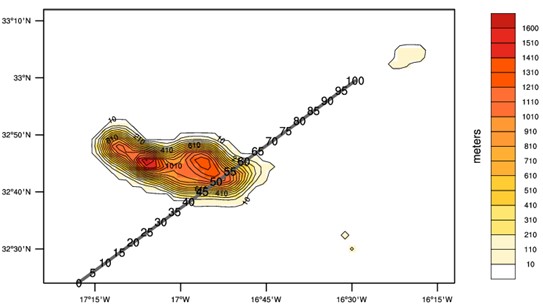
Figure 3.13: AROME Orography in plane and cross section along NE-SW direction.
The non-dimensional mountain height is defined by Jiang et al (2005) as:
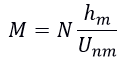
where hm is the model mountain height, N is the Brunt-Väisälä frequency (average below hm) and Unm is the cross-mountain wind speed (average below hm). The model mountain height, hm, is the mean model orography given by:
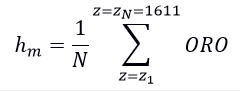
hm = 1055 m with z1=700 m (average height of the ridge above 700 m, represents about 43% of Madeira Island (fig. 3.16).
hm = 1417 m with z1=1300 m (average height of the ridge above 1300 m, includes 11 grid-points (fig. 3.16).
The Fr number used in table 3.2 is defined as:
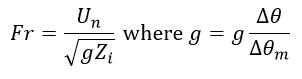
where Zi is the inversion base height, Δθ is the magnitude of the potential temperature difference across the inversion, θm is the mean potential temperature below the inversion base and Un is the cross-mountain wind speed (average below Zi).
The maximum value of N set the level of the inversion, thus allowing to know the base and the top of it.
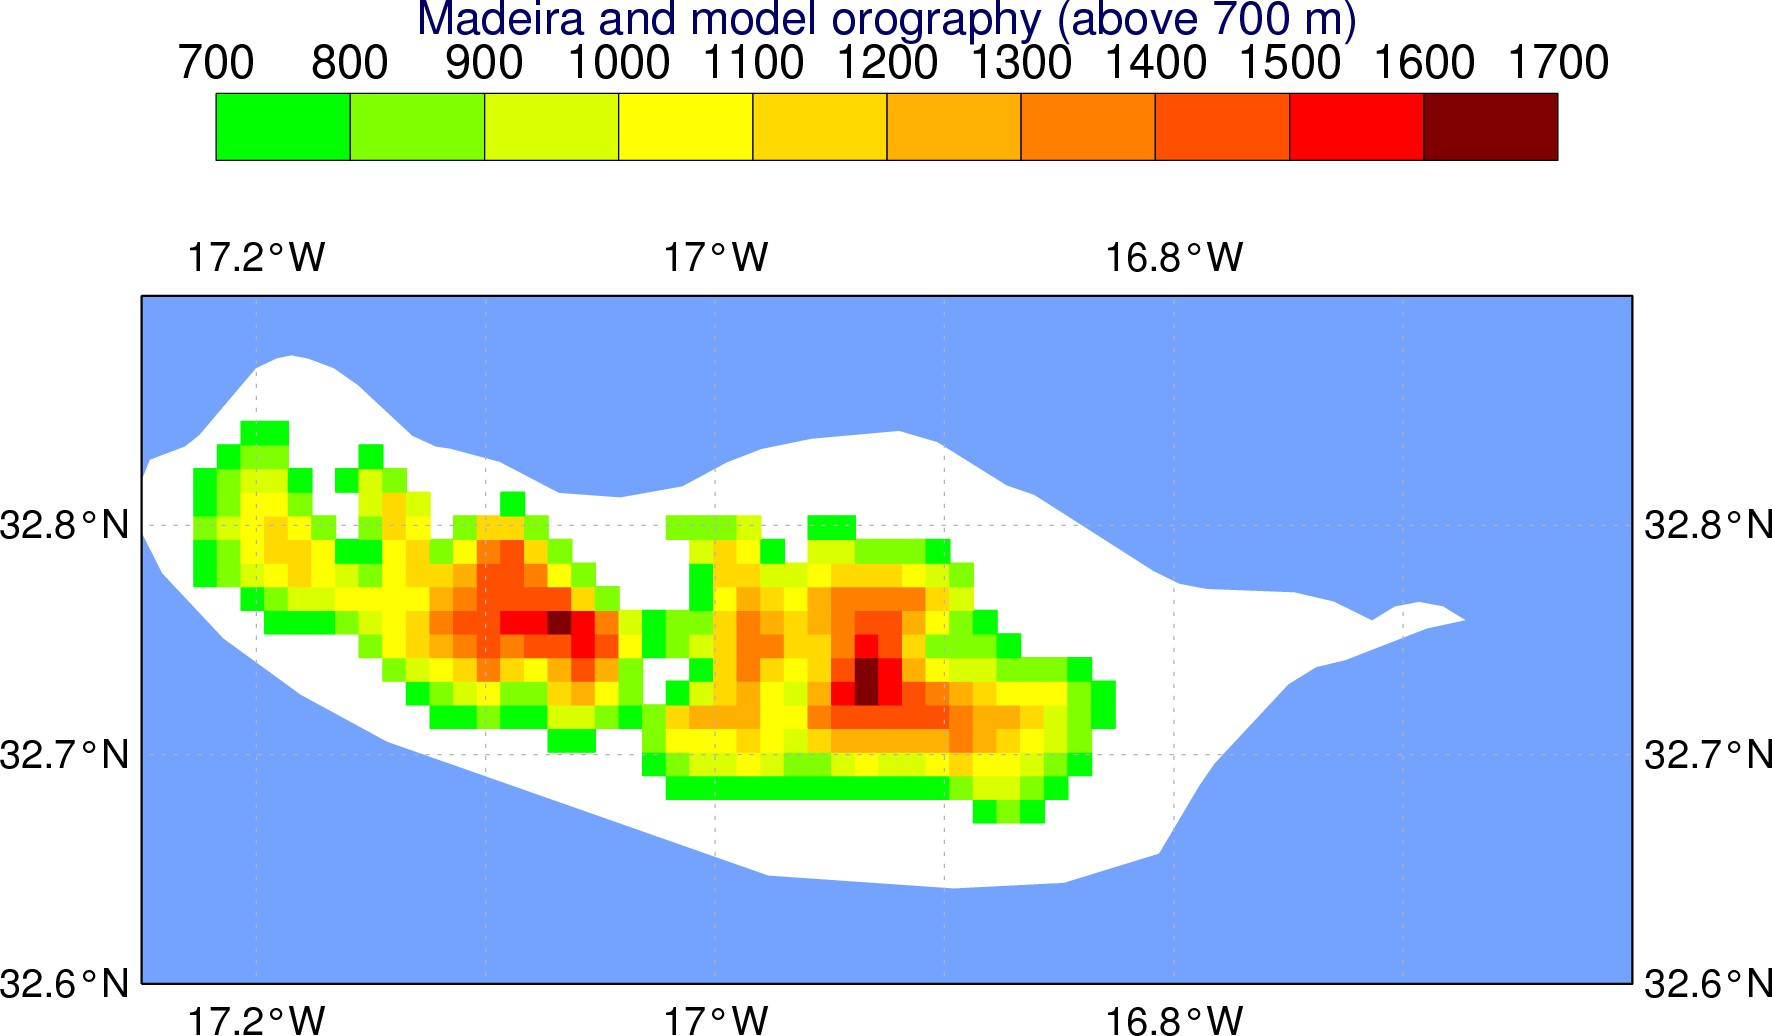
Figure 3.14: AROME orography above 700 m in Madeira Island.
Table 3.2 - Froude and 1/M numbers from AROME output. The values of hm were chosen according to model's orography.
| Zi | Fr | 1/M (hm = 1417 m) |
1/M (hm= 1055 m) |
|
|---|---|---|---|---|
| D80 (cross-section) | 502 | 0.43 | 0.47 | 0.58 |
| D95 (cross-section) | 490 | 0.64 | 0.54 | 0.7 |
The values < 1 for both Fr and 1/M are consistent with a subcritical flow in a statically stable atmosphere. In this situation, a region of deceleration flow is expected, in which the air is blocked and must go around the mountain or be turned back.
In fig. 3.17 to 3.20, the AROME output for one of the foehn events is shown and the cross-section is represented in fig. 3.15.
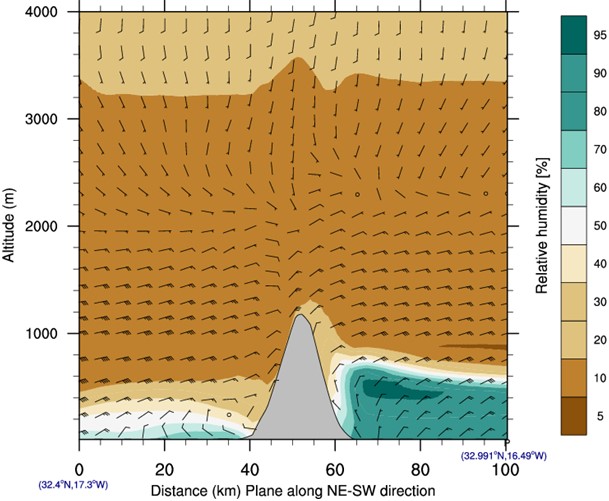
Figure 3.15: Vertical cross-section derived from AROME (direction in fig. 3.15) for relative humidity (%) and wind (kt) at 050300UTC from 050000UTC run.
The first foehn event most evident in the data from Funchal occurred during the night of 4 to 5 August. At that time the intercept of the isentropes (θ < 304 K and Z < 750m) with the mountain suggests flow blocking to the north (fig. 3.18) and the tilting of the isentropes indicates the warmer air at the lee side. Fig. 3.17 also indicates an area of cool and moist low-level air on the windward side of the mountain and a much drier on the opposite side. The data also suggest light winds (~5kt below 750m) on the windward side, which can represent the area of stagnant air. One interesting feature seen in the cross section is a topographically induced vertically propagating wave at the time the foehn-like conditions were observed. The isentropes represented in fig. 3.18 indicate also a sharper descent over the lee slope, which is consistent with subsidence.
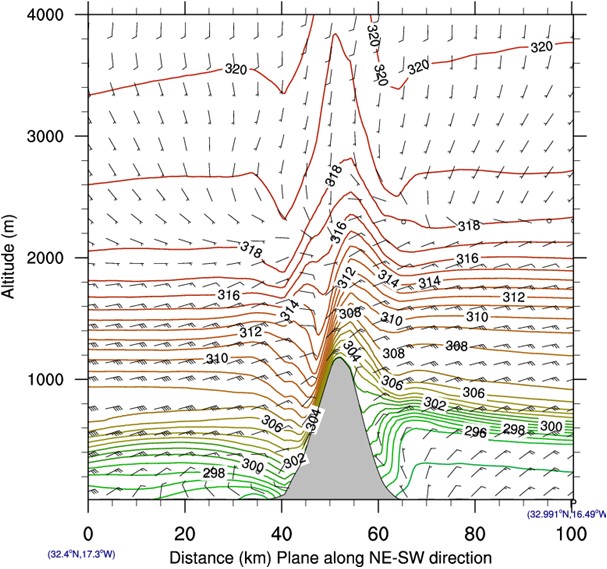
Figure 3.16: Vertical cross-section derived from AROME (direction in fig. 3.15) for potential temperature (K) and wind (kt) at 050300UTC from 050000UTC run.
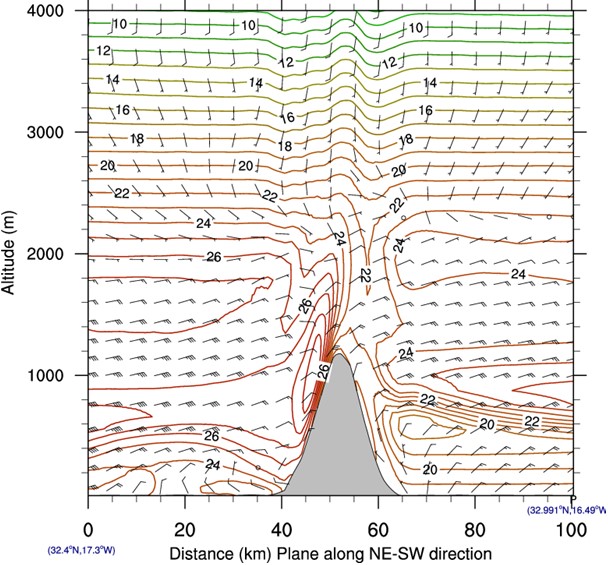
Figure 3.17: Vertical cross-section derived from AROME (direction in fig.3.15) for temperature (Celsius) and wind (kt) at 050300UTC from 050000UTC run.
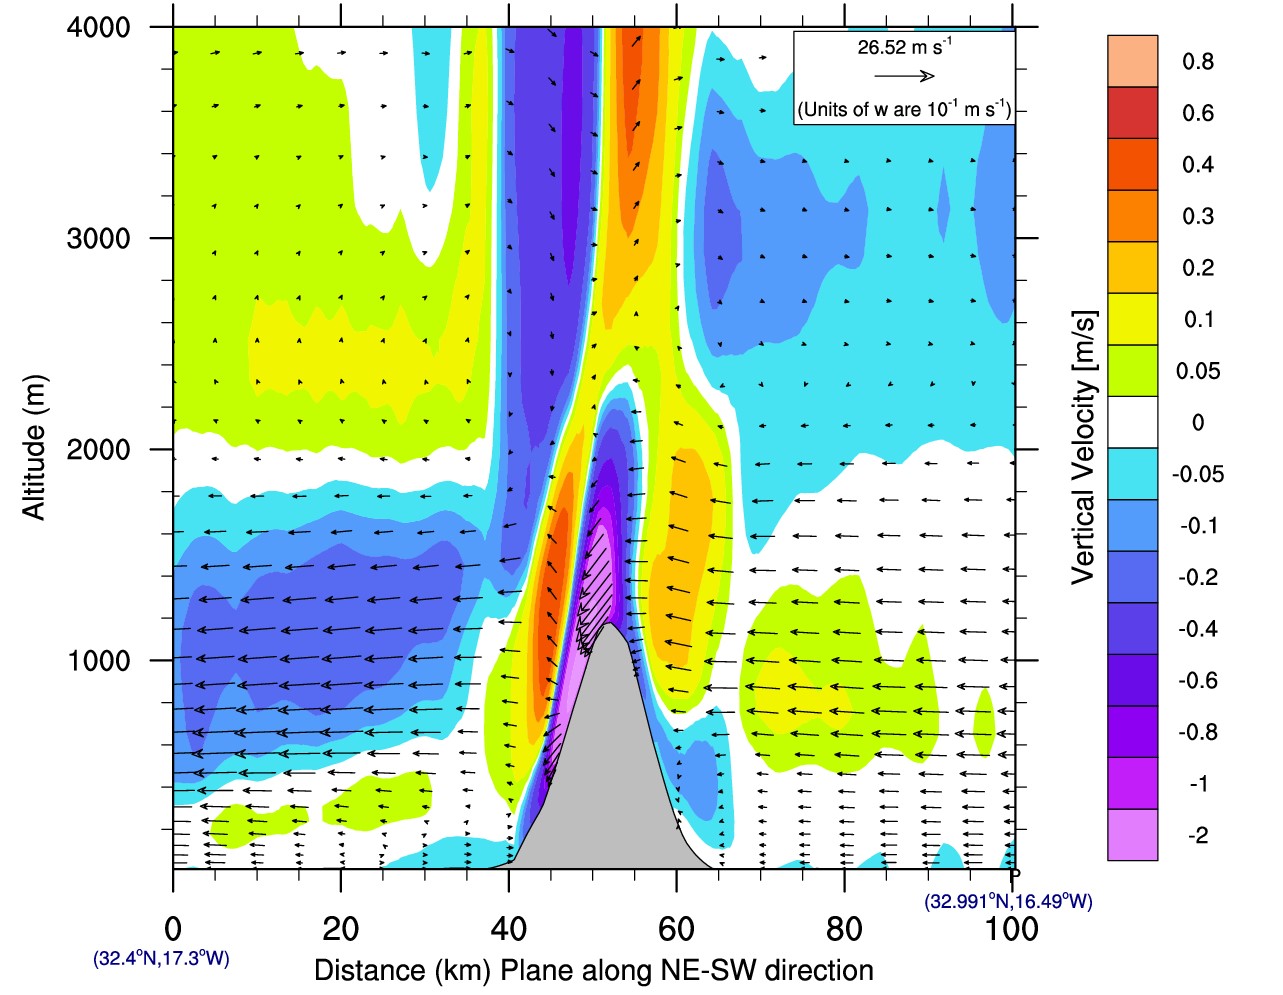
Figure 3.18: Vertical cross-section derived from AROME (direction in fig. 3.15) for vertical velocity (shaded) and cross-barrier wind (arrows) at 050300 UTC from 050000 UTC run.
In fig. 3.20, the vertical velocity shows subsidence or negative values at the lee side of the mountain (purple colours) and at the upwind side below ~700 m (blue colours) and these values are consistent with the cross-barrier wind arrows shown.
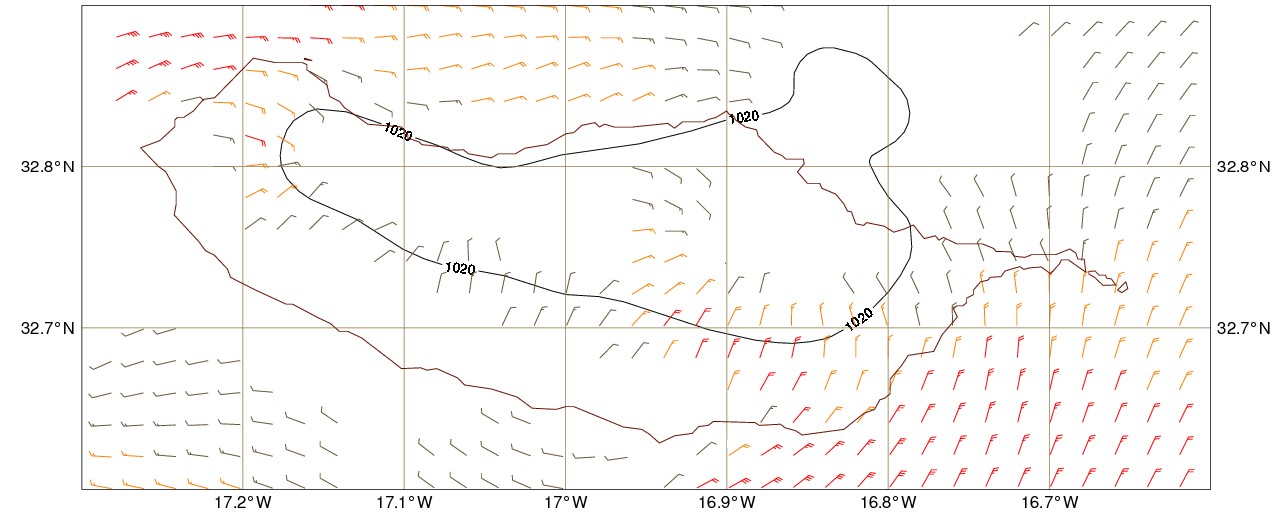
Figure 3.19: Mean sea level pressure (hPa) and surface wind (barbs) derived from AROME at 050300UTC from 050000UTC run.
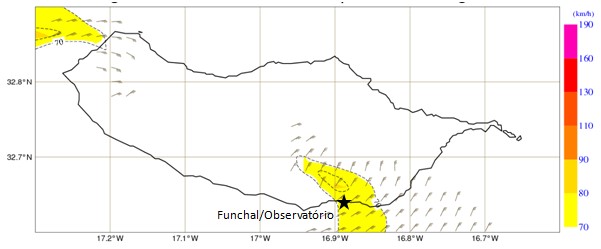
Figure 3.20: Wind gust (barbs and gust speed in shaded in km/h) derived from AROME at 050300UTC from 050000UTC run. The star shows the location of weather station Funchal/Observatório.
In fig. 3.21 and 3.22, AROME shows, in the south-east area of Madeira Island, an increase in both wind speed and gust speed. The maximum wind gust detected by Funchal Observatório during this 3 hour period was around 62 km/h.