In-situ observations
To better describe the event, observational data from some automatic weather stations were used. The data included measurements of temperature, relative humidity, wind (speed and direction) and gust. The position of these stations in relation to the major topographic features is shown in fig. 3.4 and additional information in table 3.1.
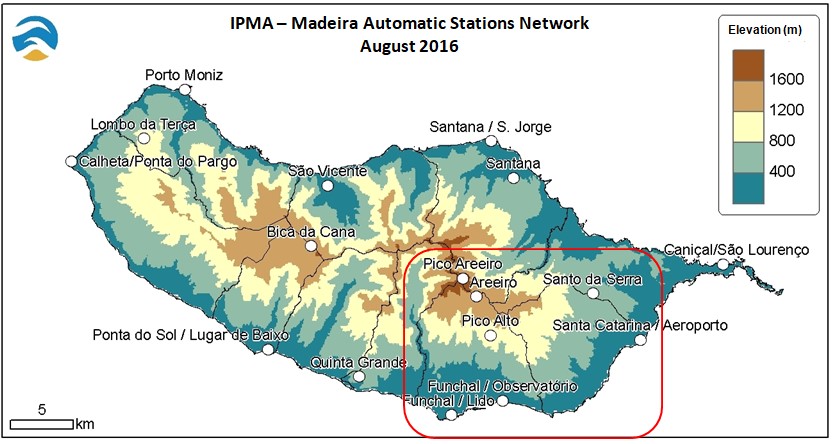
Figure 3.4: Madeira Automatic Stations network. Red square indicates the study area.
Table 3.1 - Weather Stations Metadata
| WMO ID n° | Weather Station Name | Elevation (m) | Latitude | Longitude |
|---|---|---|---|---|
| 08974 | Pico Areeiro | 1799 | 32°44'N | 16°55'W |
| 08973 | Areeiro | 1590 | 32°43'N | 16°54'W |
| 09972 | Pico Alto | 1118 | 32°42'N | 16°54'W |
| 08522 | Funchal Observatório | 58 | 32°38'N | 16°53'W |
| 08521 | Santa Catarina | 58 | 32°41'N | 16°46'W |
Temperature (fig. 3.5) and relative humidity (fig. 3.6) during this weather situation were consistent with two possible foehn events, from 4 to 6 August and 8 to 10 August. To distinguish foehn conditions at stations, three observational criteria were used: surface winds blowing from the direction of the mountains, an abrupt rise in air temperature and an accompanying reduction in atmospheric moisture.
The evolution of these parameters at lee stations were not the same, particularly for the first event, as near the coast (Funchal and S. Catarina) the changes happened earlier and were more obvious than at higher altitudes (Areeiro, Pico do Areeiro and Pico Alto). The second event lasted longer and occurred during the wildfires. Fig. 3.7 to 3.14 provide detailed data on the evolution of temperature, relative humidity and wind for Funchal. For this station, in both events, the observations of temperature and relative humidity exhibited anomalous maxima and minima and coincided with strong winds from the north-east, i.e. from the direction of the mountains.
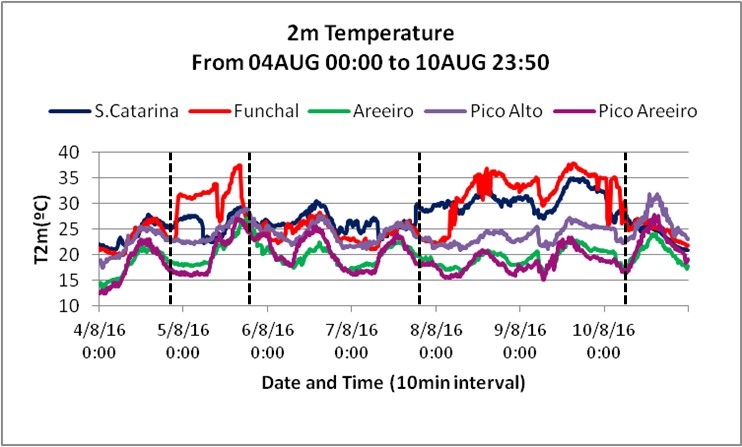
Figure 3.5: Time series of temperature at S.Catarina, Funchal, Areeiro, Pico Alto and Pico do Areeiro from 040000 to 102350 UTC. The dashed black vertical lines indicate the period when foehn-like conditions were most pronounced.
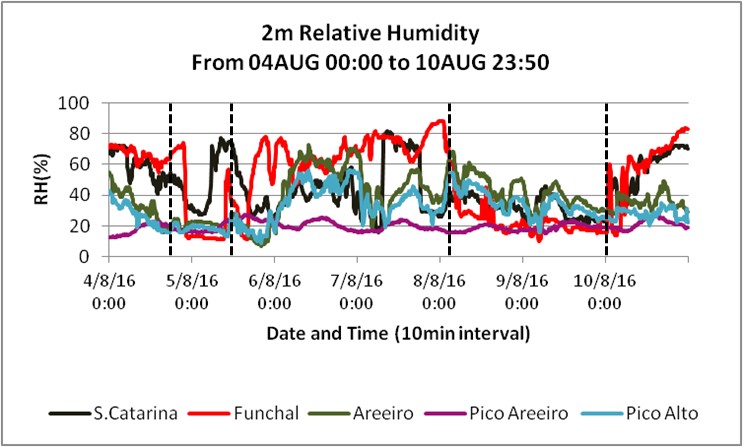
Figure 3.6: Time series of relative humidity at S.Catarina, Funchal, Areeiro, Pico Alto and Pico do Areeiro from 040000 to 102350 UTC. The dashed black vertical lines indicate the period when foehn-like conditions were most pronounced.
From 4 to 5 August, variations in temperature, relative humidity and wind were almost simultaneous and lasted about 12 hours (fig. 3.7 to 3.10)
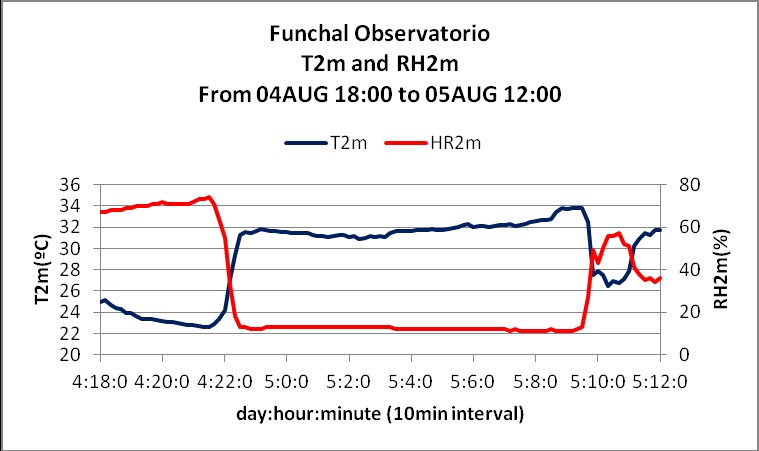
Figure 3.7: Time series of relative humidity and temperature at Funchal from 041800UTC to 051200UTC.
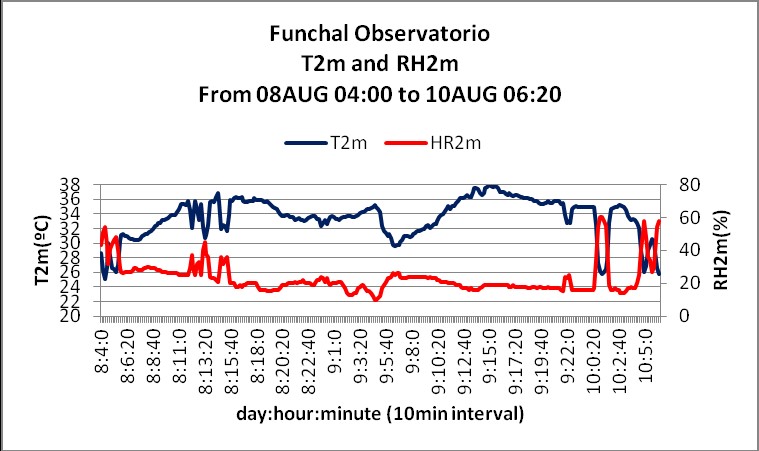
Figure 3.8: Time series of relative humidity and temperature at Funchal from 080400UTC to 100620UTC.
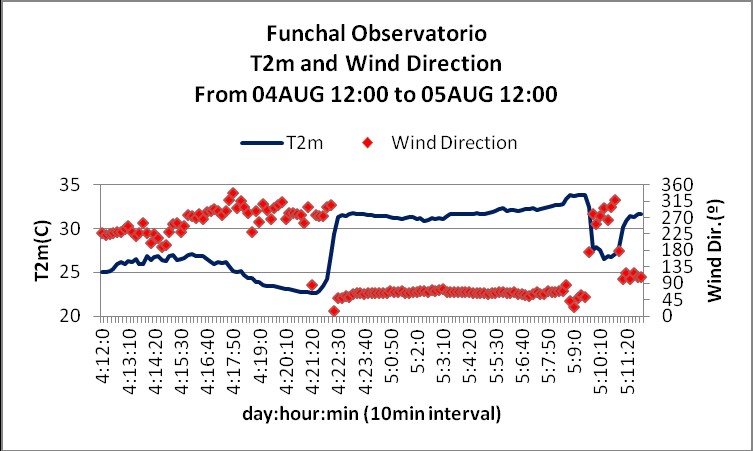
Figure 3.9: Time series of temperature and wind direction at Funchal from 041200UTC to 051200UTC.
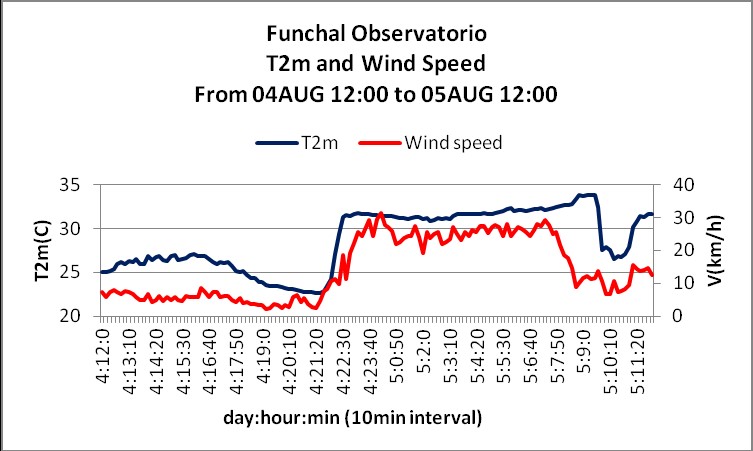
Figure 3.10: Time series of temperature and wind speed at Funchal from 041200UTC to 051200UTC.
The second event, from 8 to 10 August, lasted 48 hours but had some discontinuities in the foehn pattern. During these breaks, the wind blew from west or south-west, which in this weather station means cooler air at lower levels (fig. 3.11 to 3.14).
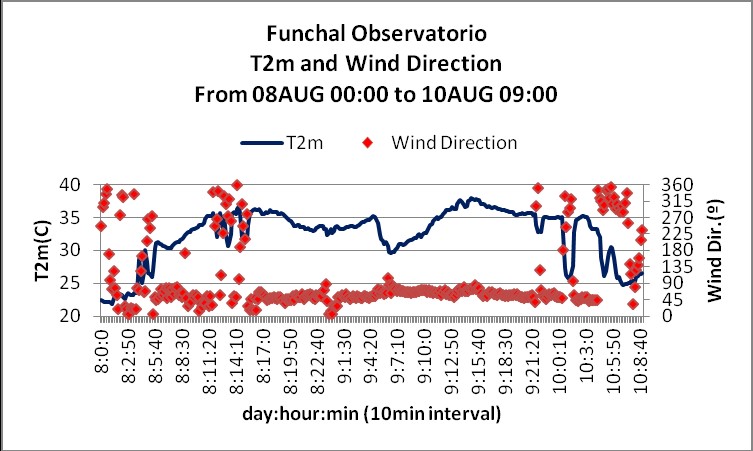
Figure 3.11: Time series of temperature and wind direction at Funchal from 080000UTC to 100900UTC.
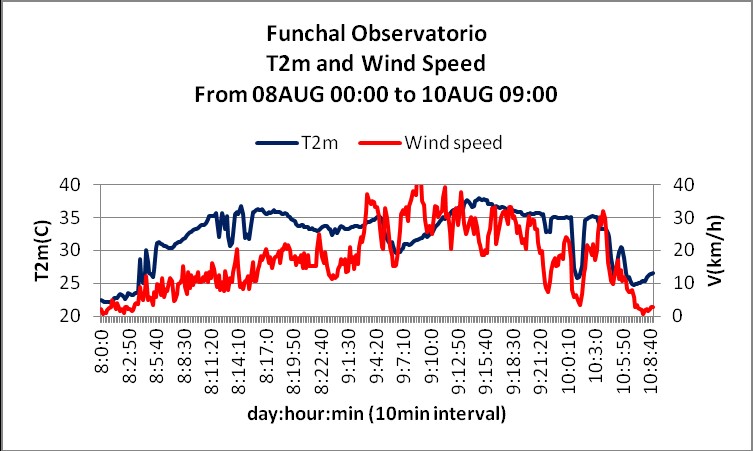
Figure 3.12: Time series of temperature and wind speed at Funchal from 080000UTC to 100900UTC.