The significance of extreme soil moisture at the end of May 2013
Due to the heavy precipitation at the end of May the soil was saturated with water. The recorded soil moisture values were the highest since measurements were begun in 1962. They correspond to the dark blue areas in the following figure, and these areas would also become the flood regions later.
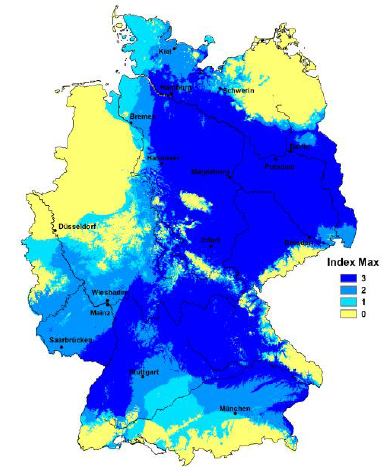
Figure 3.2: Extreme values of soil moisture on 31 May 2013, compared to the 31 May average from 1962 to 2012. Source: (1)
0: no previous records were surpassed
1: third highest recorded value of soil moisture is surpassed
2: second highest recorded value of soil moisture is surpassed
3: highest recorded value of soil moisture is surpassed, new absolute maximum
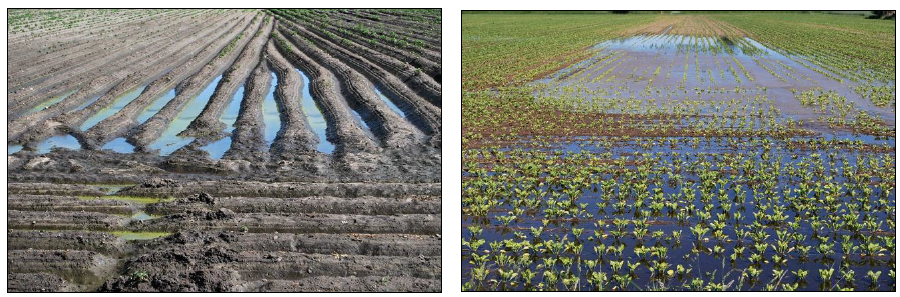
Figure 3.3: Flooded fields. Potato field on the left, sugar beet field on the right. Source: ZAMG Braunschweig (DWD)
The Moderate Resolution Imaging Spectroradiometer (MODIS) on NASA's Terra satellite observed flooding in central and eastern Germany on 5 May 2013 (before the flood) and on 6 June 2013 (during the flood). On 6 June the Elbe river reached 8.7 meters, while its norm is only 2 meters.
These false-color images use a combination of visible and infrared light to make it easier to distinguish water and land. River water appears dark blue to black and vegetation is bright green. These images are used in situations like floods or forest fires because of their sharp contrast.
Images like these are also available from the new Suomi-NPP satellite and the VIIRS instrument.
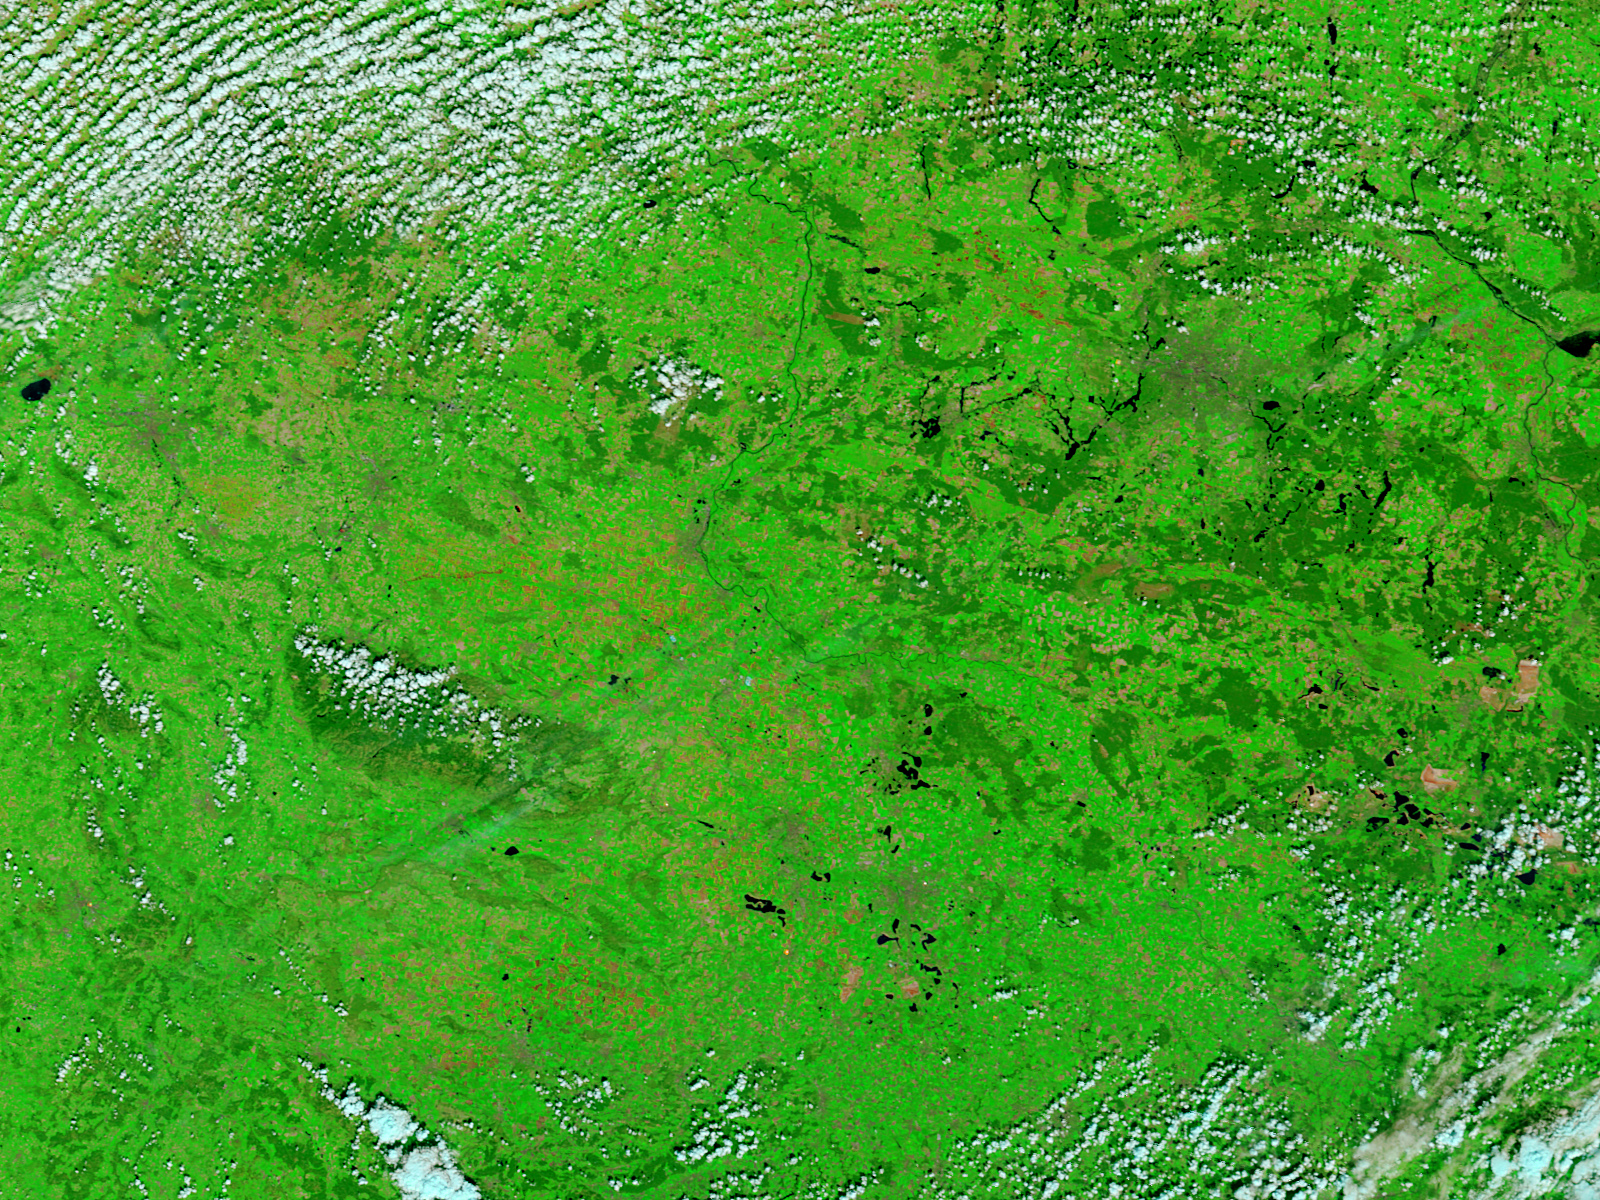
Figure 3.4: 5 May 2013. An image from NASA's Terra satellite with the MODIS instrument, showing the Elbe catchment area. Source:
http://earthobservatory.nasa.gov/NaturalHazards/view.php?id=81287
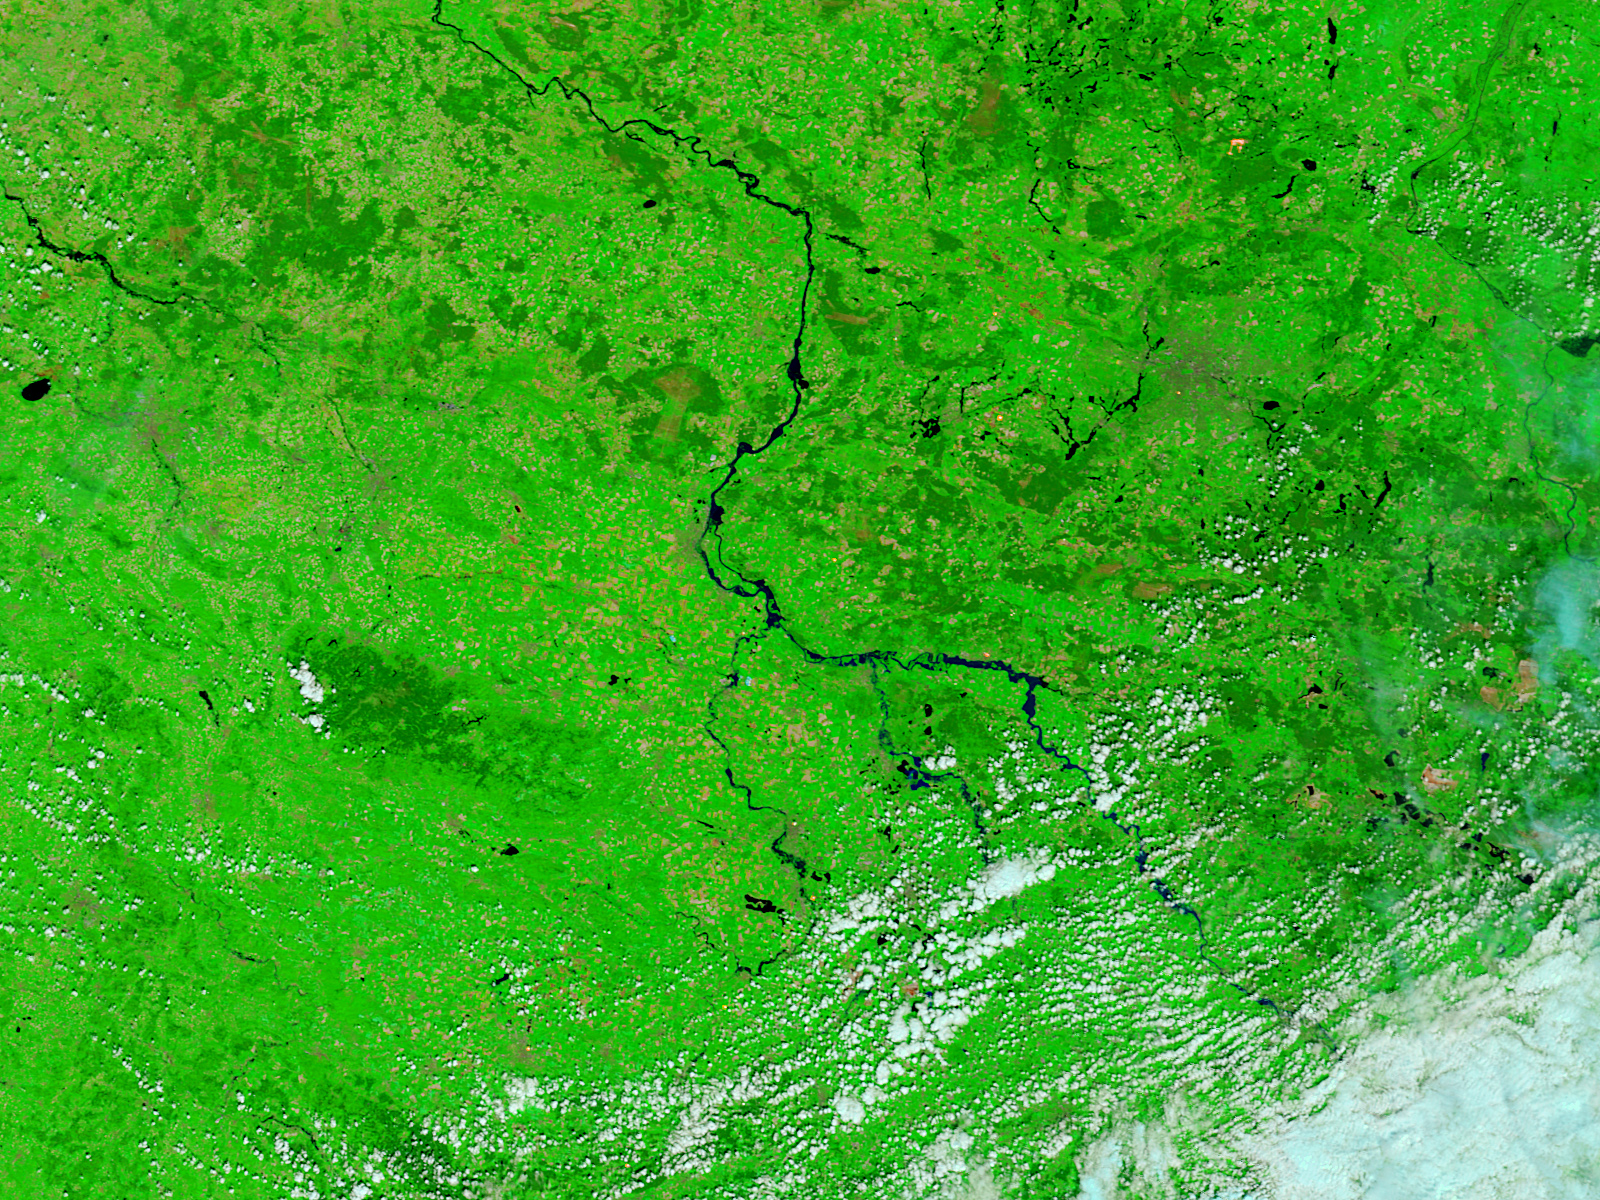
Figure 3.5: 5 June 2013. An image from NASA's Terra satellite with the MODIS instrument, showing the Elbe catchment area. Source:
http://earthobservatory.nasa.gov/NaturalHazards/view.php?id=81287