Mallorca
Although the main subject of this case was the reversed omega block and the associated severe convection and the flash floods there was another interesting weather event taking place in the aftermath of this case. On the 4th October another series of convective development was occurring over the Balearic Islands and the Mediterranean Sea that with the associated weather events is also worth spending an extra chapter to. As on that day an F2 tornado went over Mallorca causing along with the large hail and wind gusts some serious damage.The mesoscale features that were associated to this convective system can also be well seen in the following three images (click to enlarge!)
 |
 |
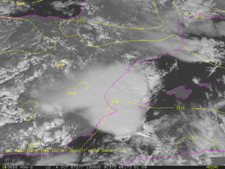 |
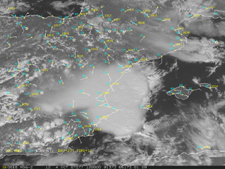
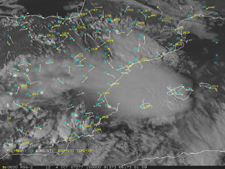
| Meteosat 9 HRVIS + surface wind | Meteosat 9 HRVIS + surface wind | Meteosat 9 HRVIS + ECMWF MSLP |
Meteosat 9 IR10.8μm: time sequence
In this series of images the convective developments over the Balearic Islands are described using plain Meteosat infrared 10.8 μm. The channel is appropriate as it pictures the ice particles from high clouds quite clearly. In a sequence of 15 minutes the relevant satellite image are presented.
Meteosat 9 Enhanced IR10.8μm: time sequence
In this chapter again Meteosat 9 infrared 10.8 μm is shown, but the images have been artificially color enhanced. This will improve the discrimination of where most ice particles form during the several convective stages. In a sequence of 15 minutes the satellite images are presented and described.
Meteosat 9 WV6.2μm: time sequence
The chapter presents the several convective developments over Mallorca using Meteosat 9 WV6.2 channel. The channel is suitable as it gives an idea of the upper tropospheric humidity (UTH) and gives a view of the upper air dynamics. 15 minutes sequence of images are presented.
Meteosat 9 HRVIS: Time sequence
This chapter will show the HRVIS images of 4th October. Especially with the smaller scale cells the high resolution channel allows us a very good monitoring of the convective development. In a sequence of 15 minutes the satellite images are presented and described.
HIRLAM: Precipitation forecast
The model run from HIRLAM of 3rd of October 0000UTC is the basis for the calculation of the total precipitation that was forecasted during the events of this case over the Iberian Peninsula and the Balearic Islands. These forecast images are shown in combination with the enhanced IR10.8 satellite image to make a comparison between model and real time imagery.
HIRLAM - Stability Parameters: time sequence
 |
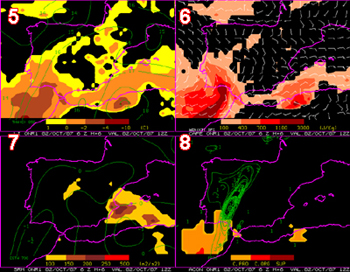 |
You might have seen the images above before, if not in the above two image there are 8 panels plotted that a forecaster in Spain has operational to see from the model where there is potential for convection. In this part of this chapter we will zoom in to this product and look at these different parameters from the HIRLAM model and describe the details we see in relation to this severe weather over the Balearic Islands. We will start with shortly identifying which these parameters are:
- PW, or precipitable water and is the amount of water is the amount of liquid water, in mm, if all the atmospheric water vapour in the column were condensed. High values of PW in clear air often become antecedent conditions prior to the development of heavy precipitation and flash floods. When high PW values areas present a lifting mechanism and warm advection in low levels, heavy precipitation often occurs. These data can provide to forecasters an important tool for very short range forecasting.
- The opposite to CAPE is CIN which we also see plotted in the right image in the top right panel. CIN, which stands for convective inhibition is a numerical measure in meteorology that indicates the amount of energy that will prevent an air parcel from rising from the surface to the level of free convection. Sometimes is is also referred to as Cap or Cap inversion.
- The winx in the bottom left is derived from the WINDEX or Wind Index which is based on observations and numerical models (in this case HIRLAM) of microbursts that suggest strong downdrafts that are initiated as a result of frozen precipitation falling through the melting level. Thereafter, evaporative cooling maintains the negative buoyancy in the subcloud dry adiabatic layer to the surface where the intense wind gust is sometimes realized.
- CIZ6 is the wind shear calculated from the lower 500 m of the atmosphere averaged on a horizontal plain of 6 km.
- Top left the Lifted Index is plotted. Negative values indicate unstable air masses.
- Top right CAPE is plotted. CAPE which stands for (Convective Available Potential Energy) is a measure of the amount of energy available for convection.
- To the bottom left we see SRH which stands for Storm Relative Helicity and which which is a measure of the potential for cyclonic updraft rotation in right-moving supercells, and is calculated for the lowest 1-km and 3-km layers above ground level.
- Bottom right ACON is a combination of several instability parameters where different thresholds are set:
ACON Deep convection LI<0; CAPE>600J Kg-1; CIN<300 J Kg-1 Structurised deep convection CAPE>700J Kg-1; CIZ>9 m s-1; RH (70 - 50 kPa)<60% Supercell CAPE>700J Kg-1; CIZ>9 m s-1; RH (70 - 50 kPa)<60%; SRH>150 m2 s-2
Spain: Radar
The use of radar for detection of hail has proven to be very usefully. Large hail is regularly observed in association with intense thunderstorms (as in this case study) and is often the cause of severe damage on e.g. crops, roofs and cars. Hail is a local phenomenon, in both time and space, so that it can not be easily detected using satellite imagery or with surface observations (since the density is to coarse).For the 4th October the Radar is shown over the Balearic Islands(source AEMET).
Since the radar over Mallorca was not yet in use when this case happened there is an obvious underestimation as the signal gets weaker (max radar range of AEMET 240 km.). A signal of the supercell can however already be seen before in the morning hours of the 4th October with the radar stationed in Almería (courtesy of Jose Antonio Quirantes) . From this animation it is a pity that the system gets soon out of the radar range, and it is is difficult to say if the system remained supercellular until it reached Mallorca later that afternoon because by then it was very far from the radars, it probably did so during half of its way, but it seems that finally evolved to a bow echo structure, when crossing Mallorca Island. This can be however be argued as there was no doppler radar available to verify it.
Interactive Overlay
The following chapter presents the set of ECMWF parameters combined with the satellite image. The interactive overlays gives you the freedom to combine and study them. A short description on the most interesting features is given to provide you with some extra guideline.
Concluding remarks
This extra chapter presents the satellite and NWP material of the 4th October when a tornado swept over Mallorca. The MCS responsible for this is well monitored using the remote sensing data. The HRVIS images shows interesting features such as overshooting tops and gravity waves that depict the severity of the event. Unfortunately the range of the radar stations over the Spanish mainland are to weak to capture the whole event in detail as it moves over Mallorca but does provide some extra information due to the high reflectivity it shows.
It seemed as if the system were moving towards the maximum of thermal advection at low levels, which is quite pronounced.
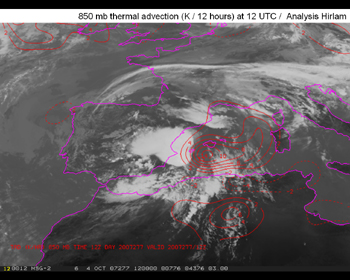 |
| Meteosat 9 IR10.8 + HIRLAM Temperature Advection 850 hPa. |
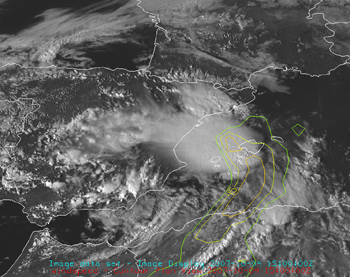 |
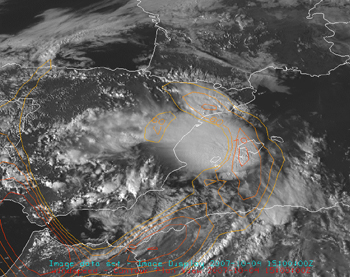 |
| Meteosat 9 HRVIS + ECMWF Isotachs 700 hPa. | Meteosat 9 HRVIS + ECMWF Isotachs 300 hPa. |
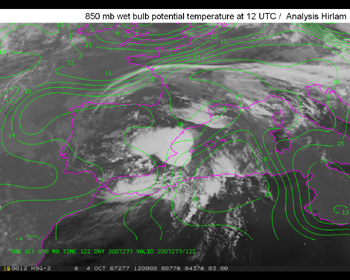 |
| Meteosat 9 IR10.8 + HIRLAM Equivalent Potential Temperature 850 hPa. |
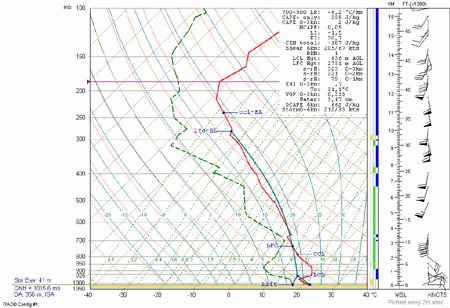 |
| Radio Sounding Mallorca: 4th October 12UTC |
It can be noticed that the position of the dew point maximum is more to the south of Mallorca Island, implying a marked dewpoint advection forecasted for 15 UTC that would have an implication on the evolution of the observed Mallorca sounding at 12 UTC, (which showed values of dew point at 925 mb of 7.6 şC, according to this table) in the way of increasing potential and vertically integrated bouyancy far beyond the -1.5 LI and 335 J/kg CAPE values showed by the 12 UTC sounding.
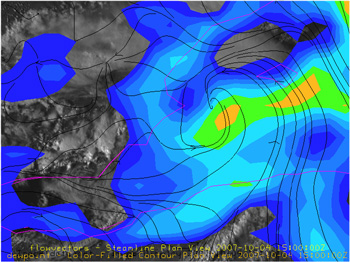 |
| Meteosat 9 HRVIS + Streamlines and ECMWF Dewpoint Temperature 925 hPa. |