Synoptic Situation: Derived parameters
Basic parameters like surface pressure (height of 1000 hPa.) and upper level height (here at 500 hPa.) do not reveal the whole physical background of the situation and cannot fully explain the details seen in the cloud features. In the following chapters the case will be further investigated using relevant derived meteorological parameters overlayed on satellite images.Meteosat 9 satellite images and Temperature Advection 700 hPa.: time sequence
Since thermal advection is analyzed on a more synoptic scale it is not likely to play a direct role in the local development of thunderstorms. The horizontal distribution of warm air advection and identifying its maximum is important since it can slightly contribute to upward motion and convection. In this chapter the Thermal Advection at 700 hPa is described in relation to the prefrontal convergence. It is overlayed on various Meteosat 9 satellite images and presented in 6-hour interval.
Meteosat 9 satellite images and Thermal Front Parameter and Equivalent Thickness: time sequence
In this chapter the large frontal zone over Spain is presented using the Thermal Front Parameter. Along with this parameter also the relative topography is shown.
Meteosat 9 satellite images and PVA and Isotachs 300 hPa.: time sequence
Isotachs at 300 hPa show the distribution of the wind speed and the approximate location of the jet streak. Enhanced convective cloudiness lies within the left exit region of the jet. Superimposed upon the enhanced cloudiness the maximum of PVA at 300 hPa can be found. Isotachs and PVA at 300 hPa are overlayed on Meteosat 9 satellite images and shown in a time sequence of 6 hour intervals.
Meteosat 9 satellite images and height of PV=1: time sequence
In WV6.2 and Airmass satellite images the intrusion of dry stratospheric air to the lower levels of the atmosphere is represented in the form of the dark and red stripes, resp. In this chapter the information in the WV and Airmass images is supported by the field of height of potential vorticity equals 1.
Meteosat 9 satellite images and Showalter Index: time sequence
One way of characterizing the stability of the atmosphere is by making use of the Showalterindex. Values under 0 are a sign of a unstable atmosphere. Values under -3 are very unstable and are related to thunderstorms. In this chapter the Showalterindex is presented, overlayed on Meteosat 8 IR10.8 imagery, in 3 hour sequence.
HIRLAM - Stability Parameters: time sequence
 |
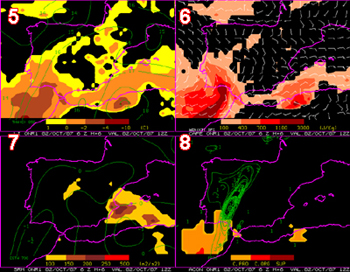 |
In the above two image there are 8 panels plotted that a forecaster in Spain has operational to see from the model where there is potential for convection. In this part of this chapter we will zoom in to this product and look at these different parameters from the HIRLAM model and describe the details we see in relation to this case study. We will start with shortly identifying which these parameters are:
- PW, or precipitable water and is the amount of water is the amount of liquid water, in mm, if all the atmospheric water vapour in the column were condensed. High values of PW in clear air often become antecedent conditions prior to the development of heavy precipitation and flash floods. When high PW values areas present a lifting mechanism and warm advection in low levels, heavy precipitation often occurs. These data can provide to forecasters an important tool for very short range forecasting.
- The opposite to CAPE is CIN which we also see plotted in the right image in the top right panel. CIN, which stands for convective inhibition is a numerical measure in meteorology that indicates the amount of energy that will prevent an air parcel from rising from the surface to the level of free convection. Sometimes is is also referred to as Cap or Cap inversion.
- The winx in the bottom left is derived from the WINDEX or Wind Index which is based on observations and numerical models (in this case HIRLAM) of microbursts that suggest strong downdrafts that are initiated as a result of frozen precipitation falling through the melting level. Thereafter, evaporative cooling maintains the negative buoyancy in the subcloud dry adiabatic layer to the surface where the intense wind gust is sometimes realized.
- CIZ6 is the wind shear calculated from the lower 500 m of the atmosphere averaged on a horizontal plain of 6 km.
- Top left the Lifted Index is plotted. Negative values indicate unstable air masses.
- Top right CAPE is plotted. CAPE which stands for (Convective Available Potential Energy) is a measure of the amount of energy available for convection.
- To the bottom left we see SRH which stands for Storm Relative Helicity and which which is a measure of the potential for cyclonic updraft rotation in right-moving supercells, and is calculated for the lowest 1-km and 3-km layers above ground level.
- Bottom right ACON is a combination of several instability parameters where different thresholds are set:
ACON Deep convection LI<0; CAPE>600J Kg-1; CIN<300 J Kg-1 Structurised deep convection CAPE>700J Kg-1; CIZ>9 m s-1; RH (70 - 50 kPa)<60% Supercell CAPE>700J Kg-1; CIZ>9 m s-1; RH (70 - 50 kPa)<60%; SRH>150 m2 s-2
Summary of the investigations in this chapter
The presentation and the study of the derived parameters helps us understand the processes which happened during the intense convective grow within within the frontal system The stability of the atmosphere was studied by using the NWP fields of the Showalter index combined with the (Enhanced) Infrared, Water Vapour and Airmass satellite images. The area of maximum convection fits well with negative values of the Showalter index. In the WV and Airmass images also a Jet could be seen. This was confirmed by the Isotachs at 300 hPa. In the left exit region of this north-south aligned jet a pronounced PVA300 maximum contributes to the onset of a Wave within the front. With a superimposed PVA maximum this Wave rapidly develops further into an occlusion as it moves from its original position in Morocco towards Spain. Embedded into this part of the system are a range of CBs where occasionally also V-shaped structures are seen.