Cold U/V Model
Satellite based V pattern storms had 70% probability of producing severe weather (McCann, 1983). The model of V-Storms with satellite data had been introduced by Heymsfield & Blackmer (1988) is given at Figure 3a. SEVIRI images both VIS and IR are well-defined in general the V-Storms even single cycle. IR10.8 image with a kind of lookup table is given Figure 3b. Cold Area (CA) is -72, Close-in Warm area (CWA) is -55.5 and Distant Warm Area (DWA) is -58°C. Wide view is given at Figure 4 and HRV image at Figure 5.
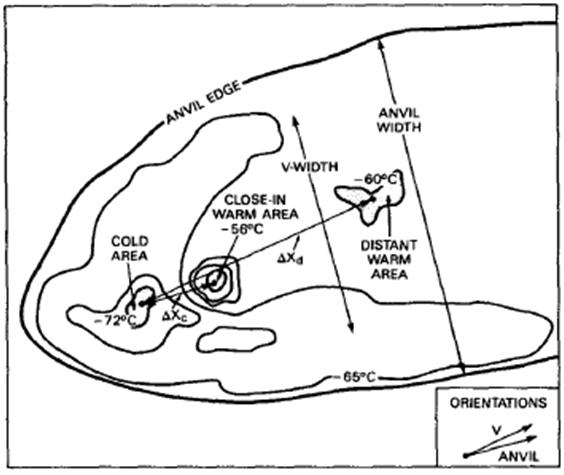
Figure 3: The Model of V Shape Storms (Heymsfield & Blackmer 1988)
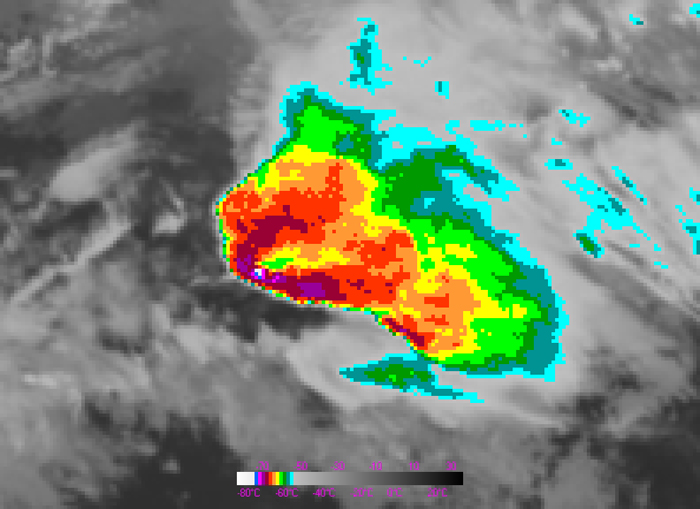
Figure 4: 5 November 2007, 06.00 GMT METEOSAT 9 IR10.8 Image. V-Storm over Southeastern of Turkey. CA is -72, CWA is -55.5 and DWA is -58 °C degree.
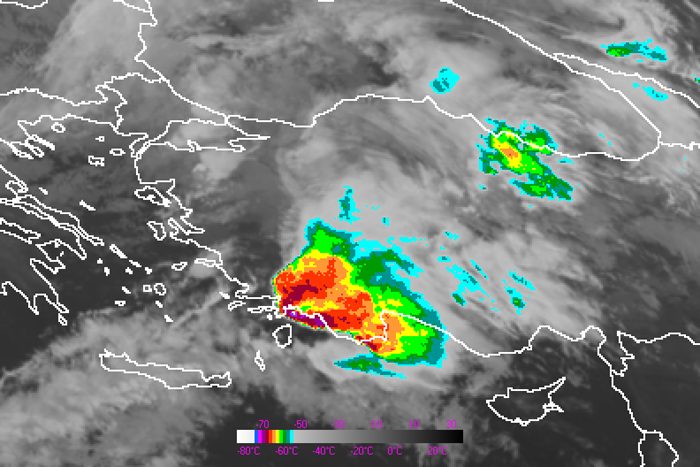
Figure 5: MSG Image with coast lines
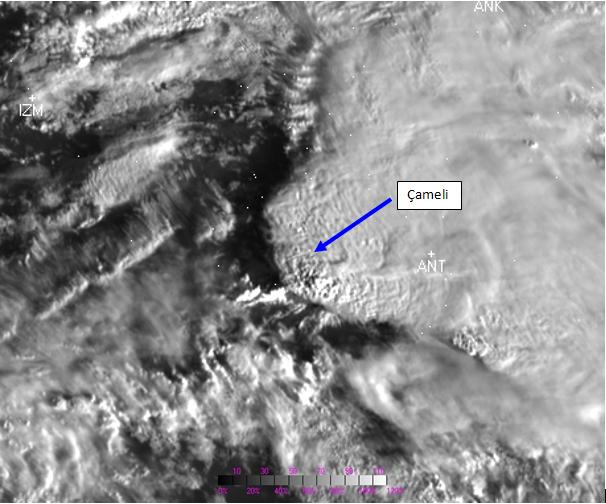
Figure 6: HRV image.
RGB Images
Severe Storm RGB and Airmass RGB images are given Figure 6 and Figure 7 respectively.
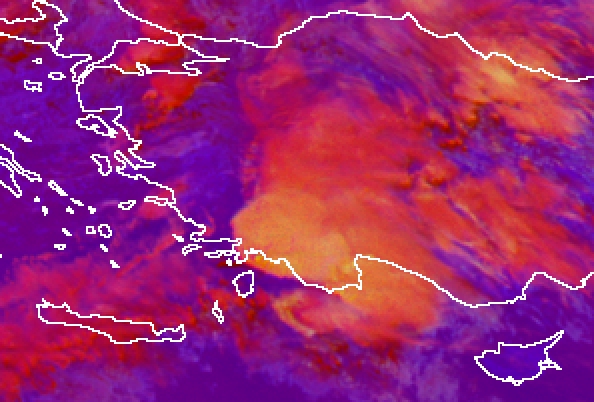
Figure 7: Severe Storm RGB
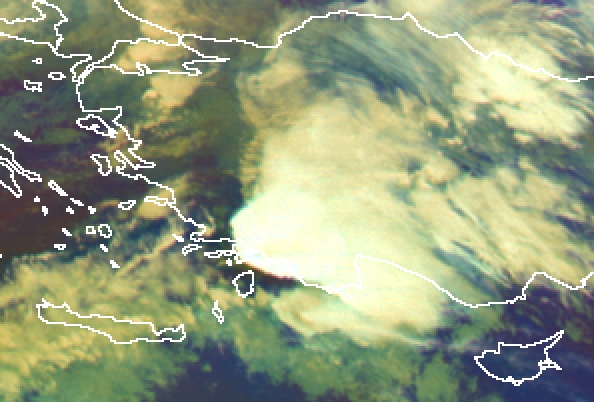
Figure 8: Airmass RGB
In addition we are able to present you with two loops of the event.
Figure 9: Meteosat 8 - Enhanced IR10.8
Figure 10: Meteosat 8 - Severe Storm RGB