Chapter IV: Logbook Nr. 2
Logbook Nr. 2
| Polarstern Satellite Logbook Nr. 2 | |
|---|---|
| Region | Atlantic |
| Conceptual Model | Inter Tropical Convergence Zone (ITCZ) |
| Date/Time | 8 to 12 November 2014 |
| Longitude/Latitude |
10,7°N / 23,0°W (08 Nov, 12:00 UTC) 8,0°N / 23,0°W (09 Nov, 12:00 UTC) 6,0°N / 23,2°W (10 Nov, 12:00 UTC) 4,0°N / 23,0°W (11 Nov, 12:00 UTC) 2,0°N / 23,0°W (12 Nov, 12:00 UTC) |
| Expedition |
PS88 (ANT-XXX/1) 25 Oct - 29 Nov 2014 Bremerhaven - Cape Town |
Figure L2-1 shows the global wind circulation with our focus, the Hadley cells, which cover the trade wind regions between the subtropical high and the intertropical convergenze zone (ITCZ). We will follow the research vessel Polarstern from 8 to 12 November 2014 on its way from the northeast trade winds through the ITCZ to the southeast trade winds.
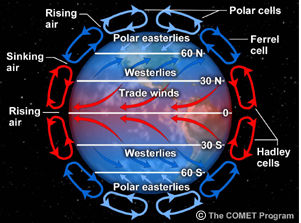
Figure L2-1: Global wind circulation.
Source: COMET, Introduction to Tropical Meteorology, Chapter 3: Global Circulation.
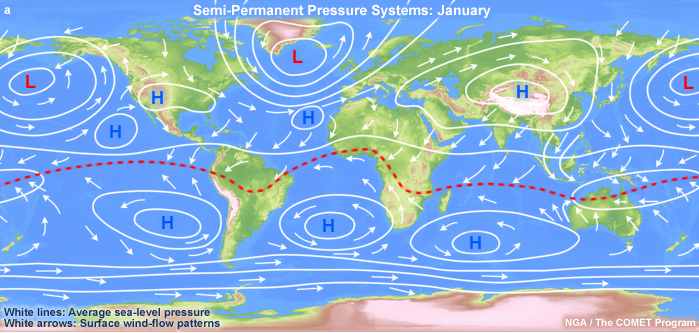
Figure L2-2: Mean pressure systems and corresponding wind vectors at the surface for January. The red dashed lines represent the equatorial trough (and monsoon trough over Asia). Source: COMET, Introduction to Tropical Meteorology, Chapter 3: Global Circulation.
Figure L2-2 depicts mean pressure systems with wind vectors in January. We can make an approximate comparison between this situation and the one on 8-12 November 2014.
In Figure L2-3, the tropics are marked by upward motion and the subtropics by sinking motion, forming the Hadley cell. The patterns are not mirrored across the equator. Note that the zones change from season to season and there are differences between land and the ocean.
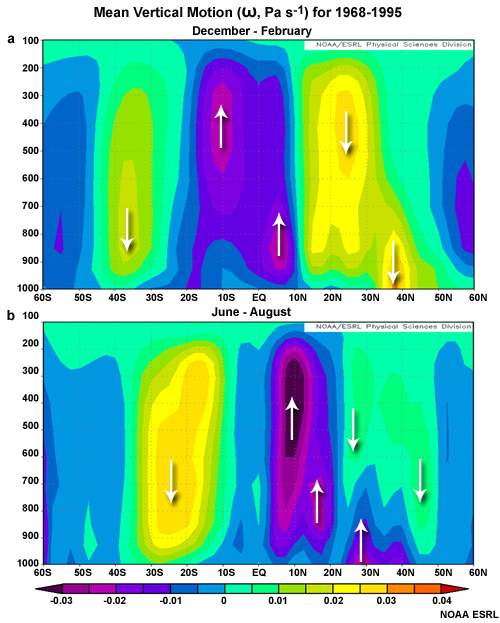
Figure L2-3: Mean vertical motion for December - February (a) and June - August (b), from NCEP Climate Atlas 1968-1995.
Source: COMET, Introduction to Tropical Meteorology, Chapter 3: Global Circulation.
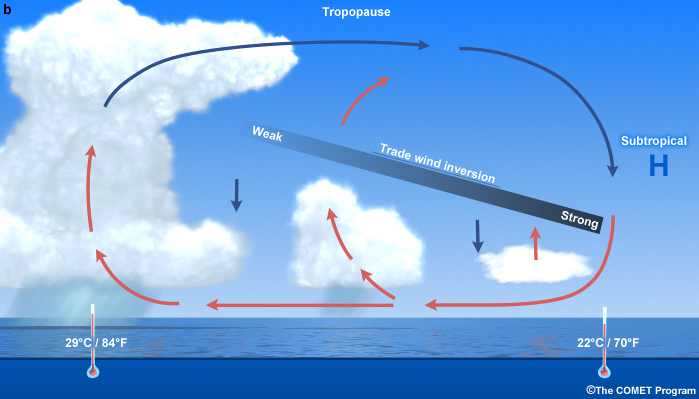
Figure L2-4: Vertical profile of the trade wind inversion from the subtropical high to the ITCZ.
Source: COMET, Introduction to Tropical Meteorology, Chapter 1: Introduction.
In Fig. L2-4 you can see that the influence of the trade wind inversion on the vertical extent of the convective clouds. The ITCZ appears in the following satellite images as a band of cloud clusters with thunderstorms. Between the areas with strong convection there are zones with less weather activity.
Weather situation on 8 November 2014
The Polarstern was sailing in the southern part of the northeastern trade winds and very close to the intertropical convergence zone. Figure L2-5's top half shows a Severe Storms RGB where the yellow dots suggest strong convection due to small ice particles at the cloud tops. The instability is strong enough to generate a thunderstorm near the Polarstern's position at 12:00 UTC. The position of the vessel and the thunderstorm are marked with a white arrow in the small detail square at the top right. You will find a brief description about the colors around the Polarstern's position in the Colour Interpretation Guide.
http://www.eumetrain.org/resources/MSG_severestorm_yellow_cloud.html
The bottom half of Fig. L2-5 shows the same situation in the Dust RGB.
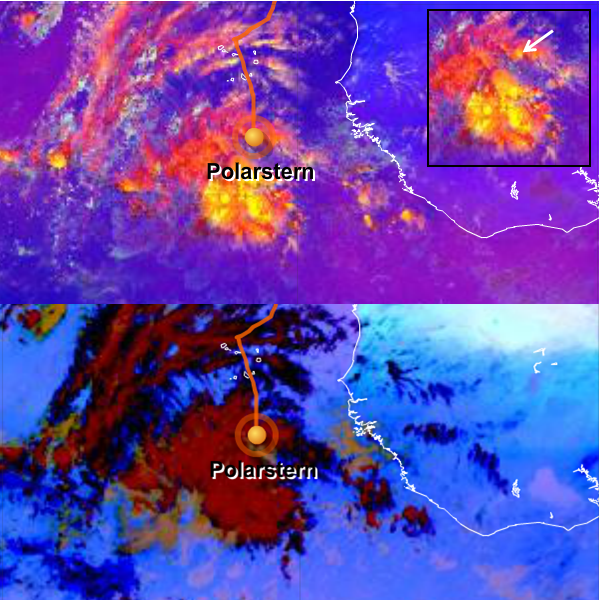
Figure L2-5: 8 Nov 2014, 12:00 UTC. Above: Severe Storms RGB. Below: Dust RGB. Source: EUMeTrain.
High opaque clouds appear red in the Dust RGB. A more detailed explanation of each component color's contribution to this red appearance can be found in the Colour Interpretation Guide:
http://www.eumetrain.org/resources/MSG_dust_red_clouds.html
As a point of contrast between the two images, only the Severe Storms RGB shows the active convective parts of the ITCZ.
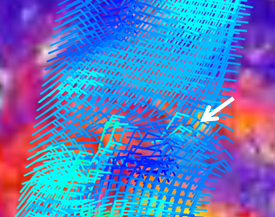
Figure L2-6: 8 Nov 2014, 12:00 UTC, Severe Storms RGB, ASCAT wind vector. Source: EUMeTrain.
Fig. L2-6 shows the scatterometer winds from ASCAT, an instrument onboard the polar satellite MetOp. The figure depicts the wind vector field at the sea surface attained by measuring the radar backscatter signal. Because of its wavelength (5 cm) the signal of ASCAT is not too affected by rain. You can see that the general wind direction is NNE/NE but in the vicinity of the thunderstorms the direction varies from N to E.
If you are interested in a closer look at the ASCAT data and the fundamentals of the instrument, see the list of links at the end of this logbook entry.
The 12:00 UTC SYNOP measurement shows a wind direction and speed of 60° / 07 knots, a thunderstorm with light or moderate rain and 7/8 Cumulonimbus capillatus. DBLK is the Polarstern's call sign.
DBLK 08121 99107 70230 11396 80607 10240 20221 40155 51019 6///1 79522 879//
22242 04283 20301 302// 40803 6//// =
The 12:00 UTC sounding shows this strong lability except in the small trade wind inversion around 1 km. If the inversion disappears, the cumulonimbus clouds could grow up to 150 hPa (ca. 13 km) near the ITCZ.
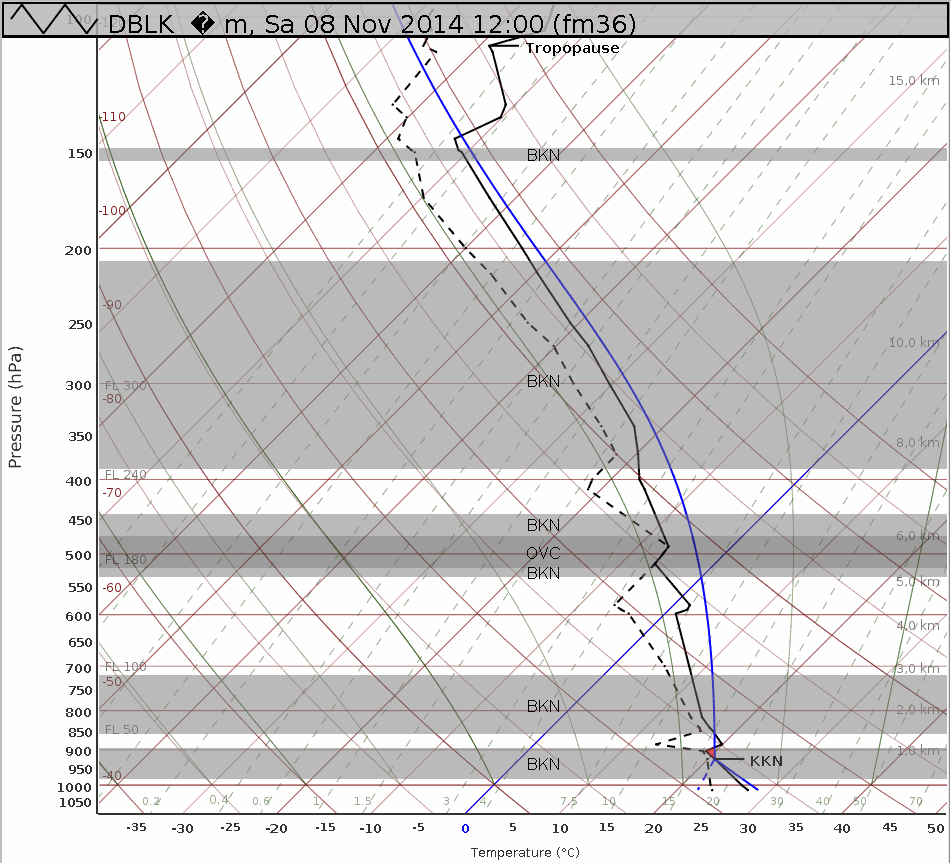
Figure L2-7: Sounding from the Polarstern, 8 Nov 2014, 12:00 UTC. KKN = Lifted condensation level. BKN (broken) = 5/8-7/8 cloud cover in the given layer, OVC (overcast) = 8/8 cloud cover in the given layer. Source: DWD.
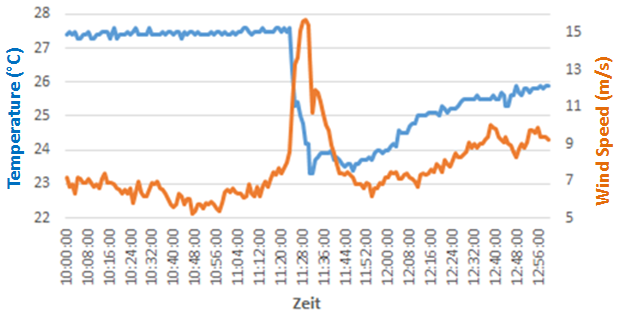
Figure L2-8: Course of temperature and wind speed on 8 Nov 2014 from 10:00 UTC to 12:56 UTC measured on the Polarstern during a thunderstorm. Source: DWD.
In this thunderstorm the temperature falls from 27,5°C to 23,5°C and the wind speed increases briefly to nearly 15 m/s. Because the water temperature is 28,3°C, after the shower the air temperature rises continously up to 26°C by the end of this time frame.
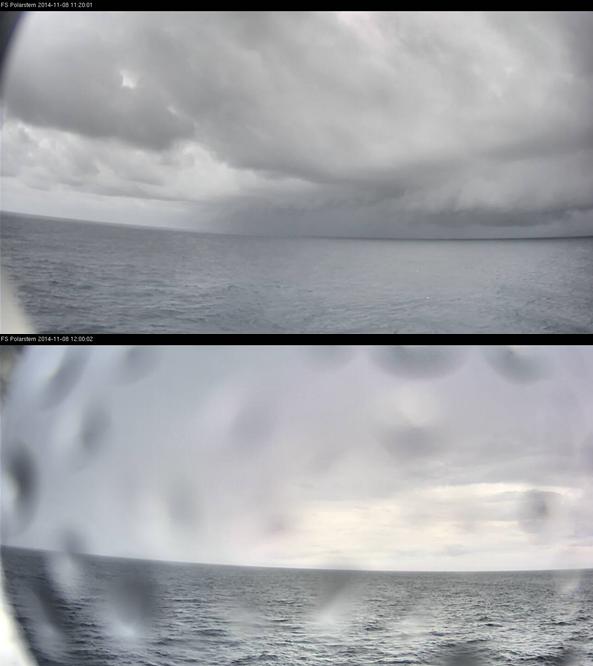
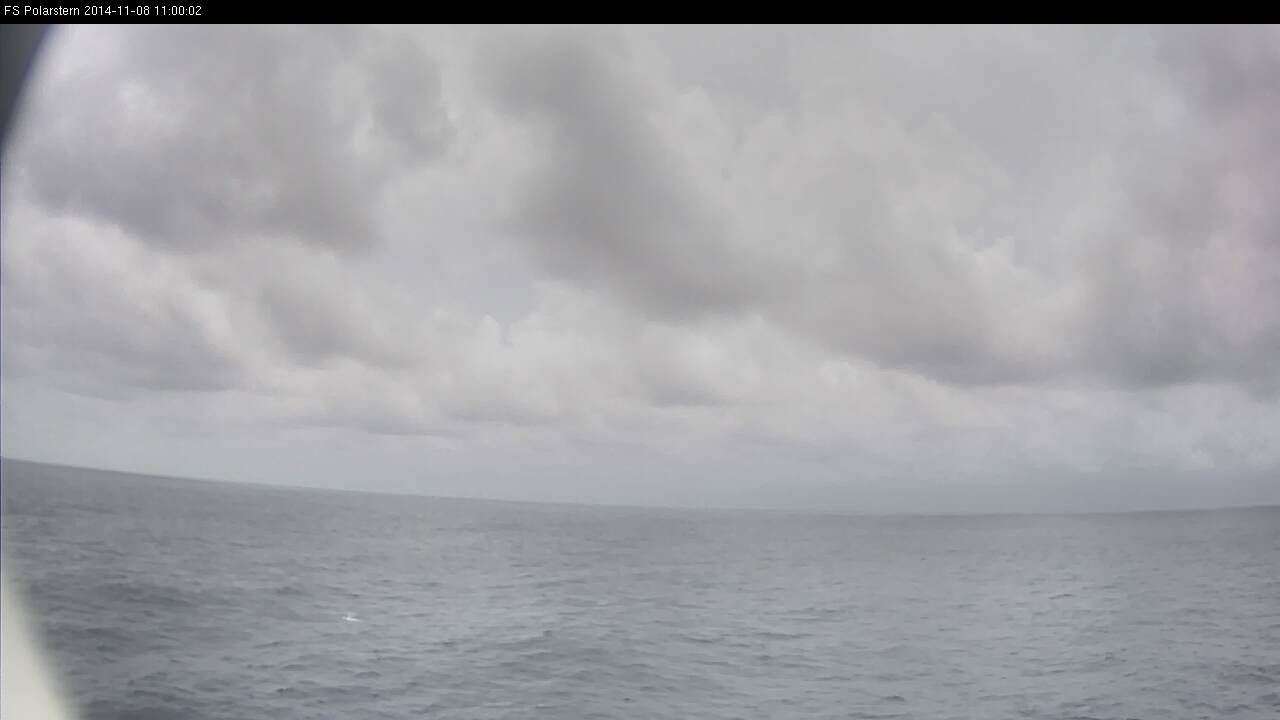
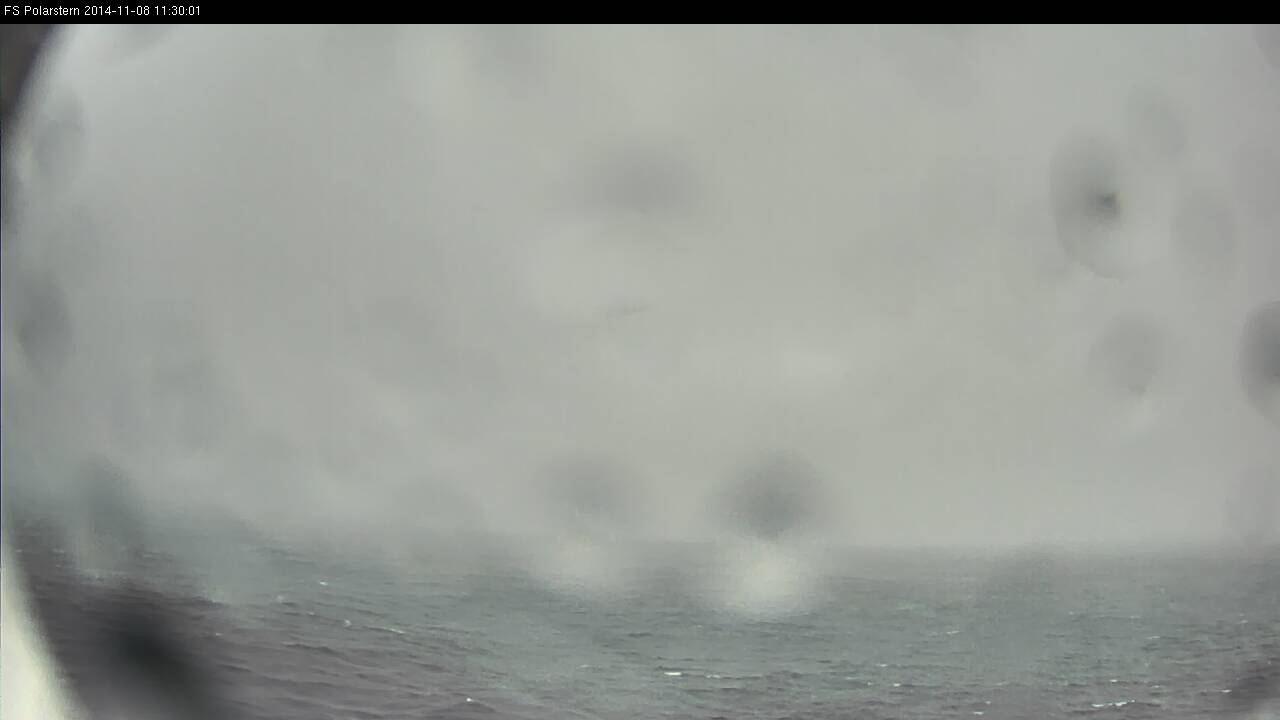
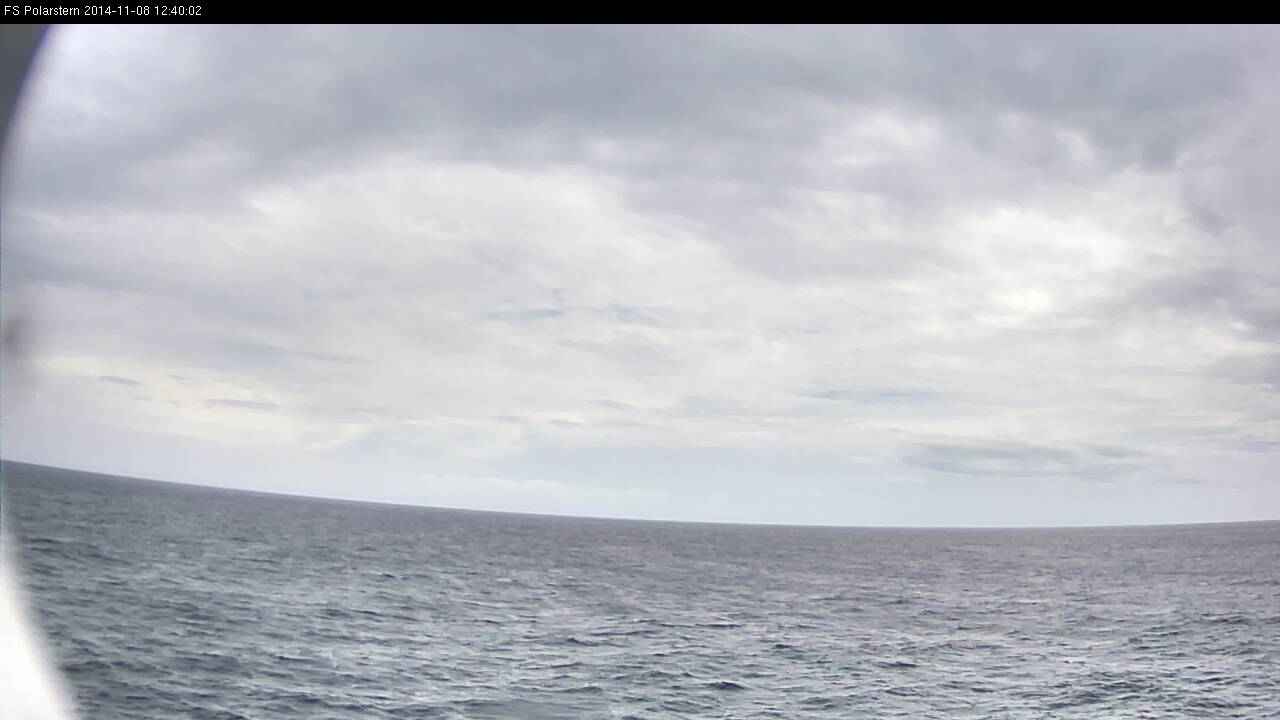
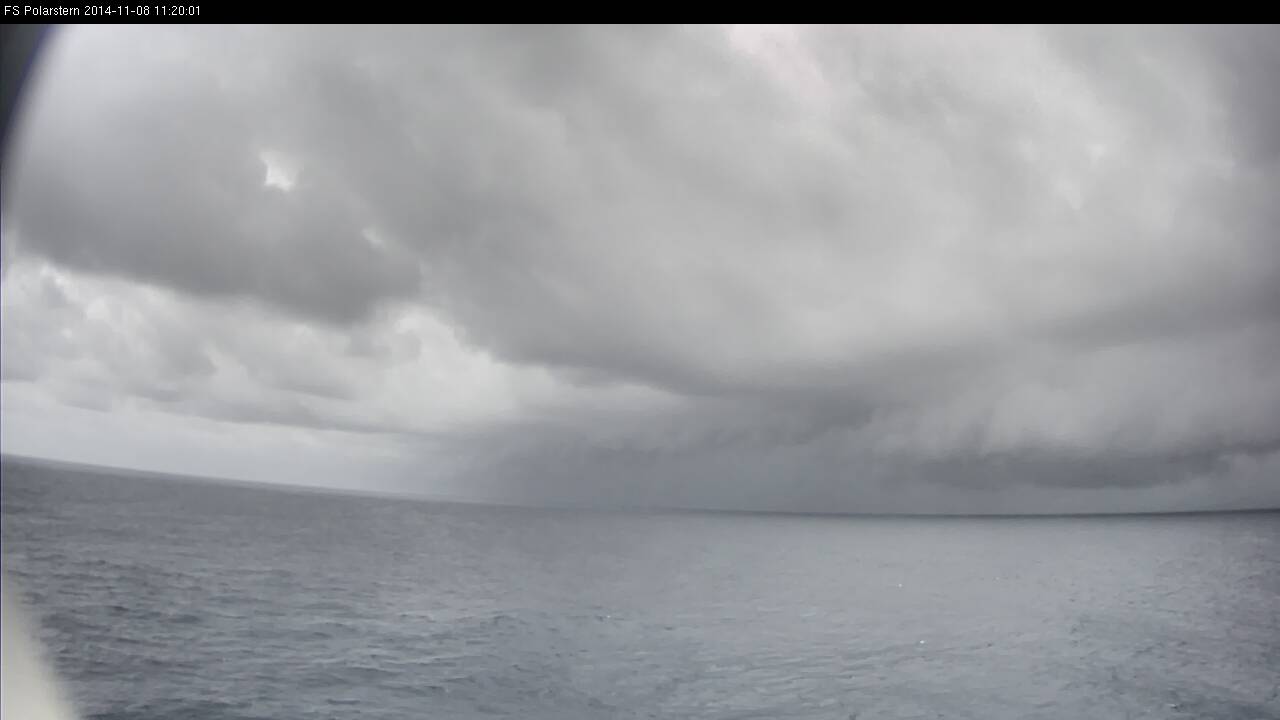
Figure L2-9: Webcam image from 8 Nov 2014 at the beginning and end of the thunderstorm. Source: DWD.
Above: 11:20 UTC with arcus clouds. Below: 12:00 UTC.
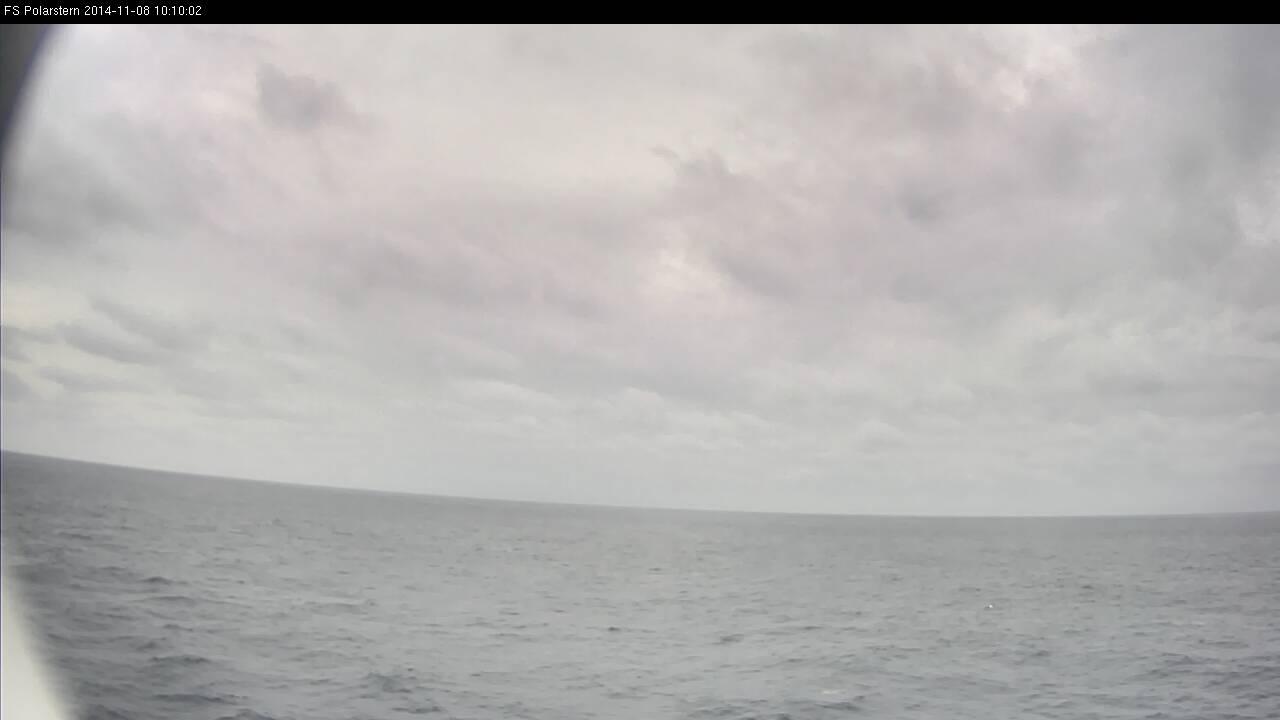
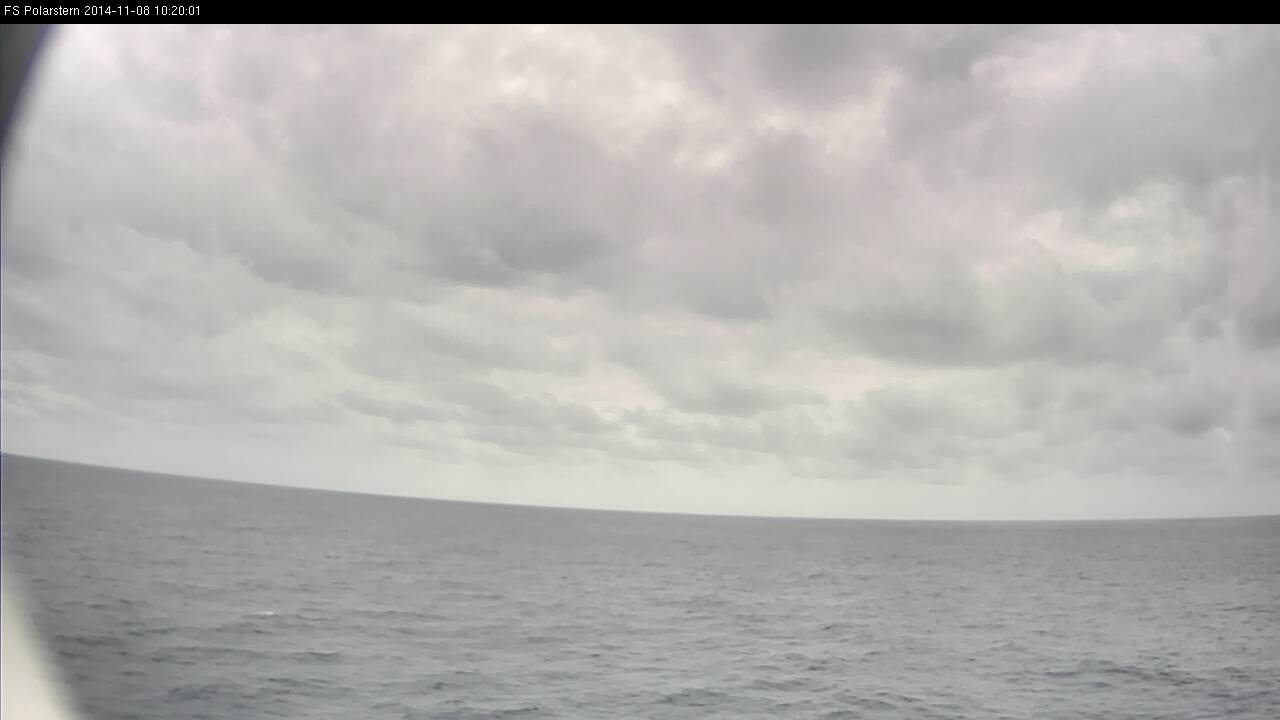
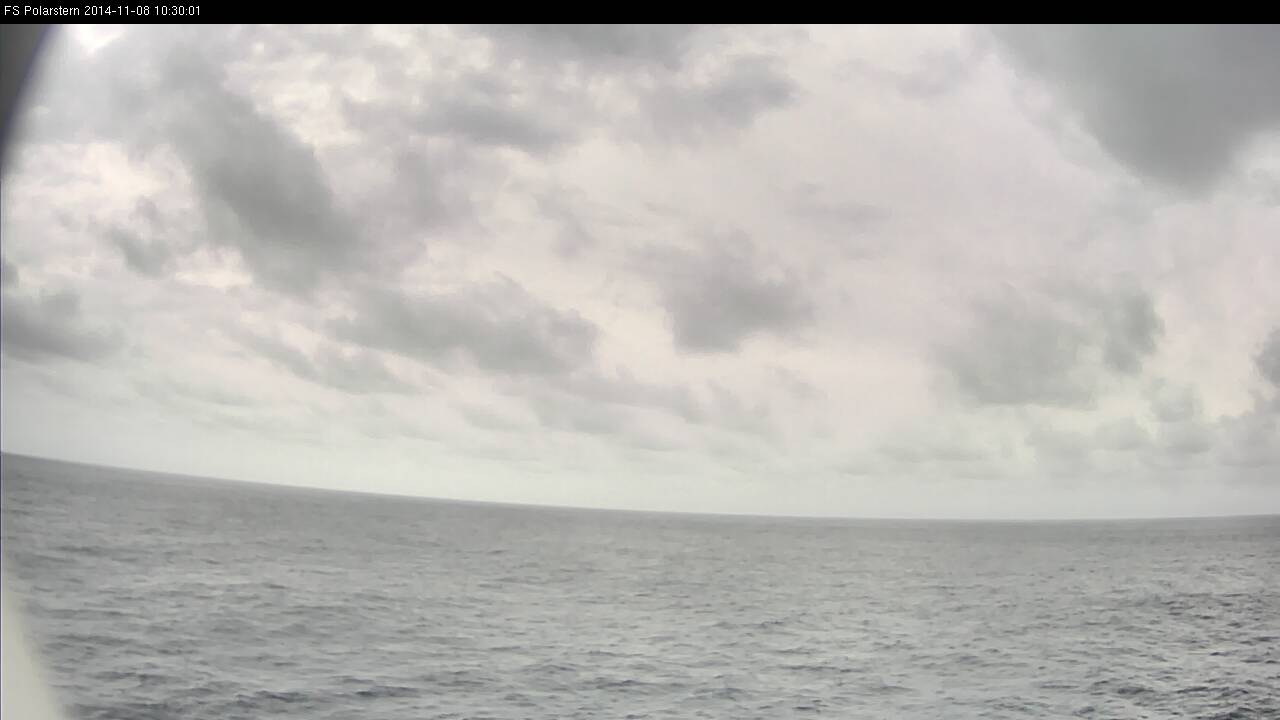
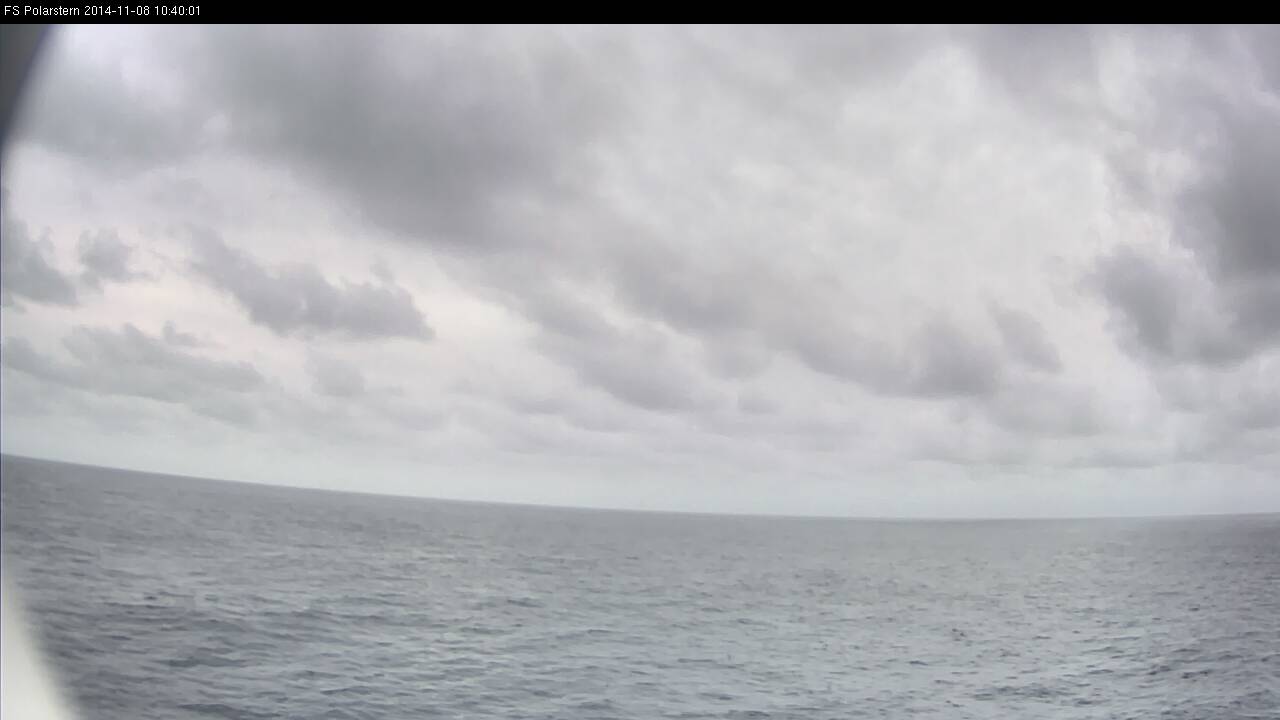
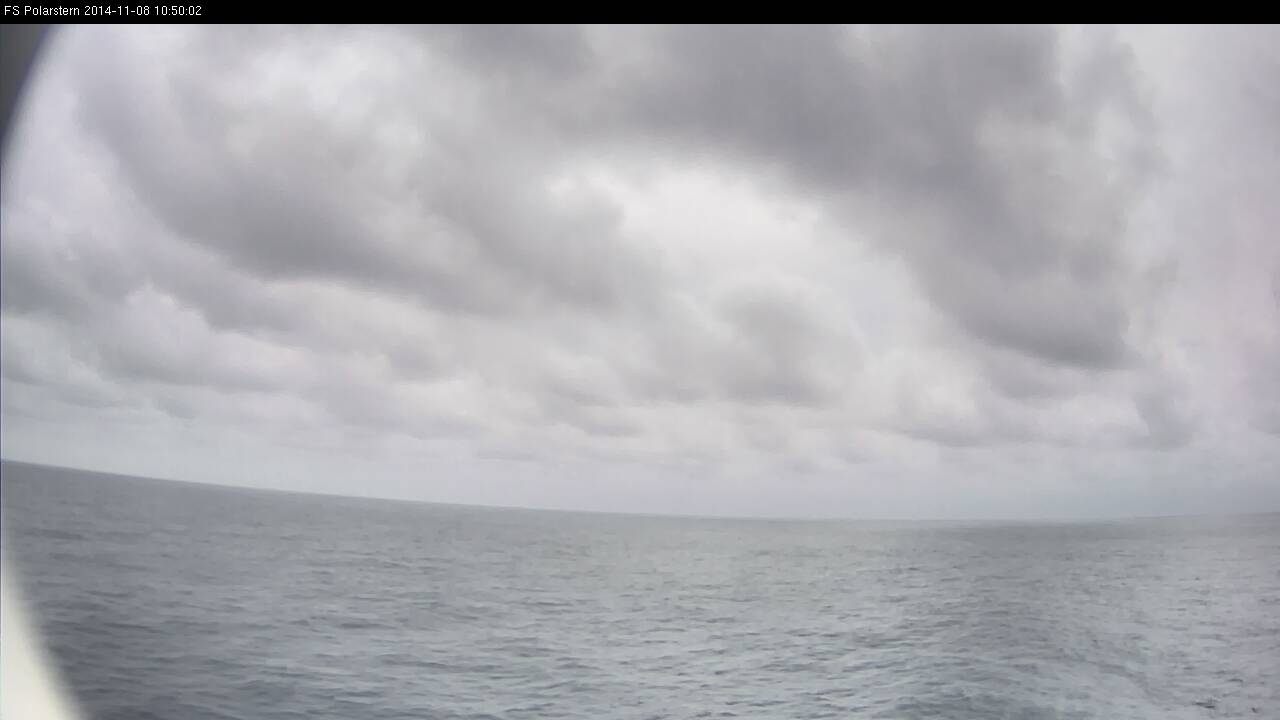
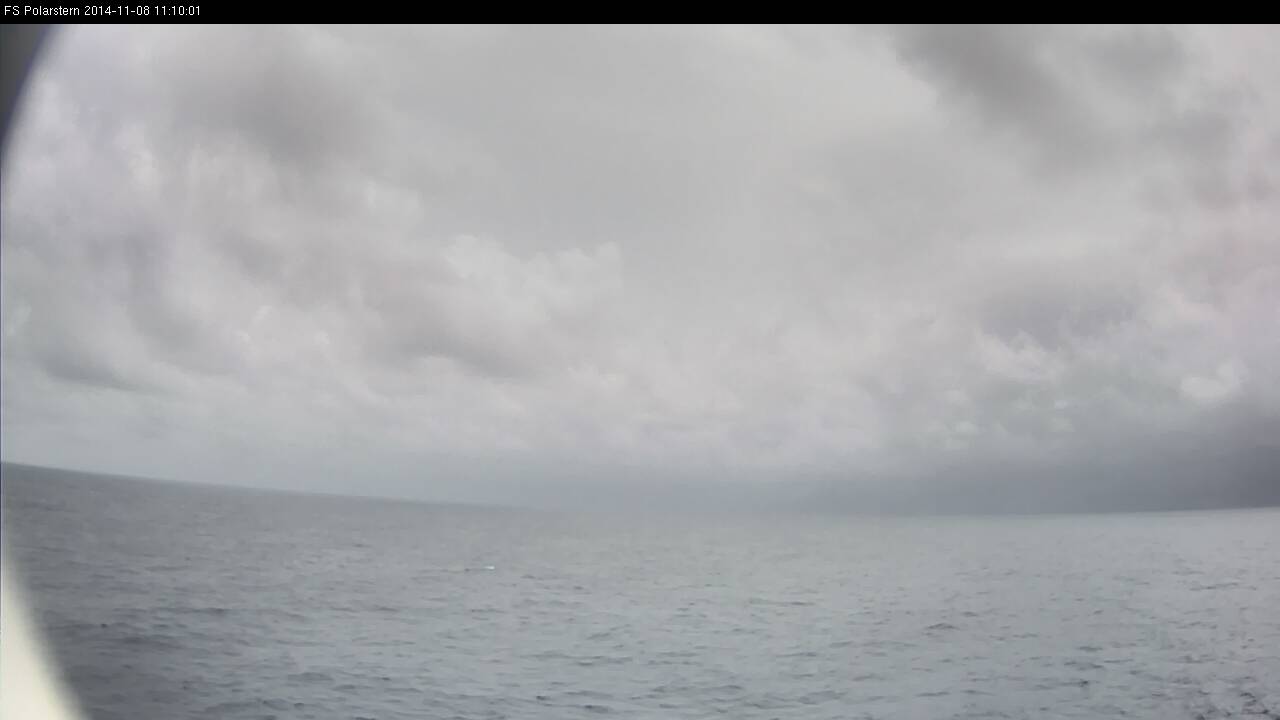
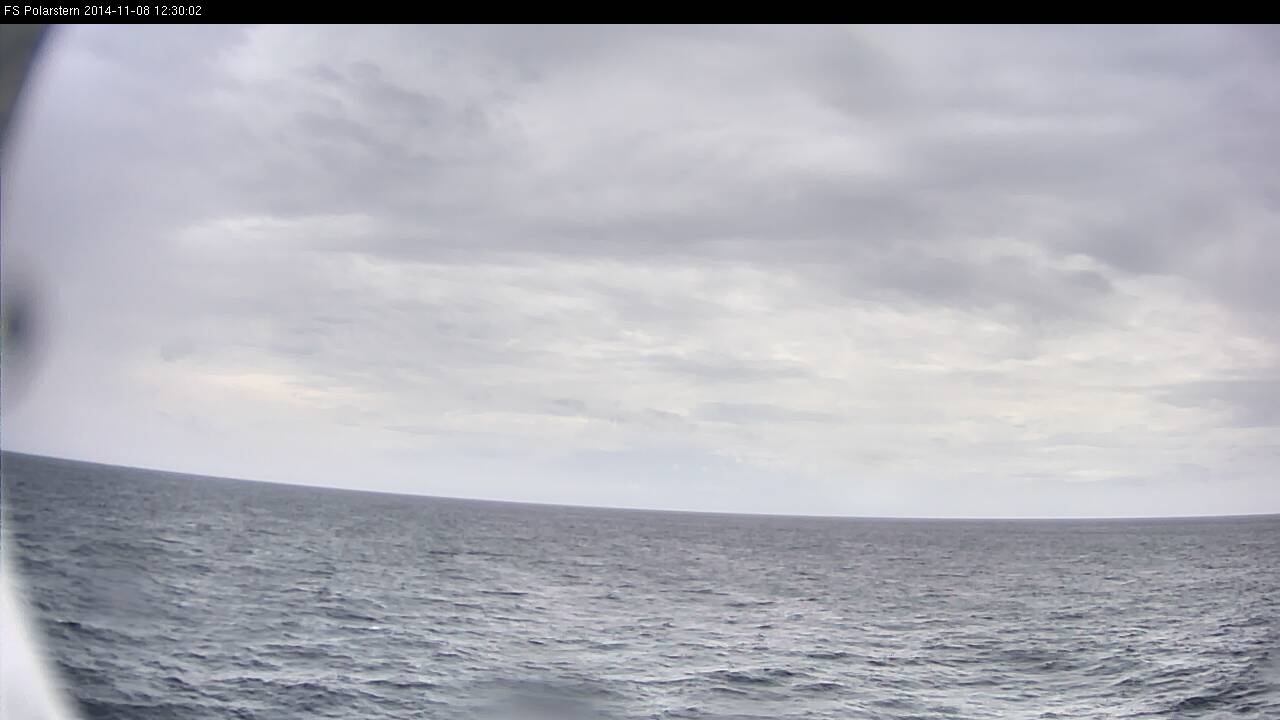
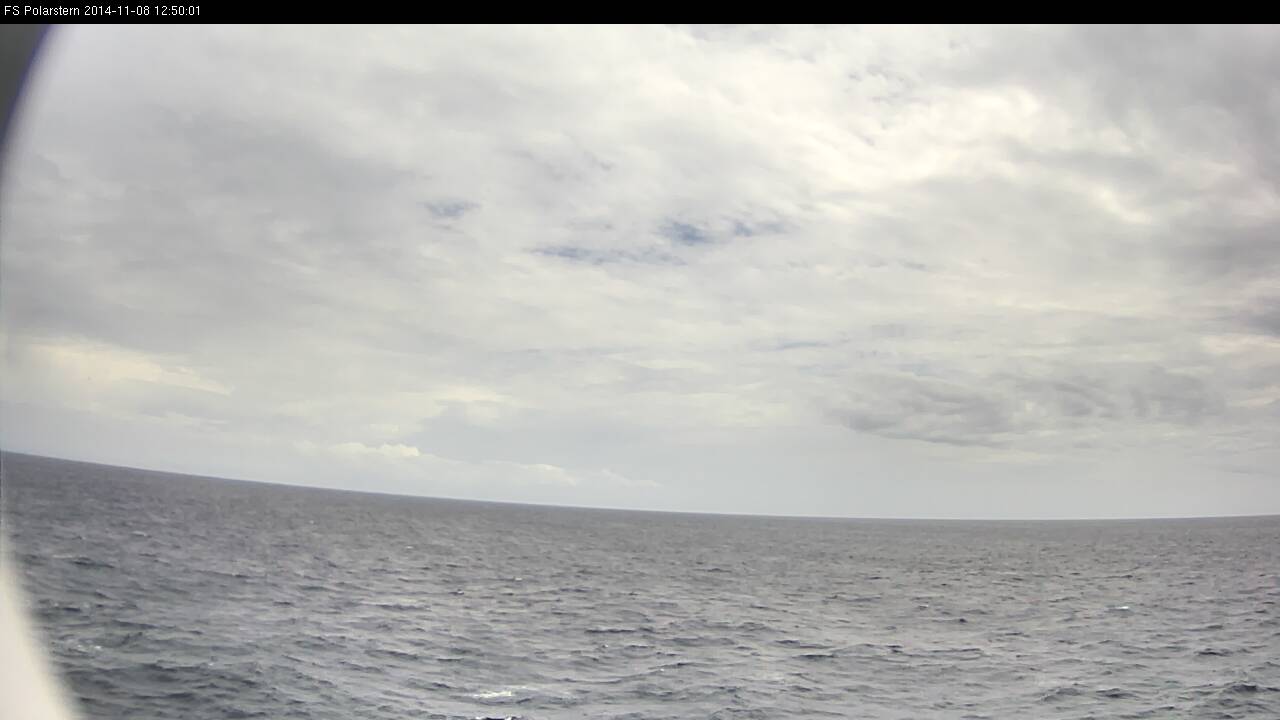
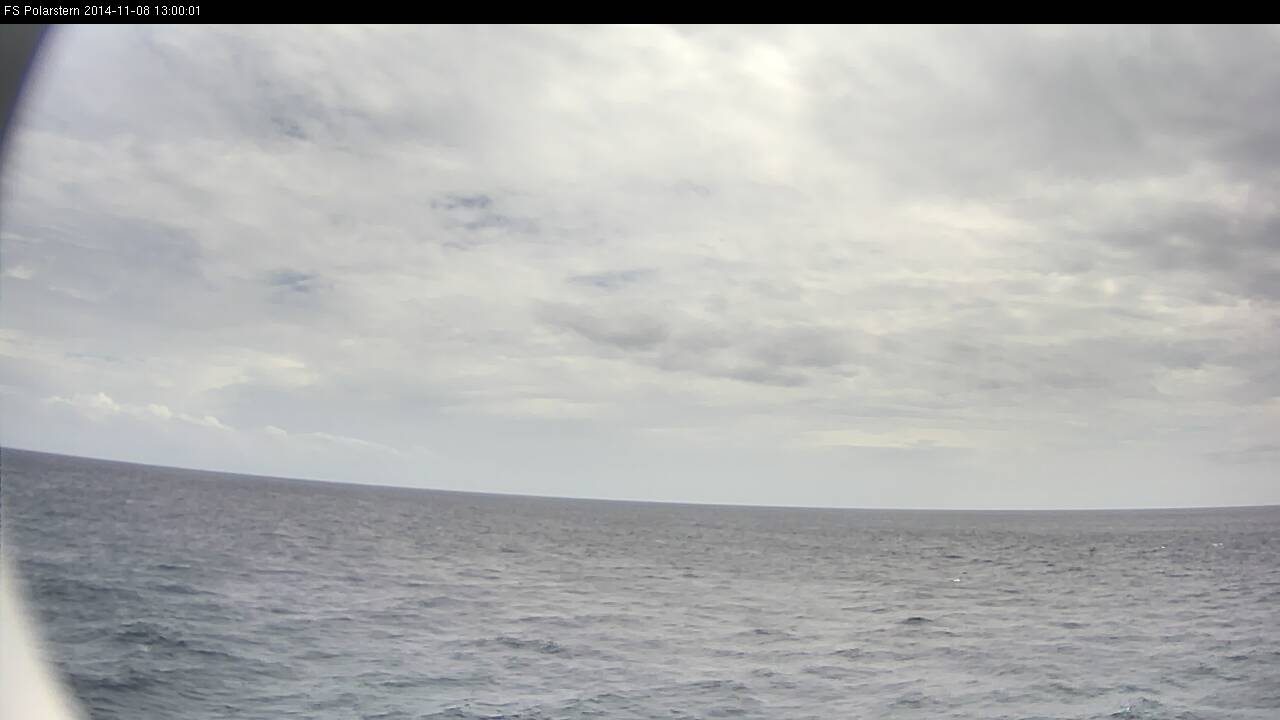
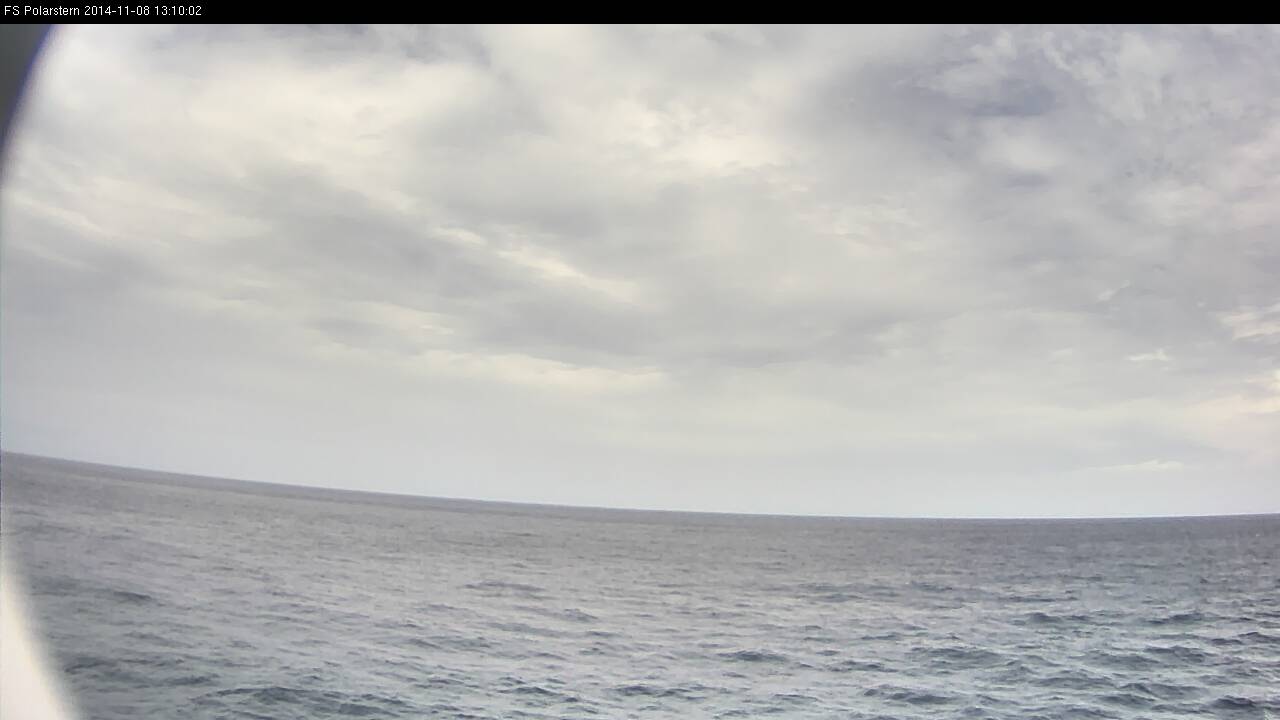
In the following images you can see the approaching cumulonimbus and arcus from the webcam between 11:00 UTC and 13:00 UTC.
Loop 2: Note - click on the loop to go through individual images
In this loop you will see all images taken by the webcam on 8 Nov 2014 between 06:50 UTC and 19:20 UTC.
Loop 3: Note - click on the loop to go through individual images
On that day it was mostly cloudy with stratiform and cumuliform clouds.
You will find more information in modules from COMET, such as "Tropical Severe Local Storms" and "Tropical Mesoscale Convective Systems", in the list of literature at the end of this section.
Weather situation on 9 Nov 2014
The Polarstern is sailing in the ITCZ. The forecaster on that day wrote: "Wind NE to E, 3-4 Bft. Good visibility. Shower or thunderstorms are possible. No significant wind sea, swell NE to E, around 1,5 m and 9 s."
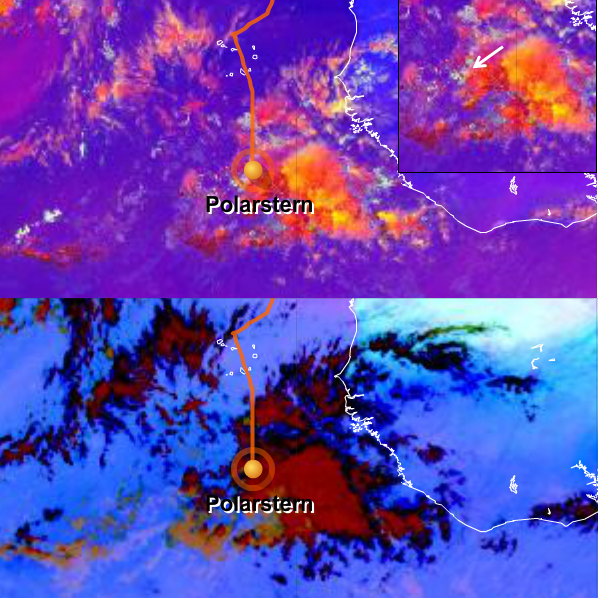
Figure L2-10: 9 Nov 2014, 12:00 UTC. Above: Severe Storms RGB,
Below: Dust RGB. Source: EUMeTrain.
The satellite images show the Polarstern sailing through shower activity in the ITCZ. The strongest convection that day was more to the east, where the yellow color is very bright in the Severe Storms RGB (see the white arrow for the exact position of the Polarstern). The yellow color suggests small ice particles at the top of the cumulonimbus and a strong updraft. For more details see the Colour Interpretation Guide:
http://www.eumetrain.org/resources/MSG_severestorm_yellow_cloud.html
The black cloud areas in the Dust RGB hint at high and thick cirrus clouds since there is a lack of signal in all three color components. You will find a short description and clear images of these clouds in the Dust RGB in the Colour Interpretation Guide:
http://www.eumetrain.org/resources/MSG_dust_black_cirrus.html
|
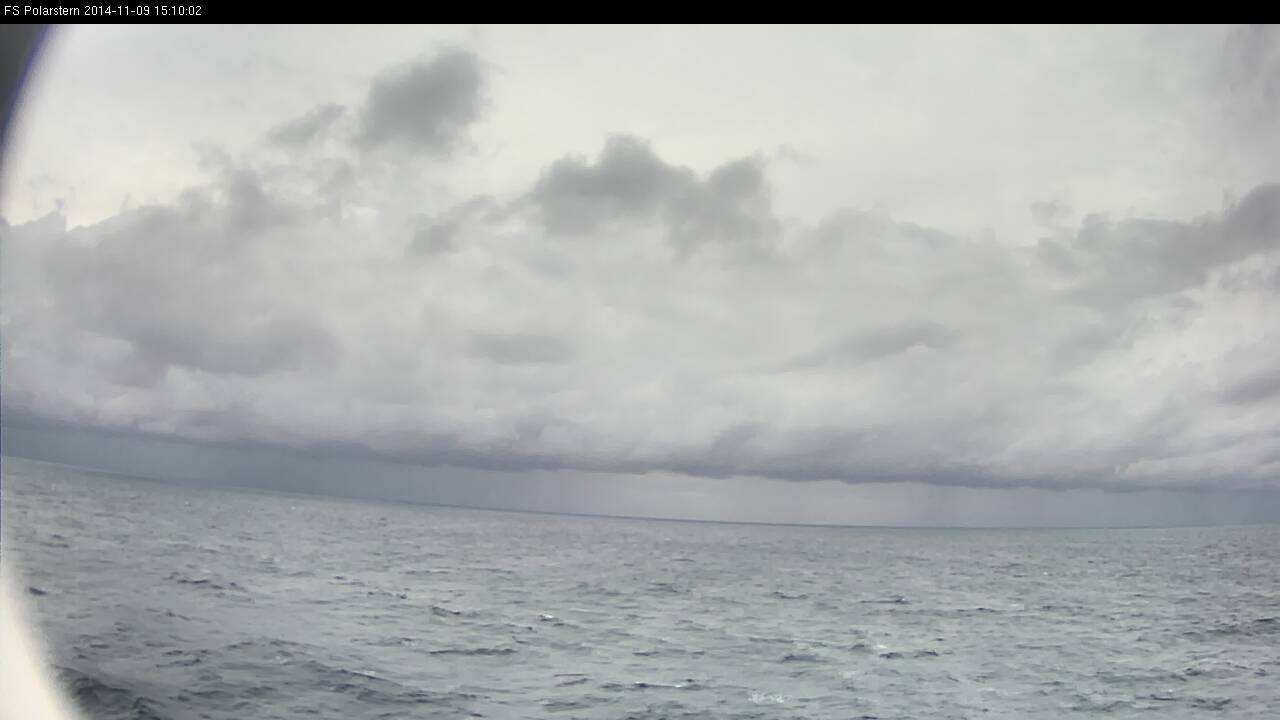
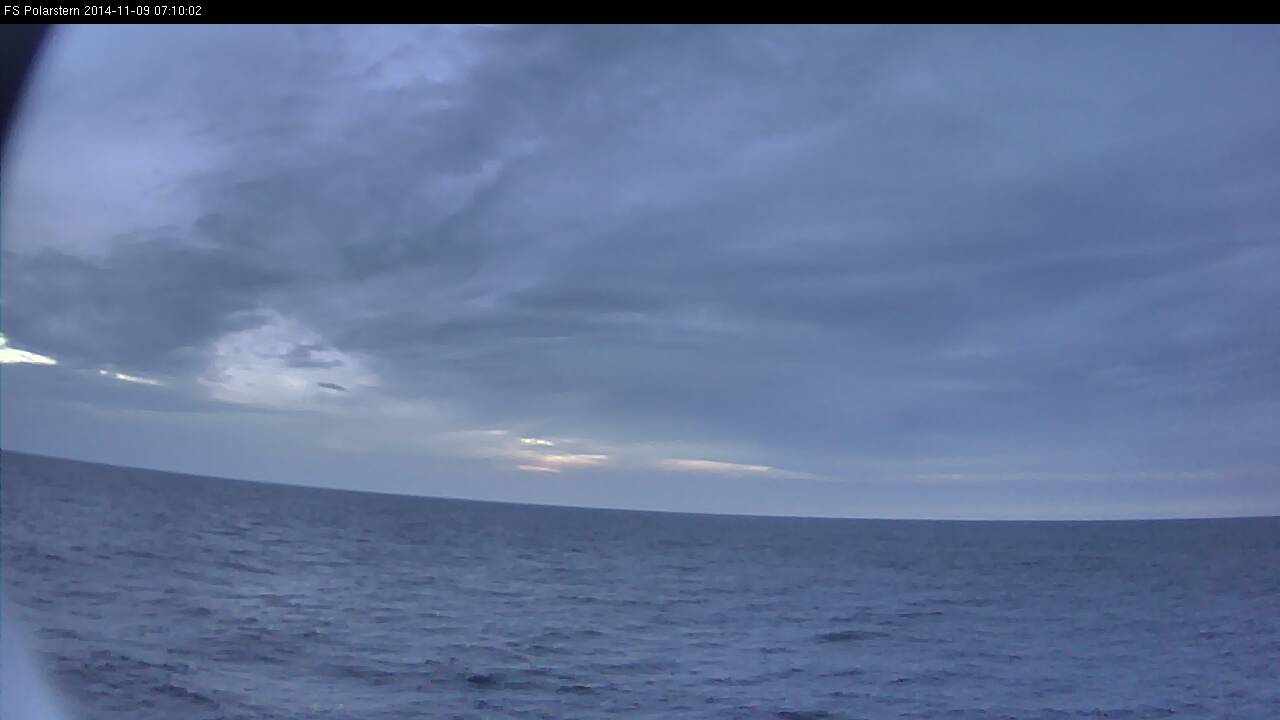
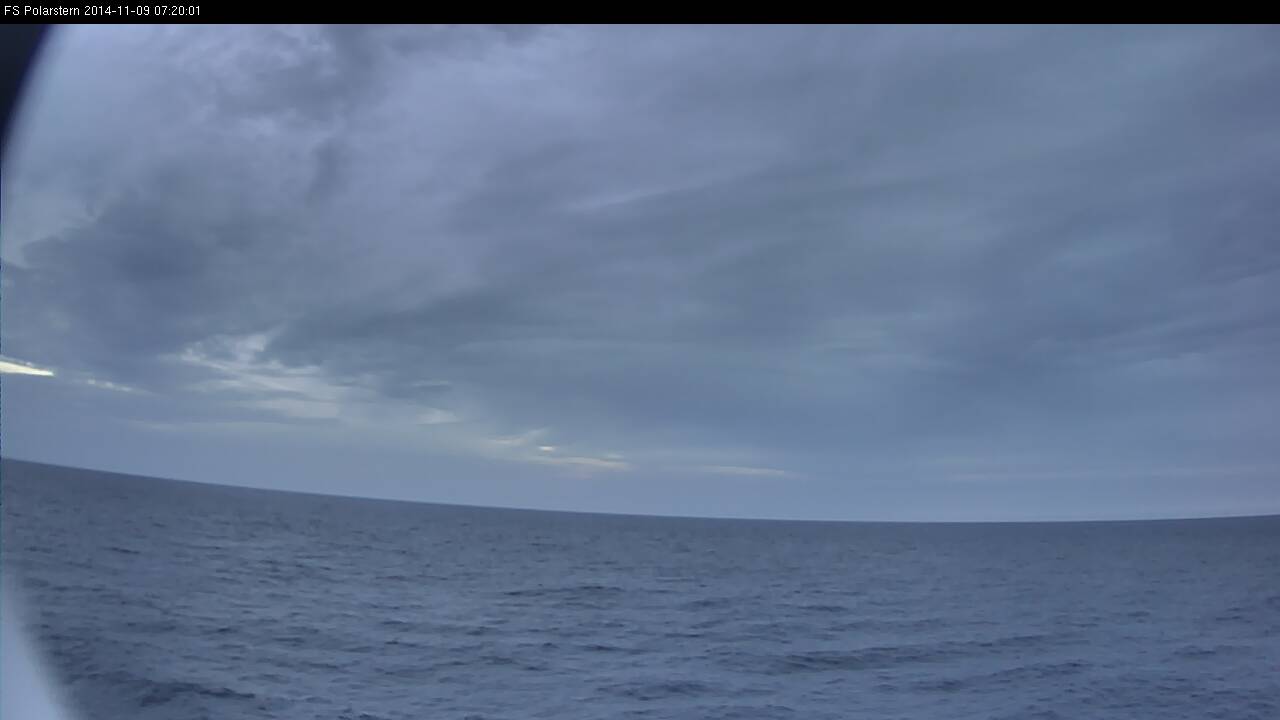
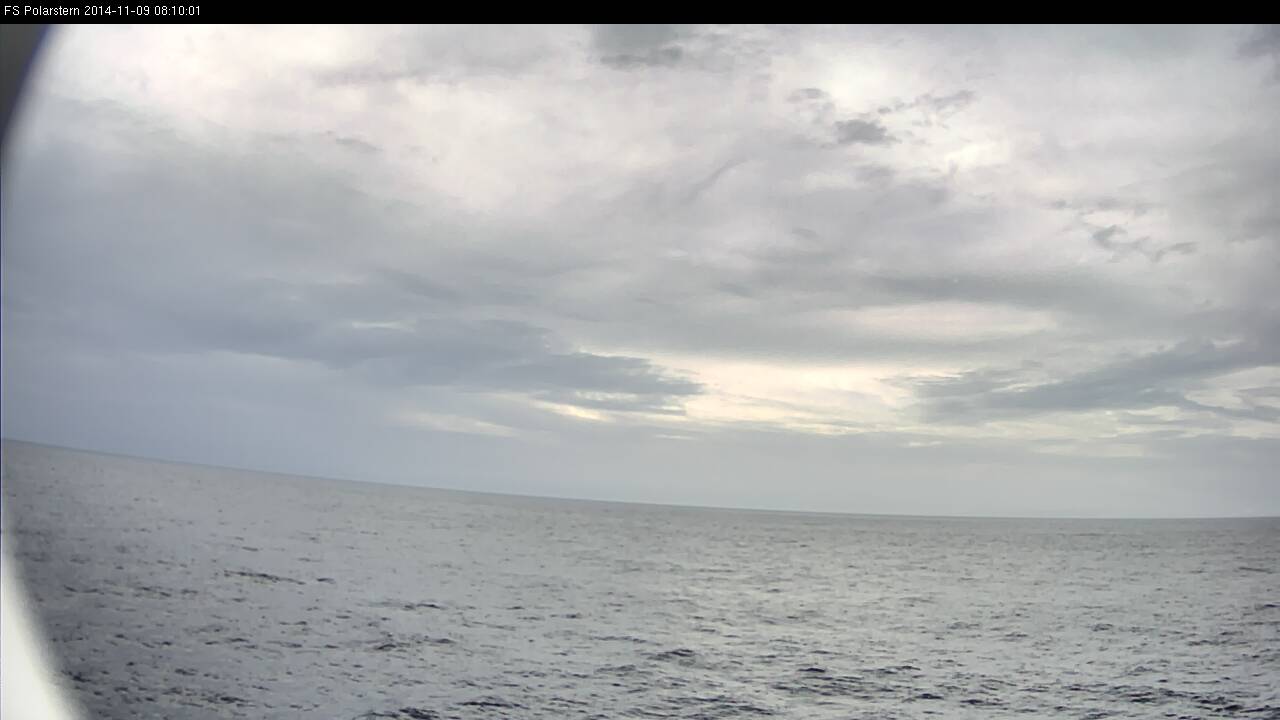
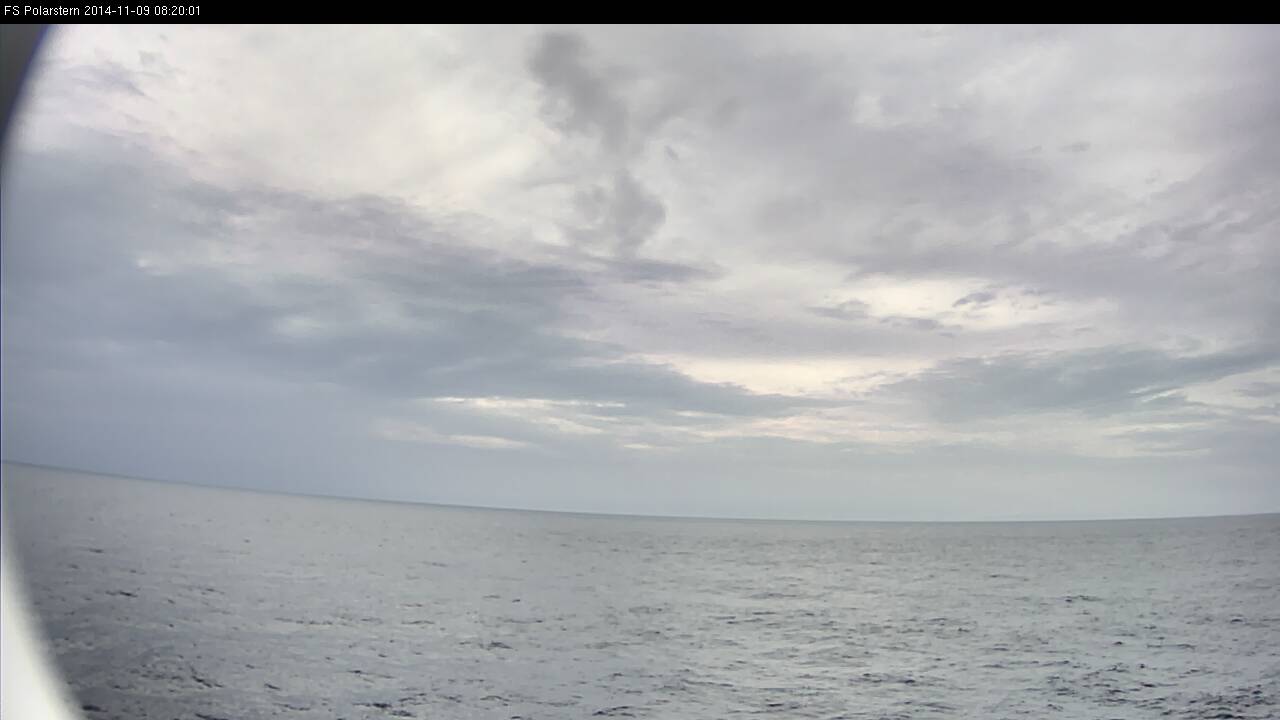
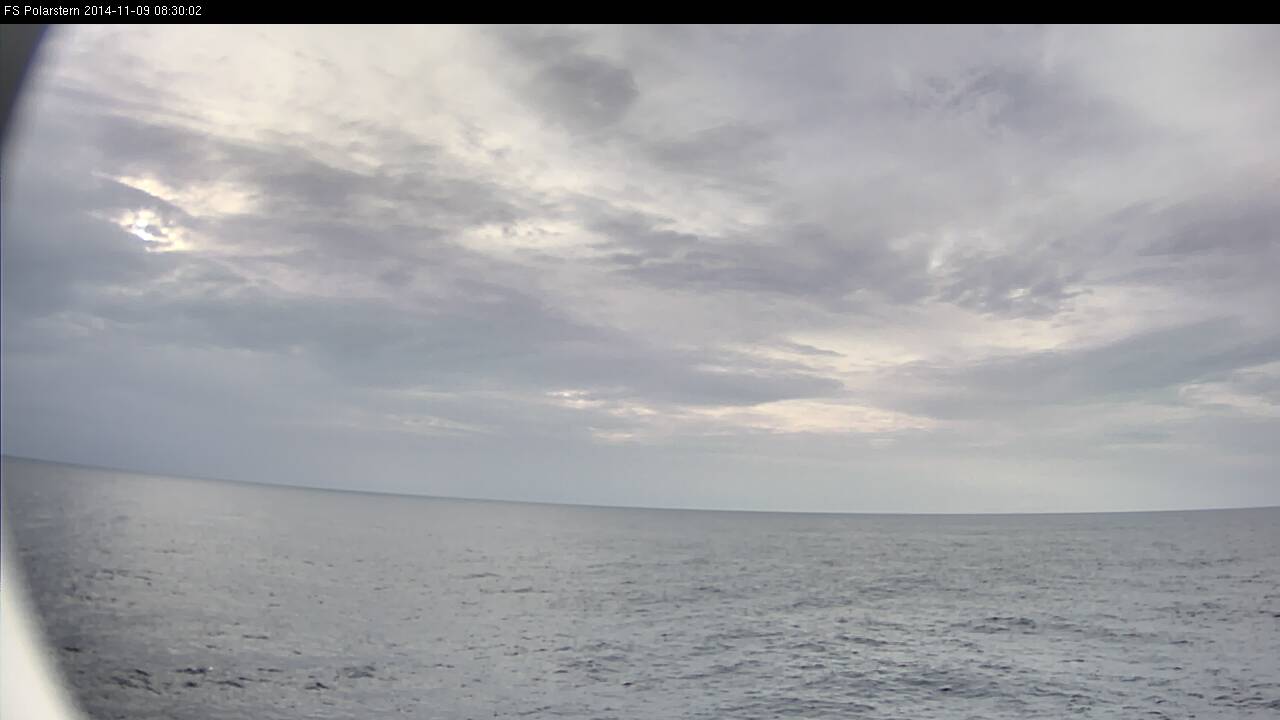
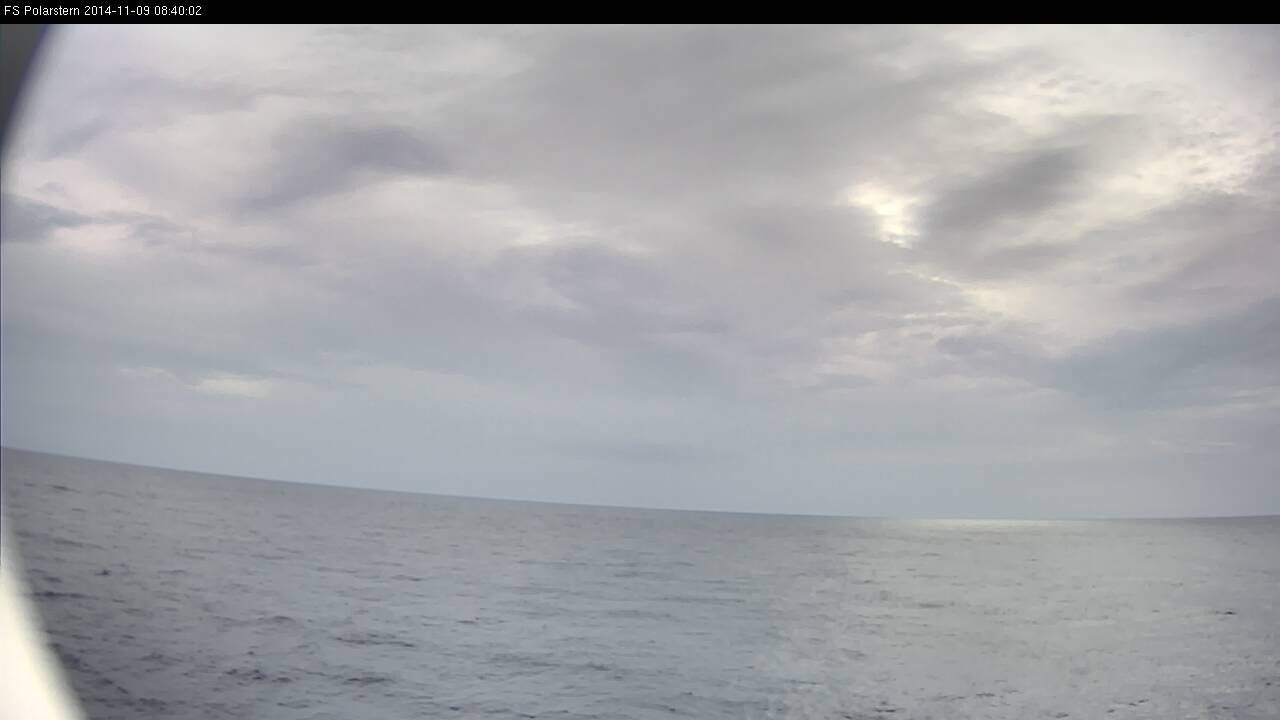
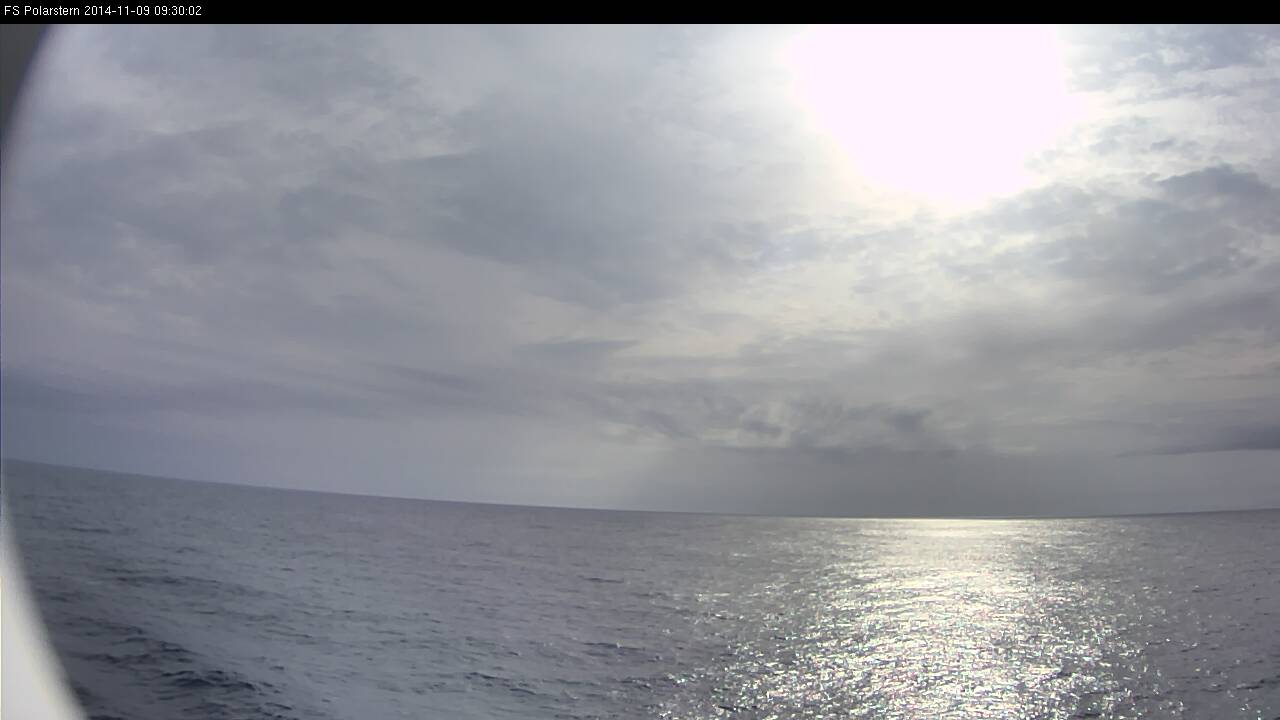
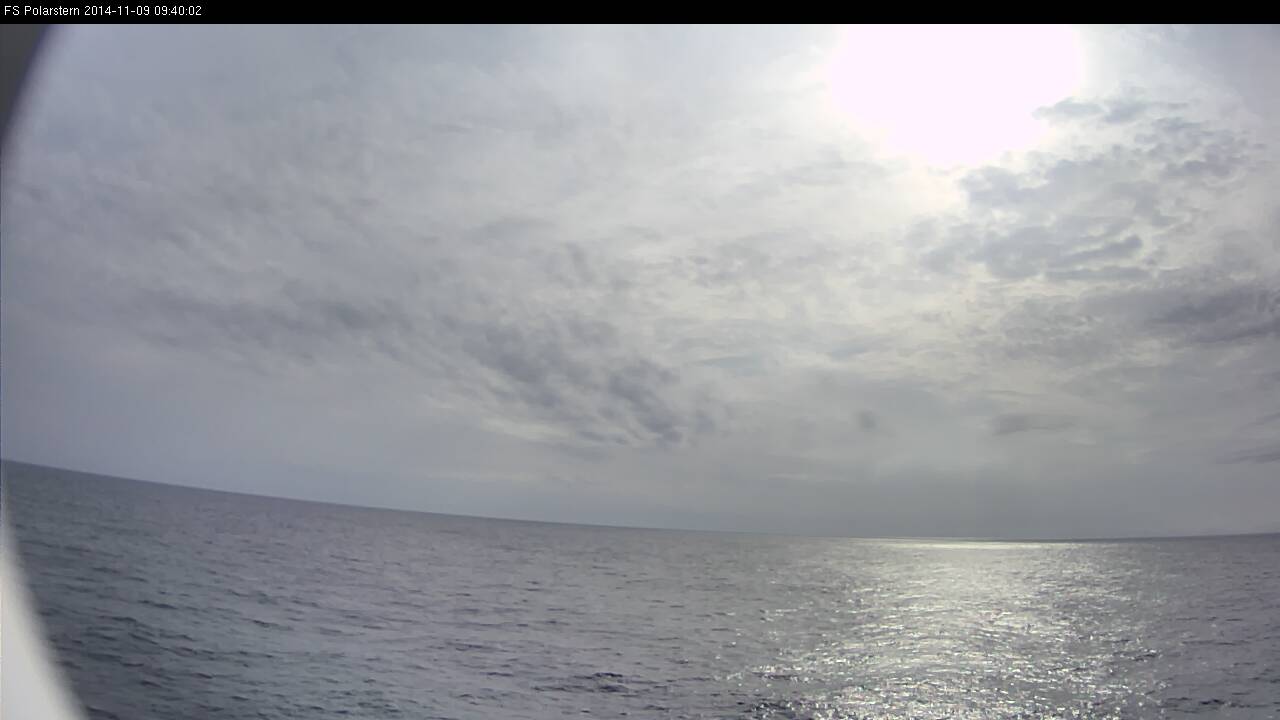
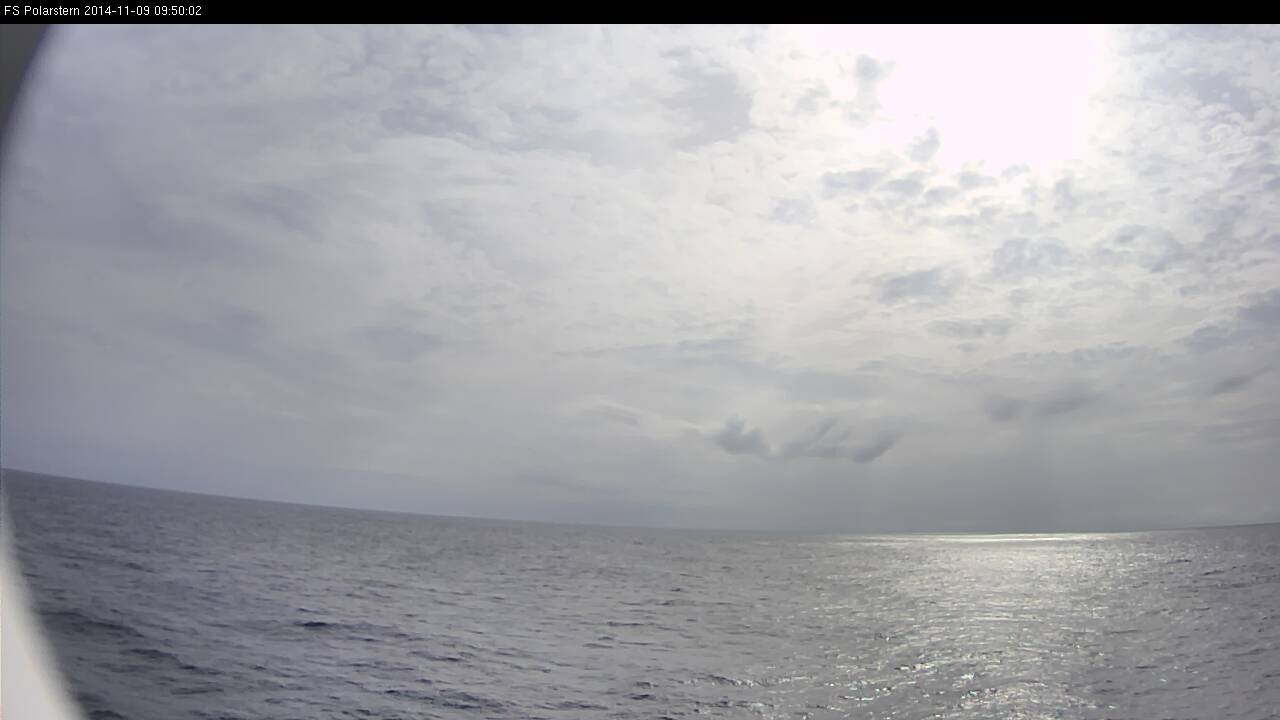
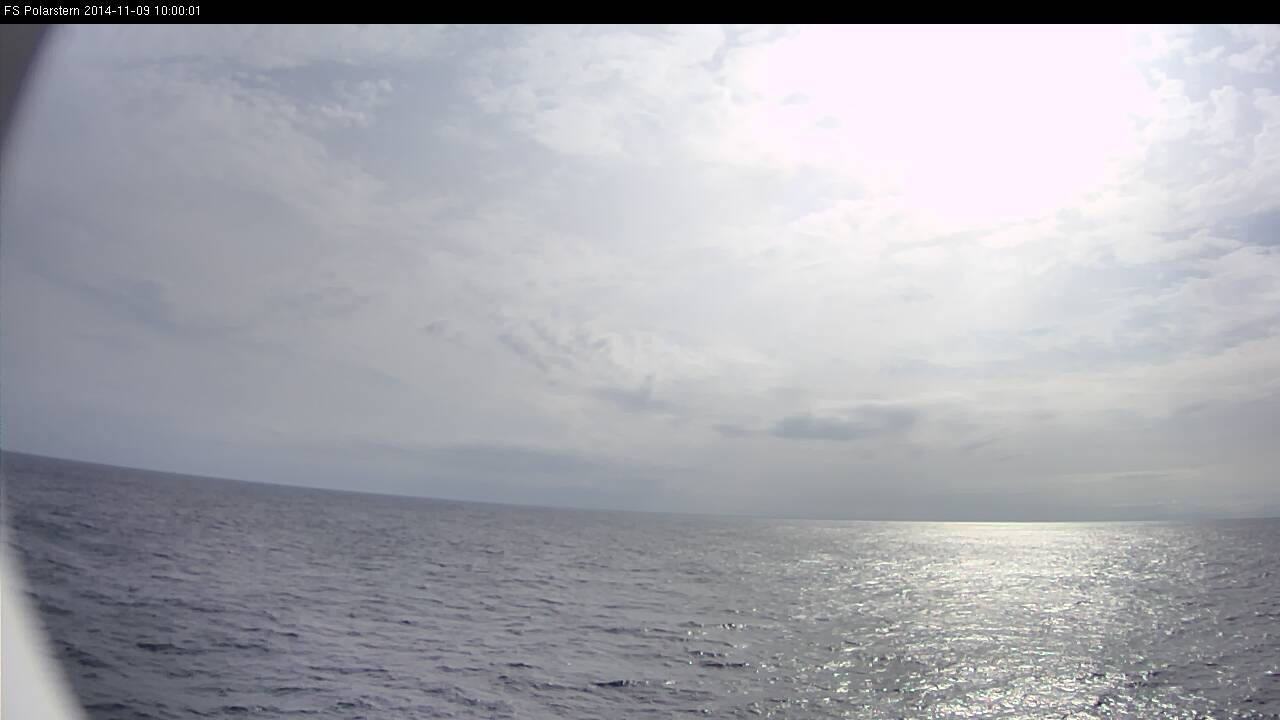
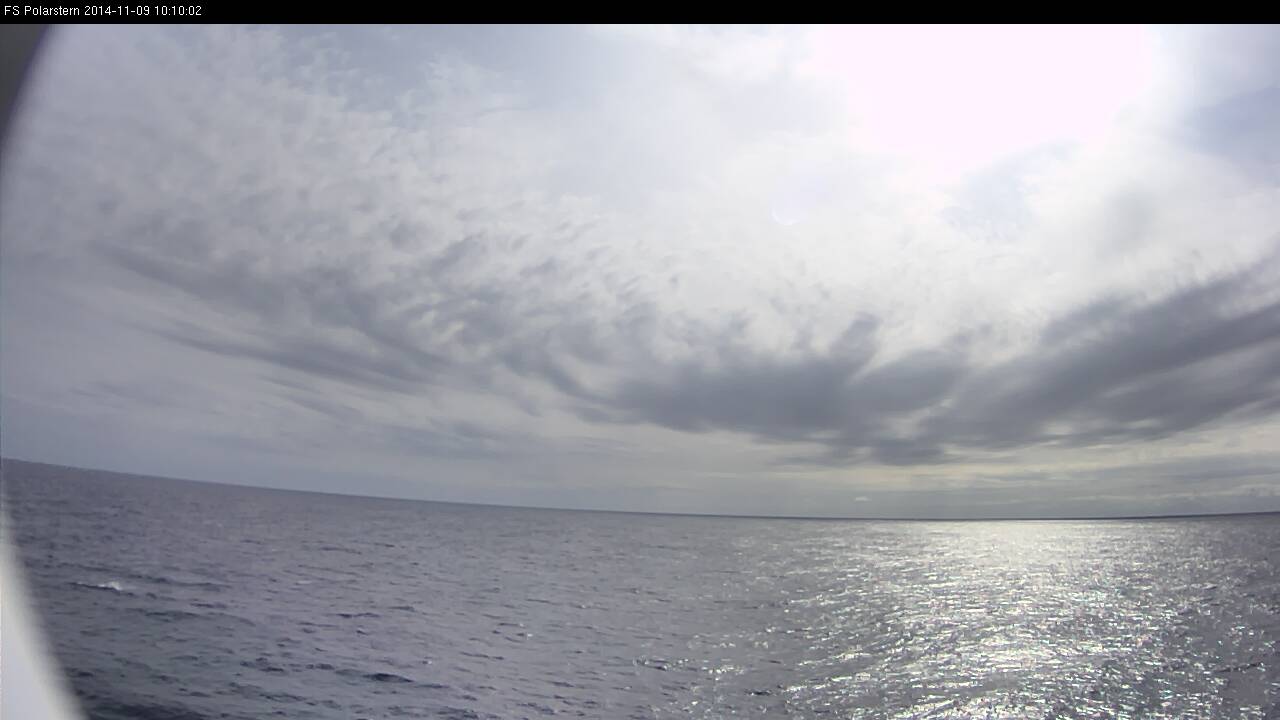
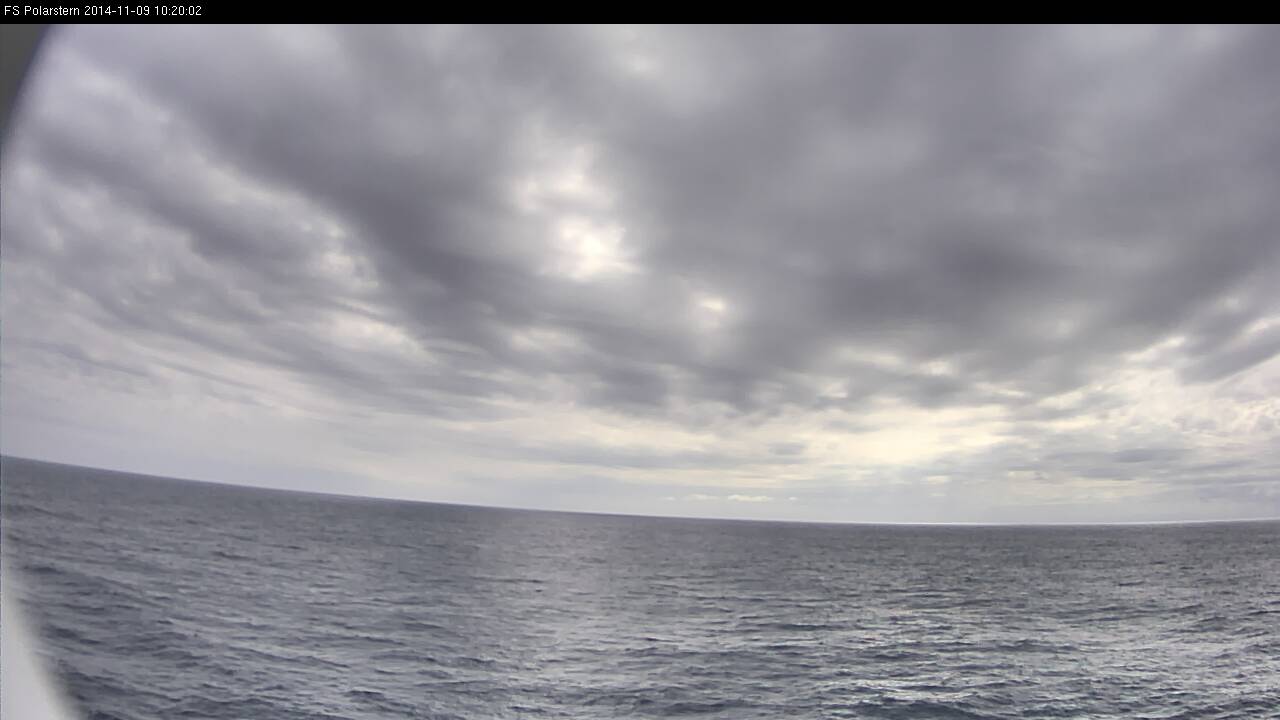
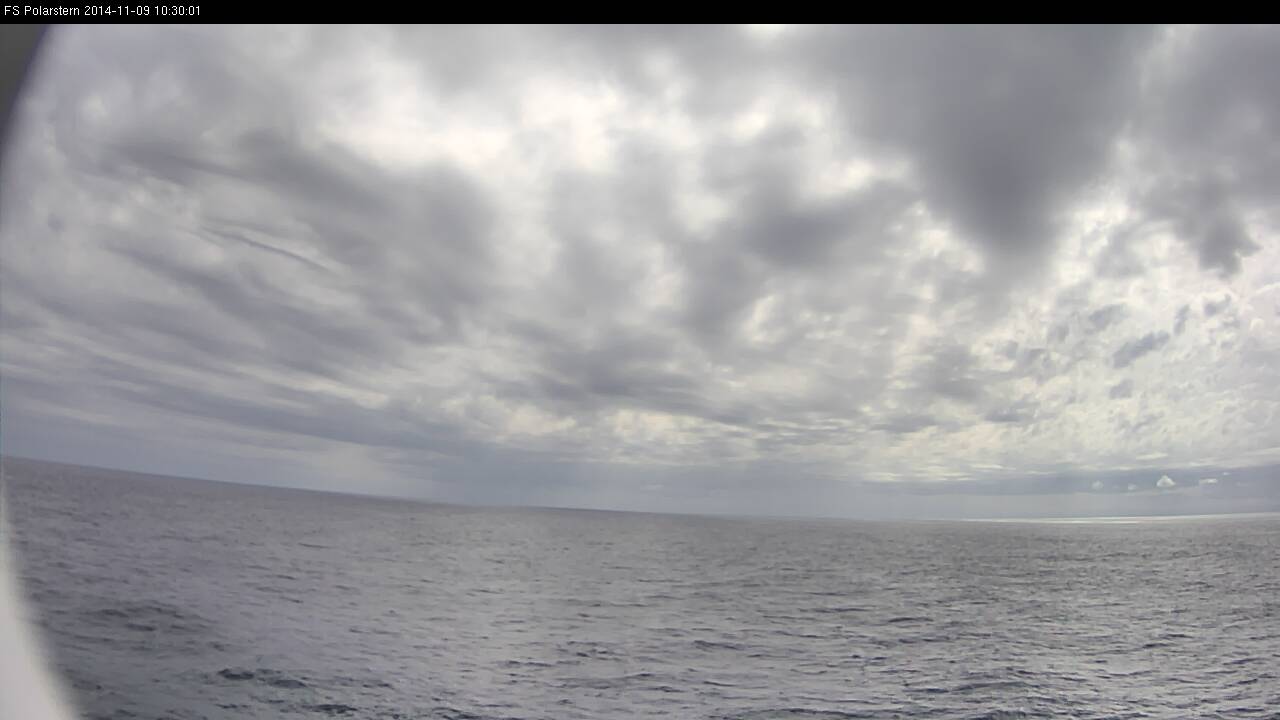
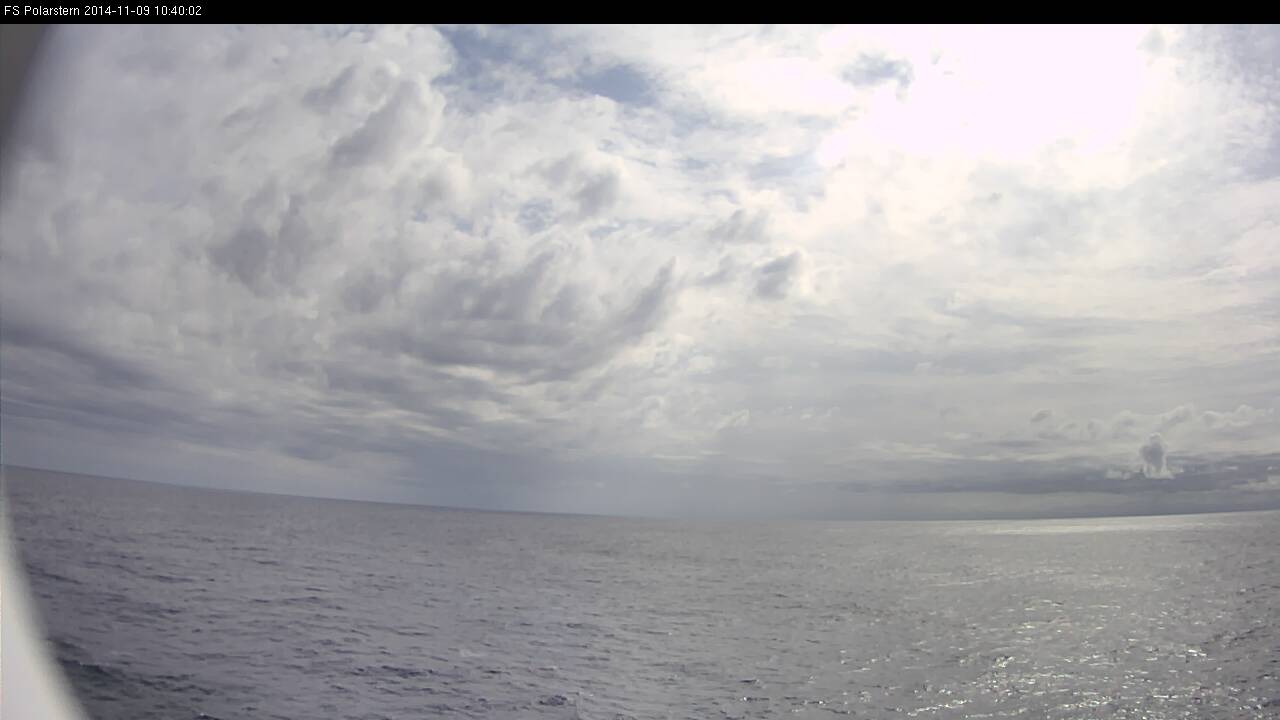
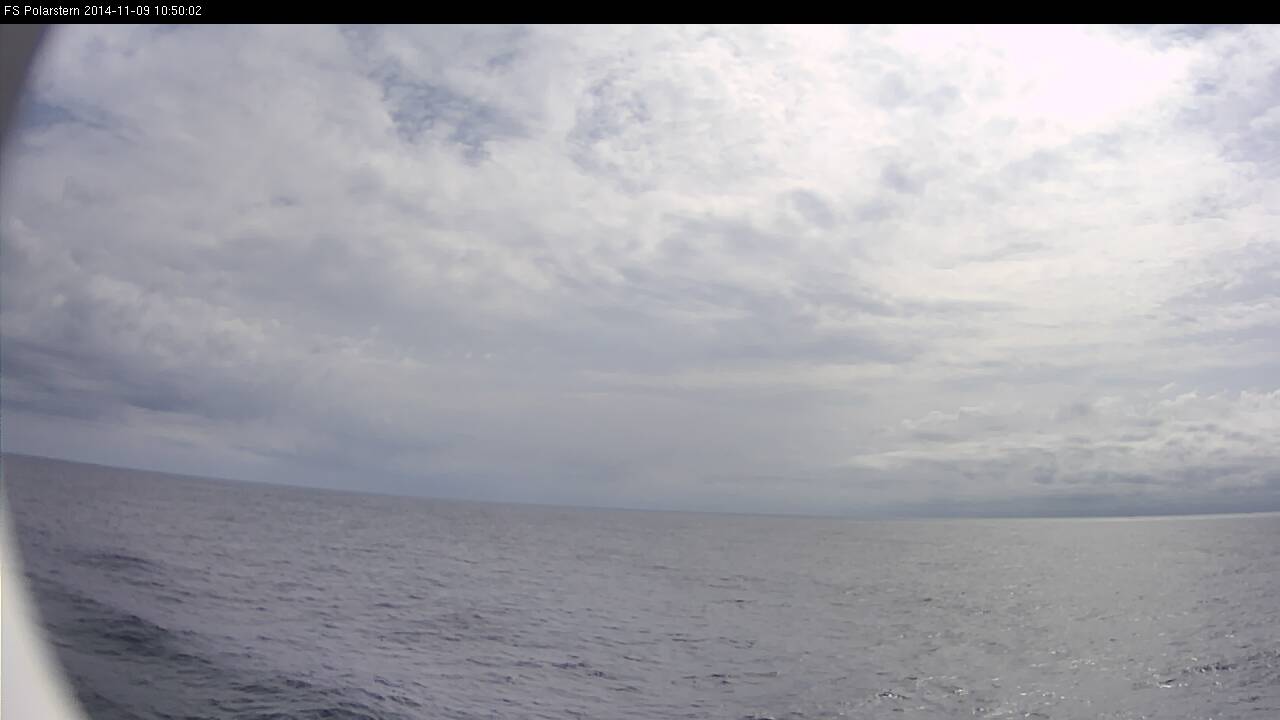
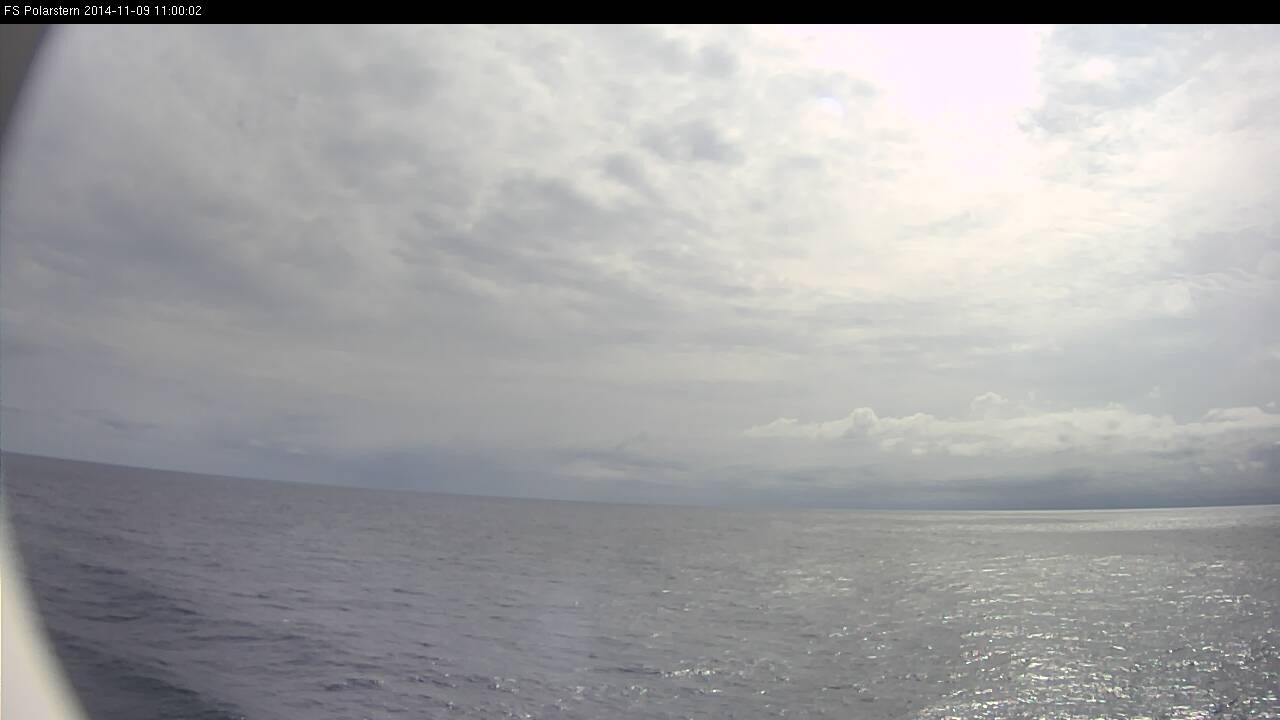
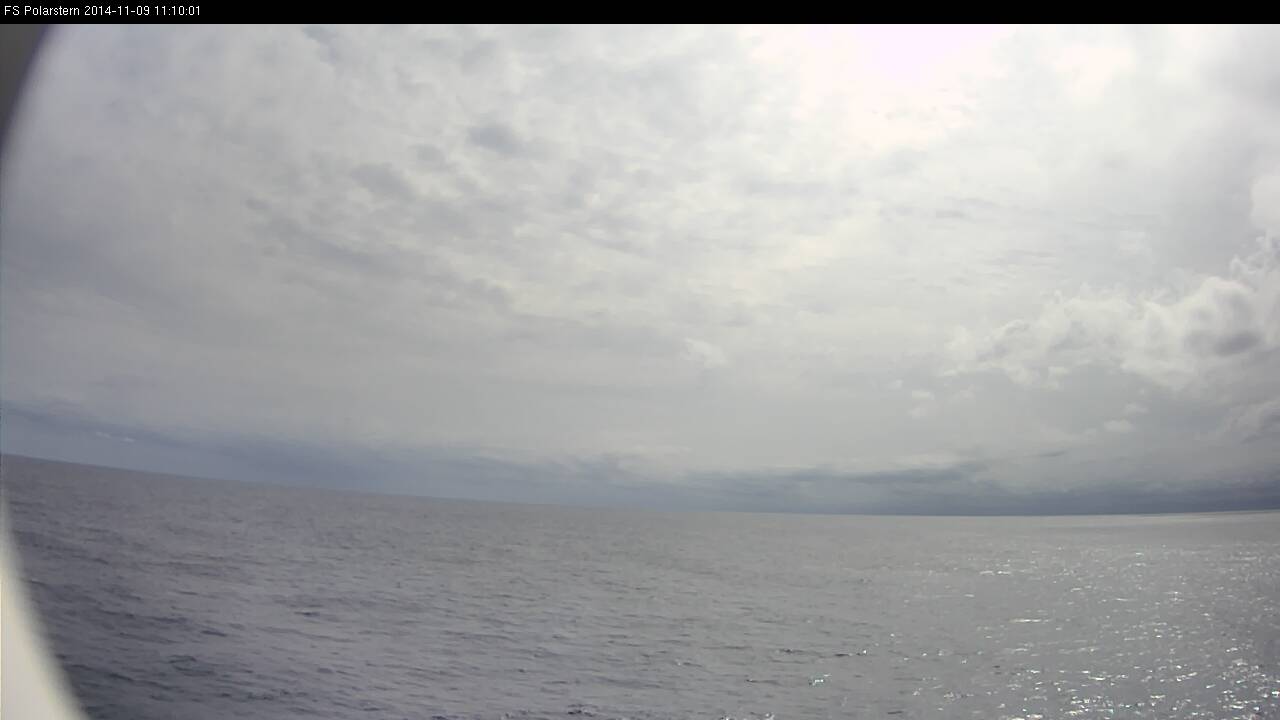
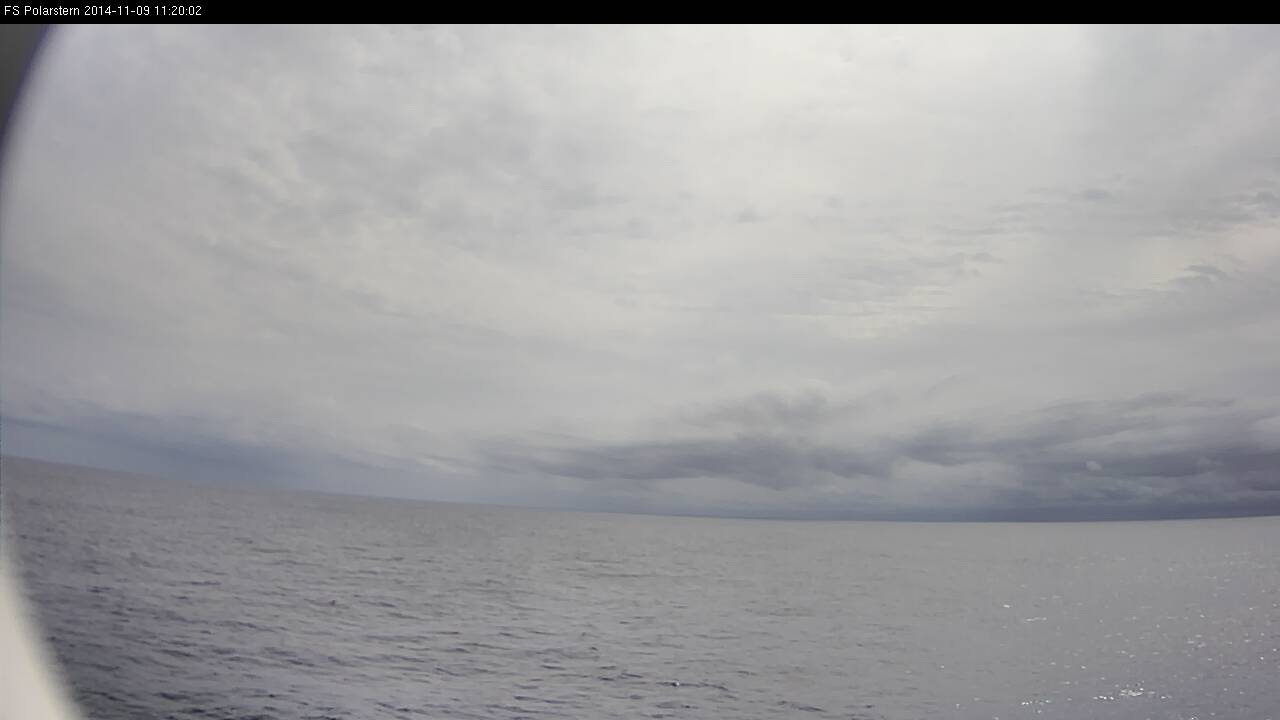
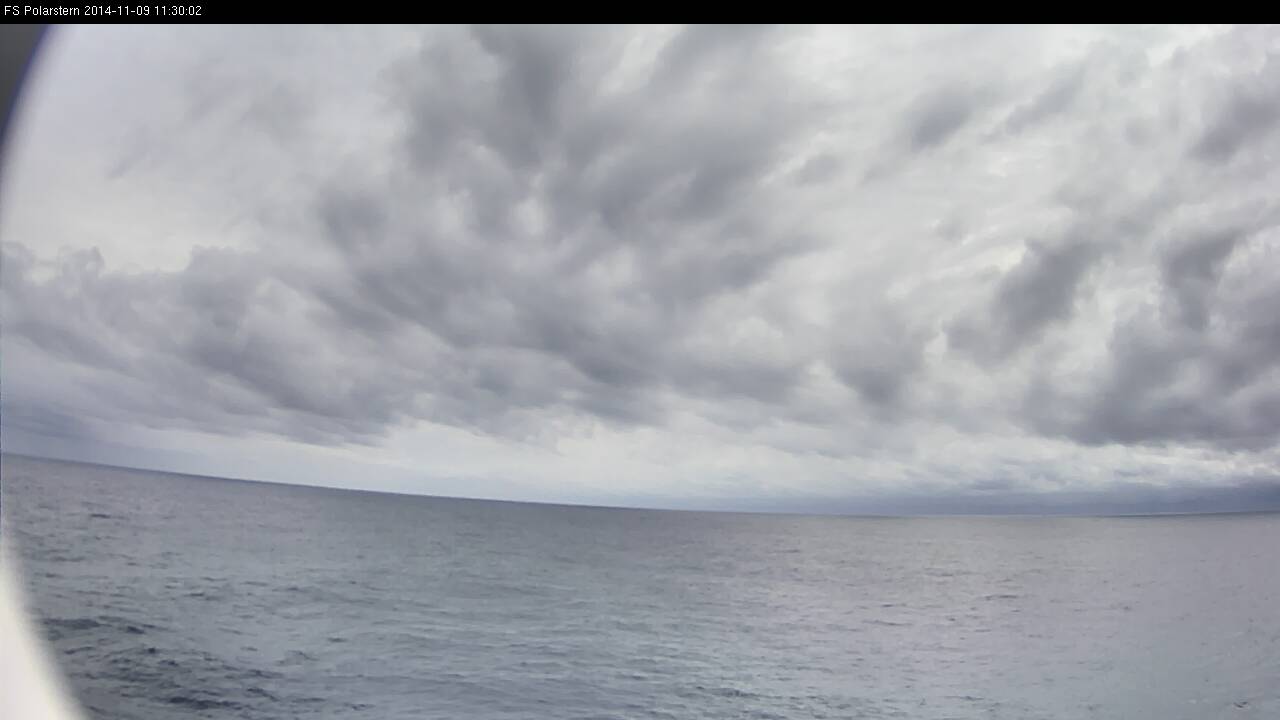
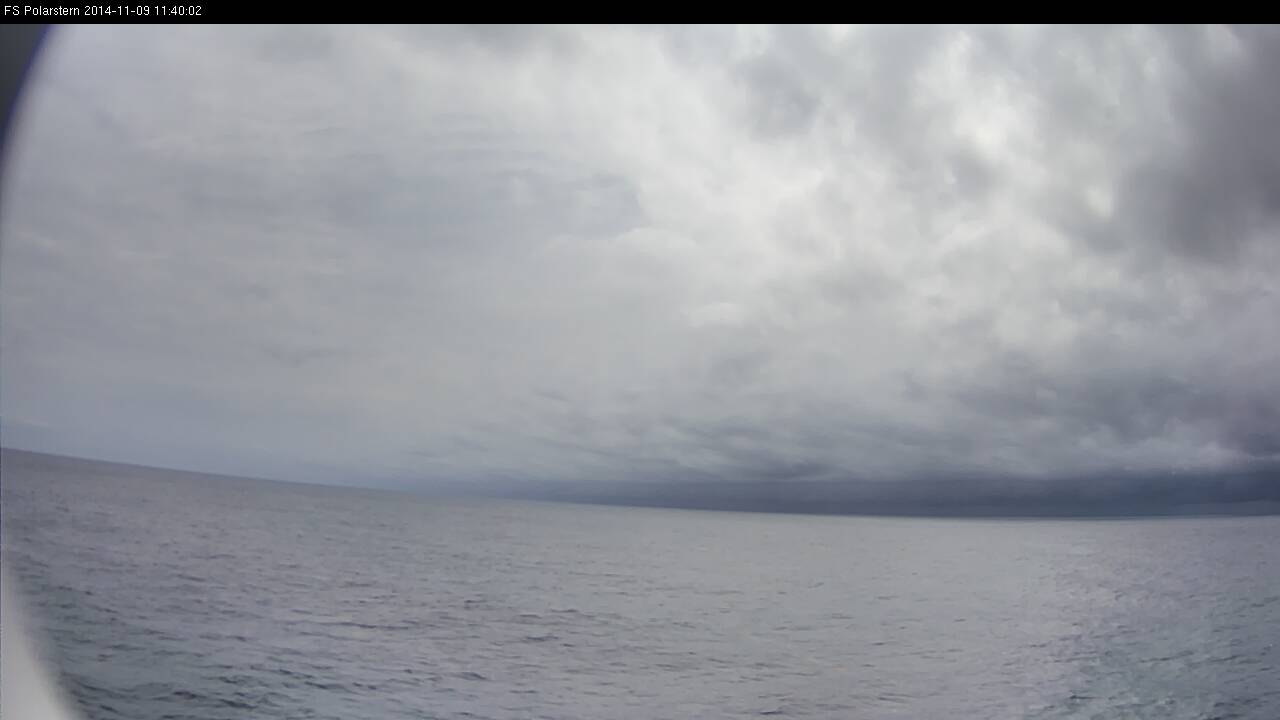
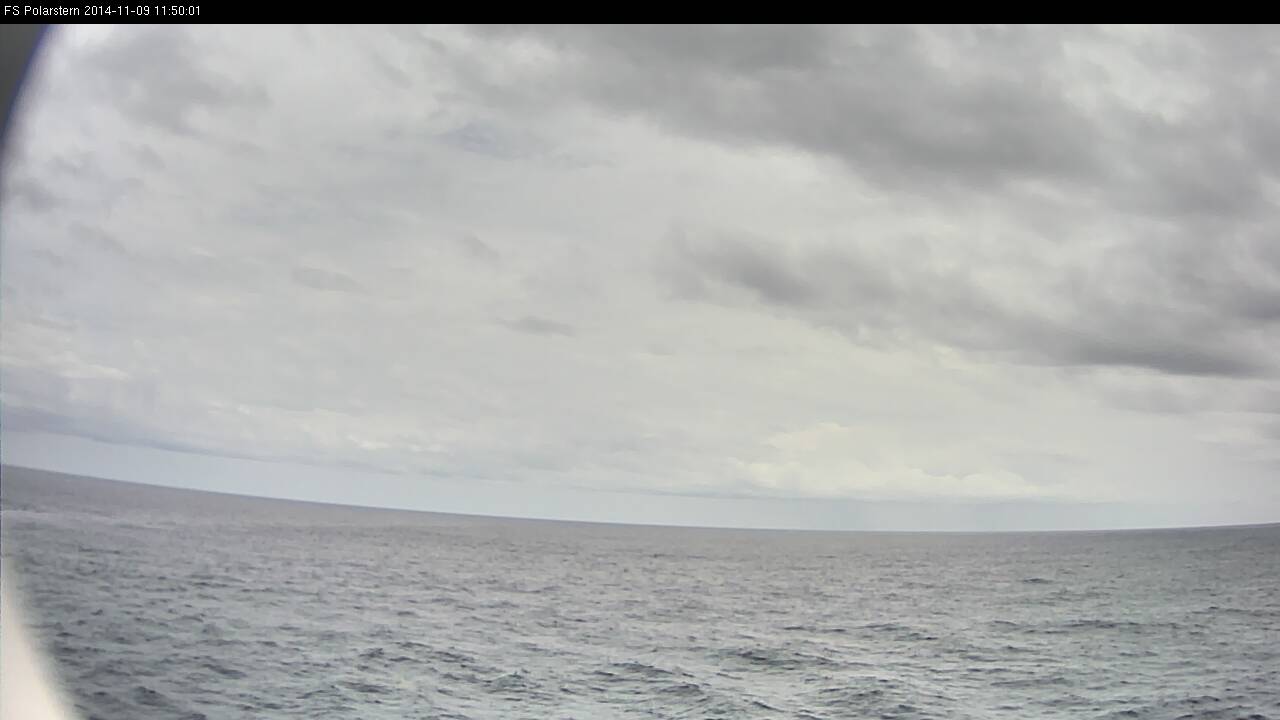
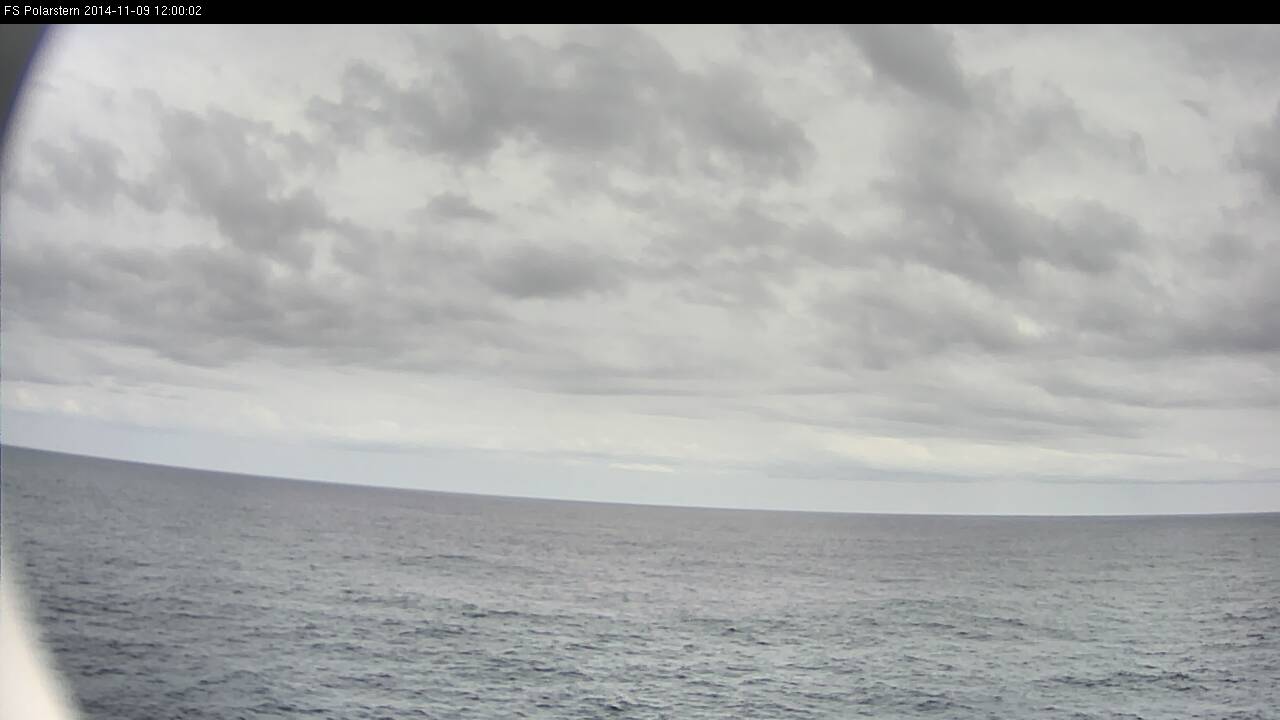
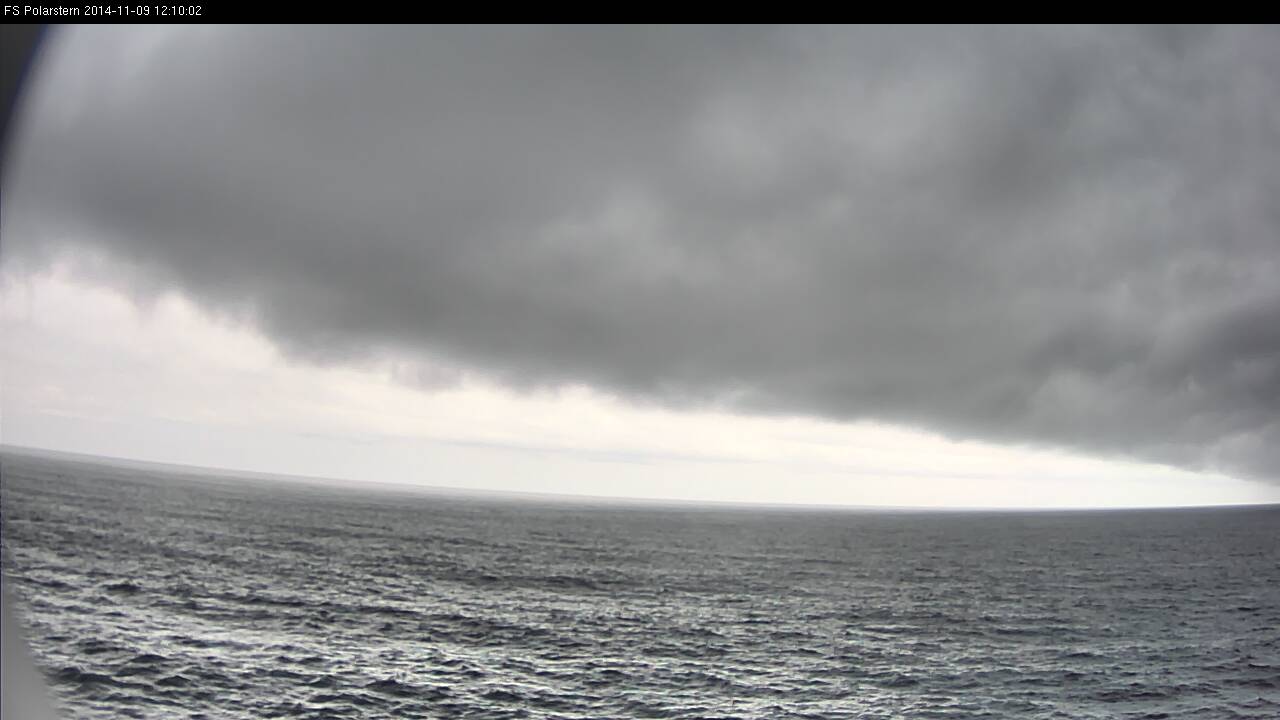
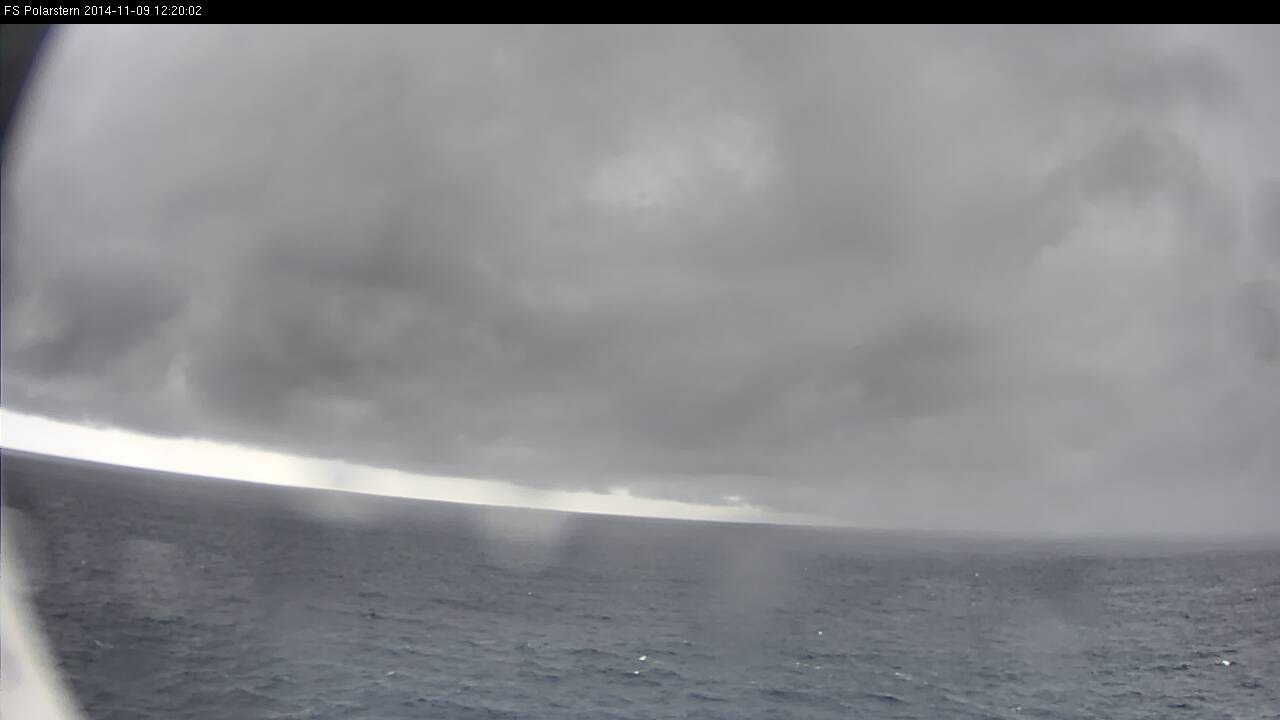
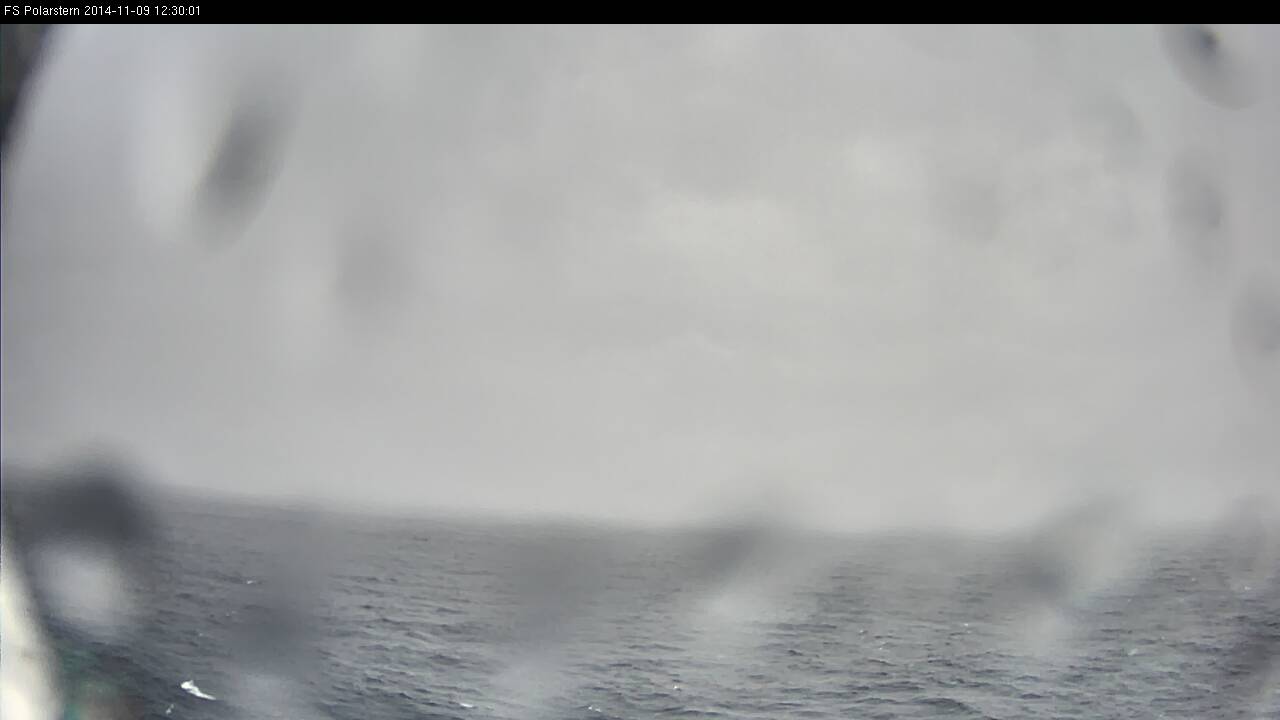
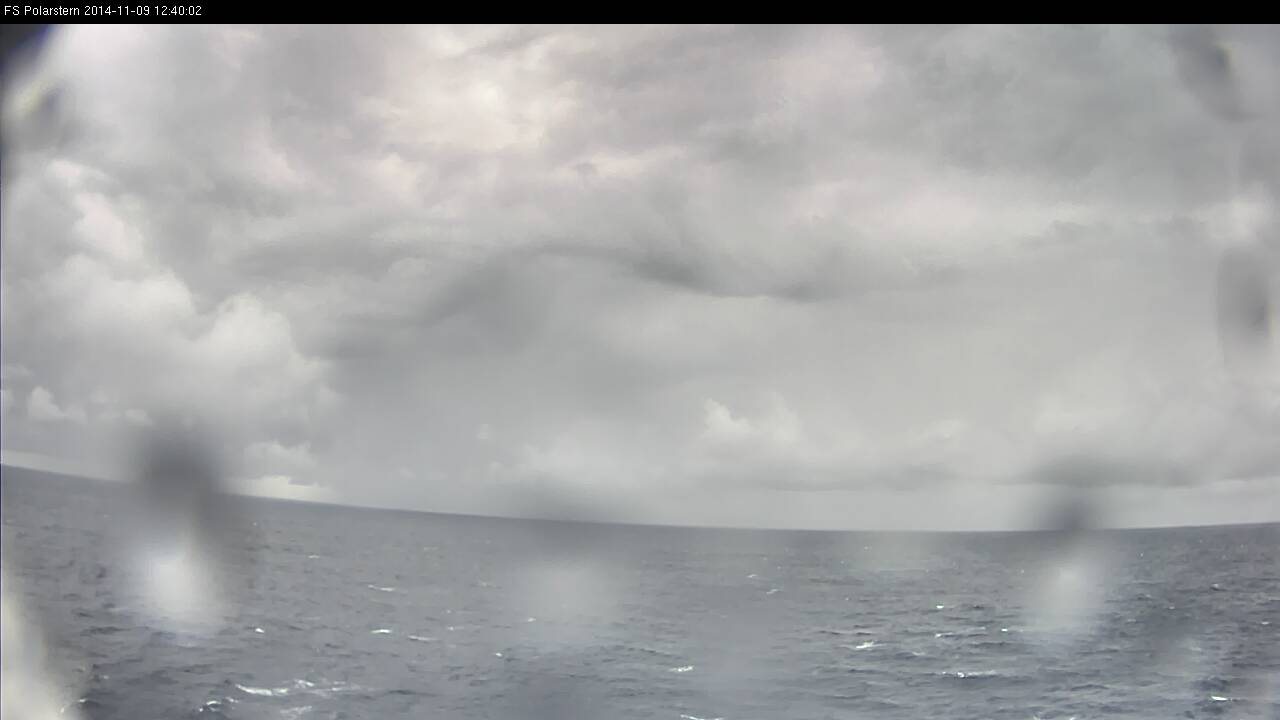
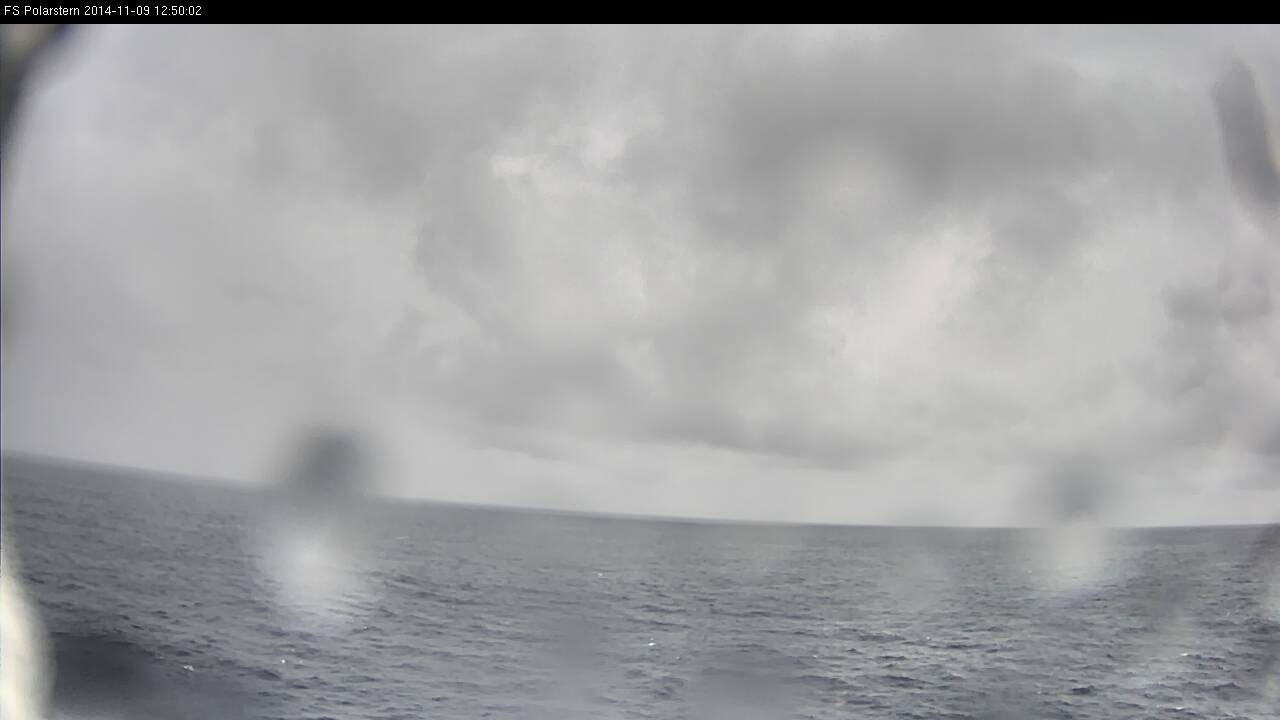
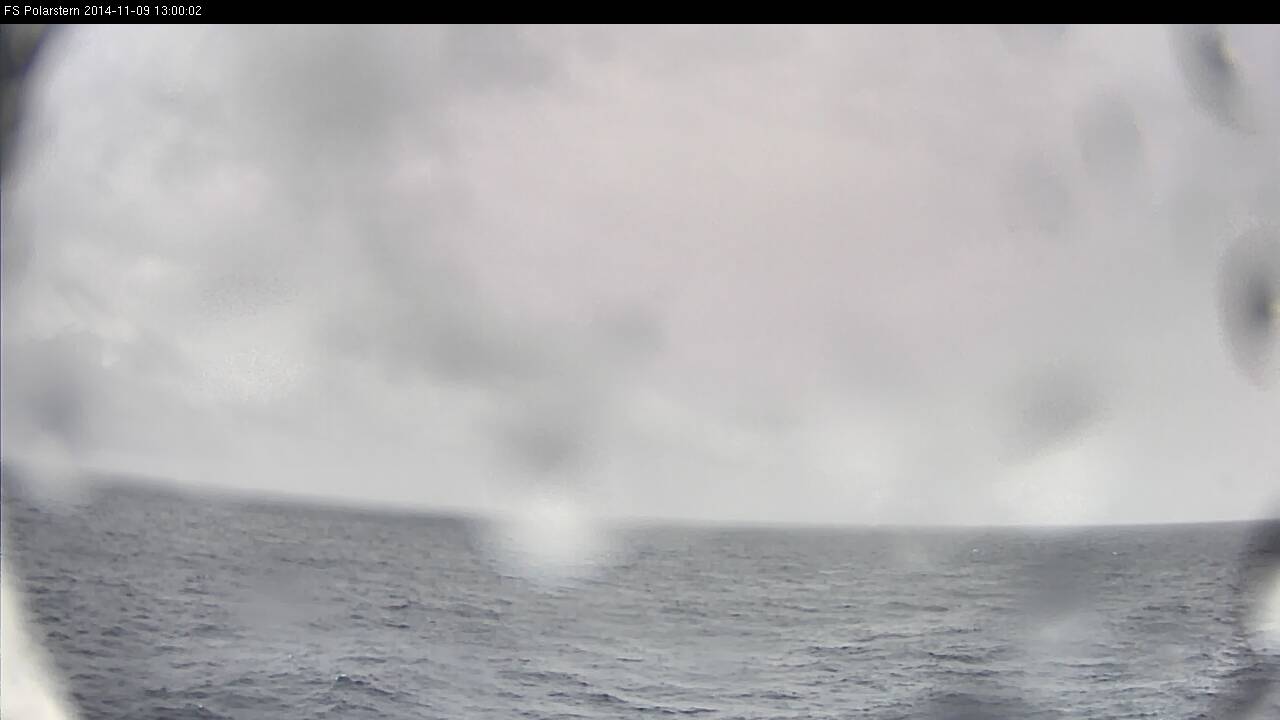
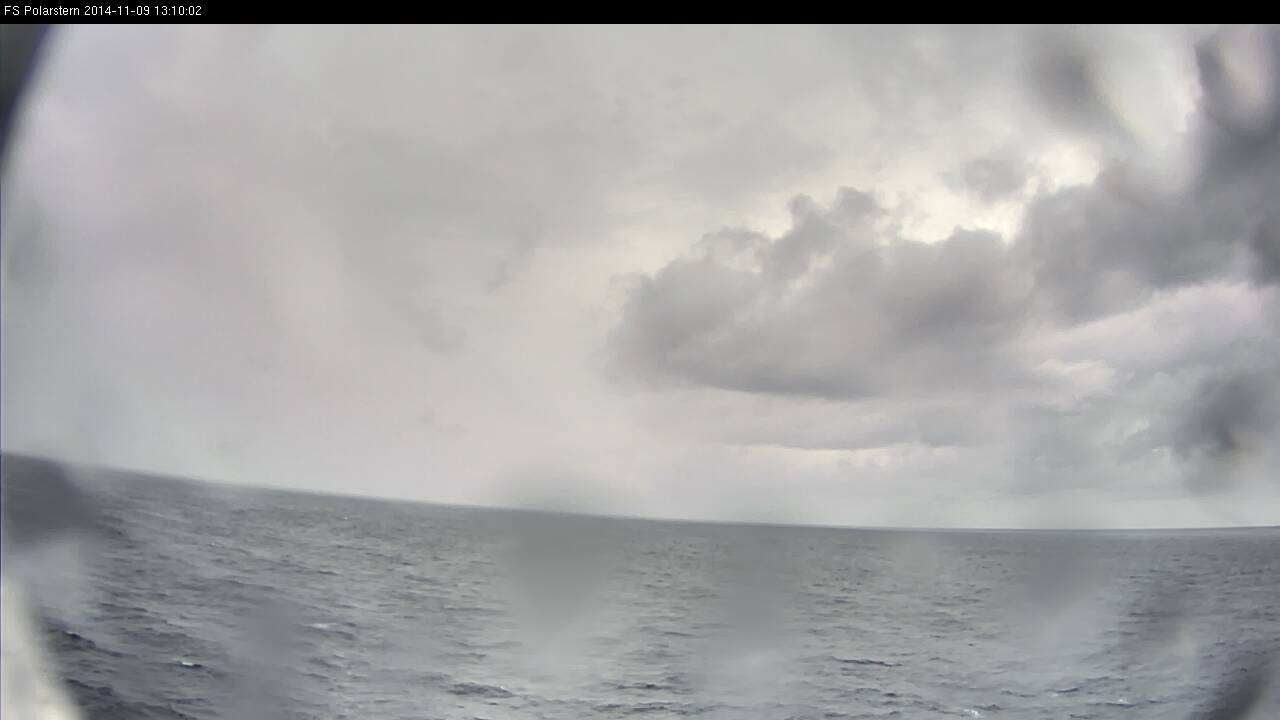
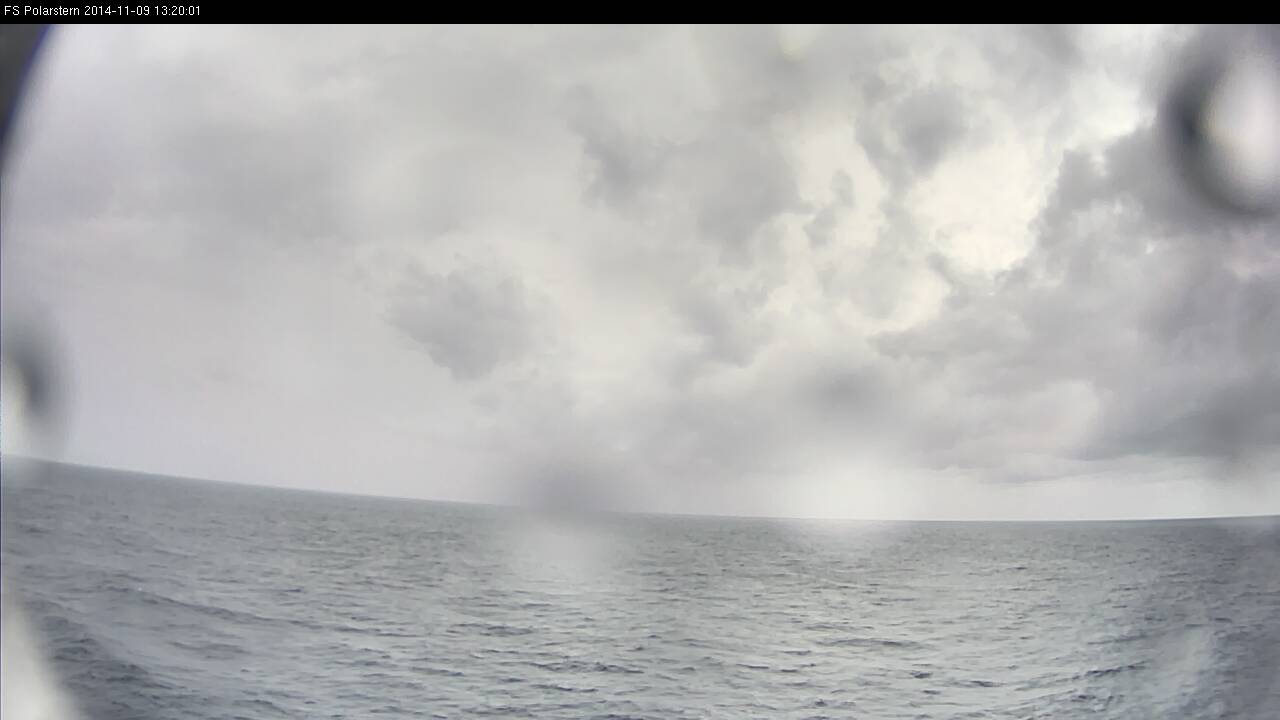
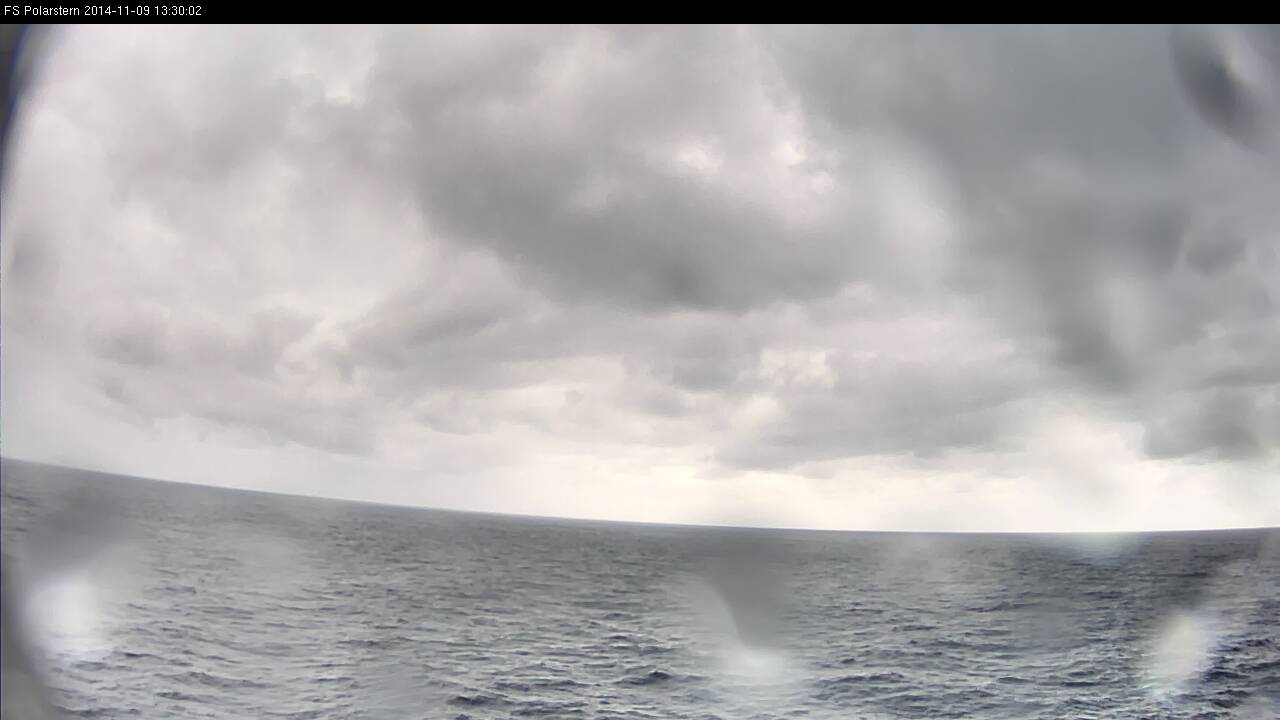
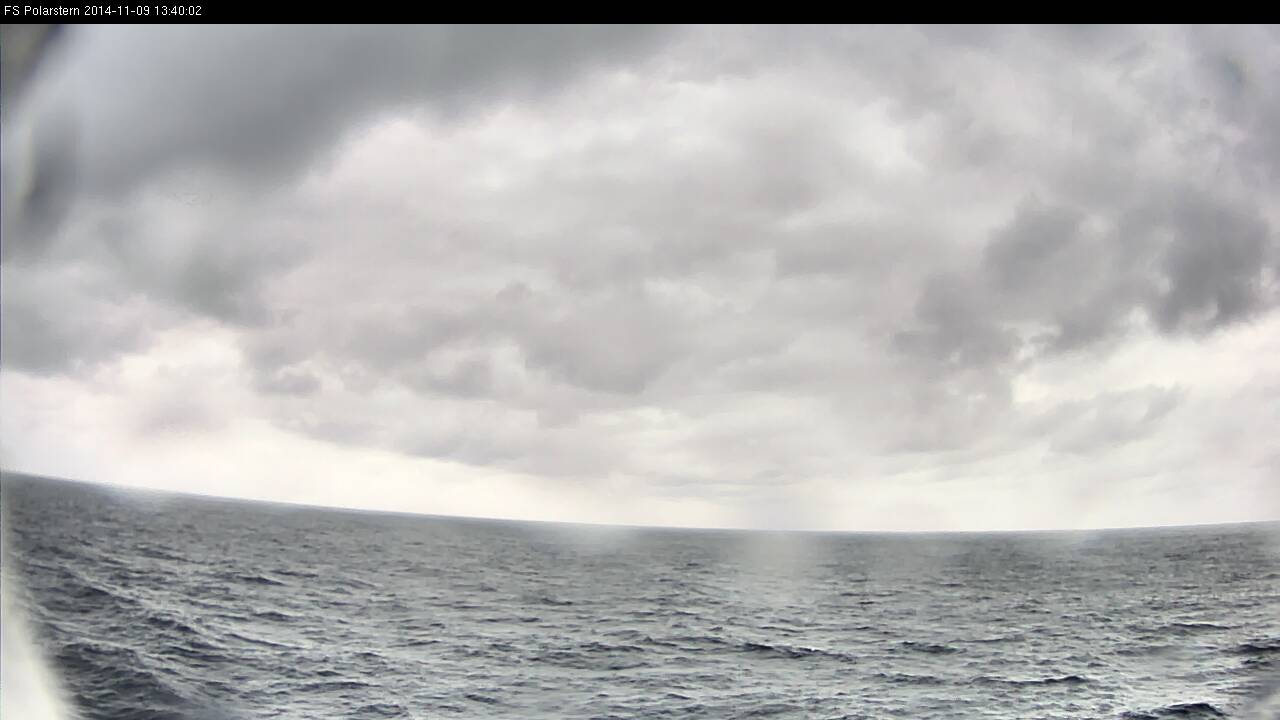
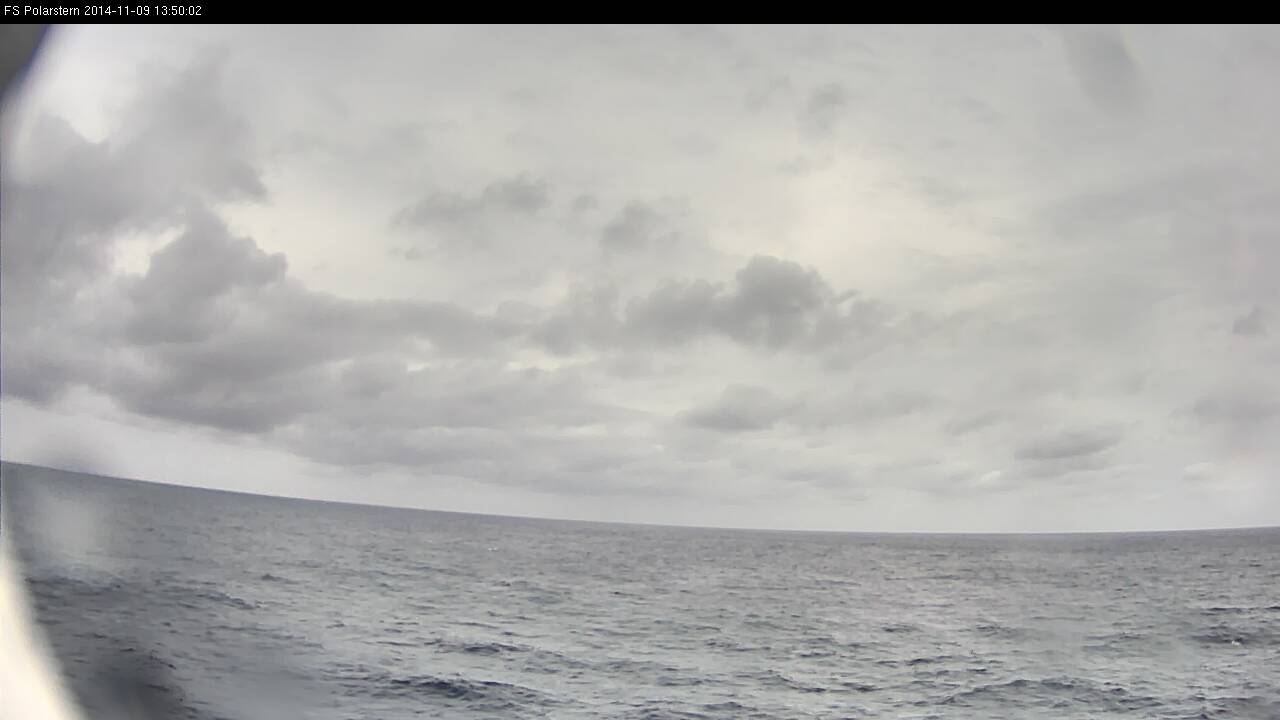
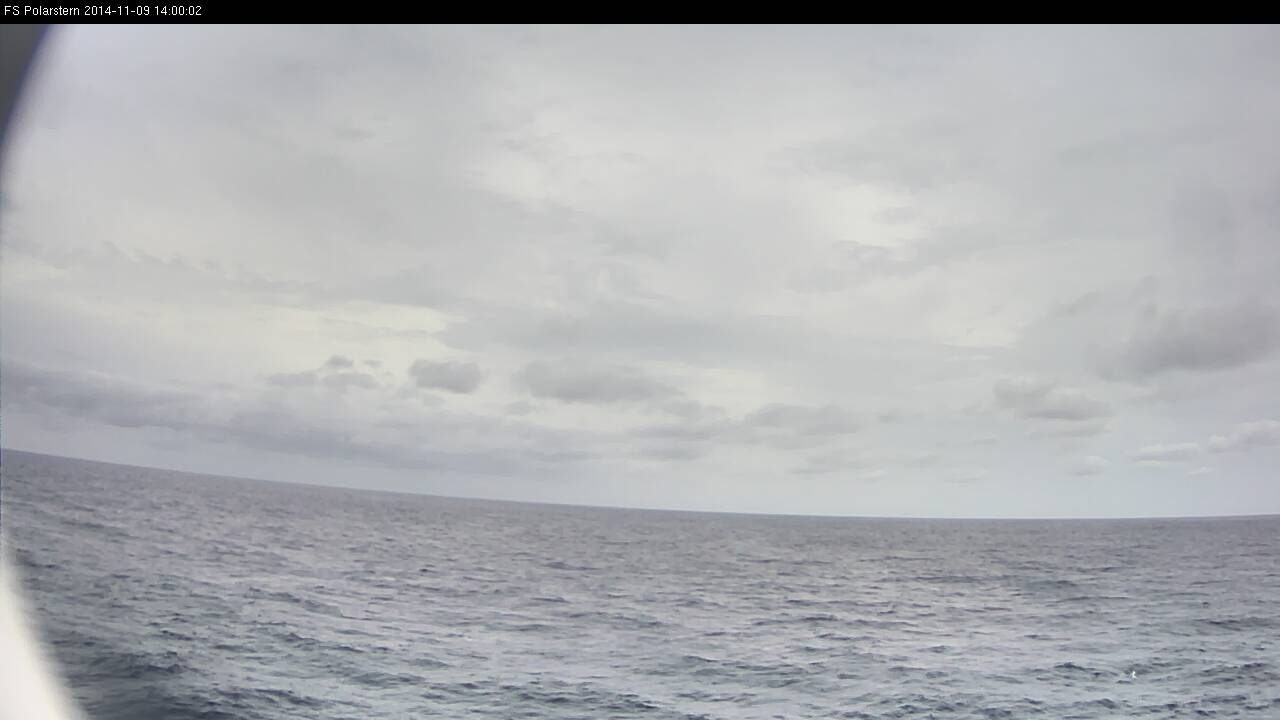
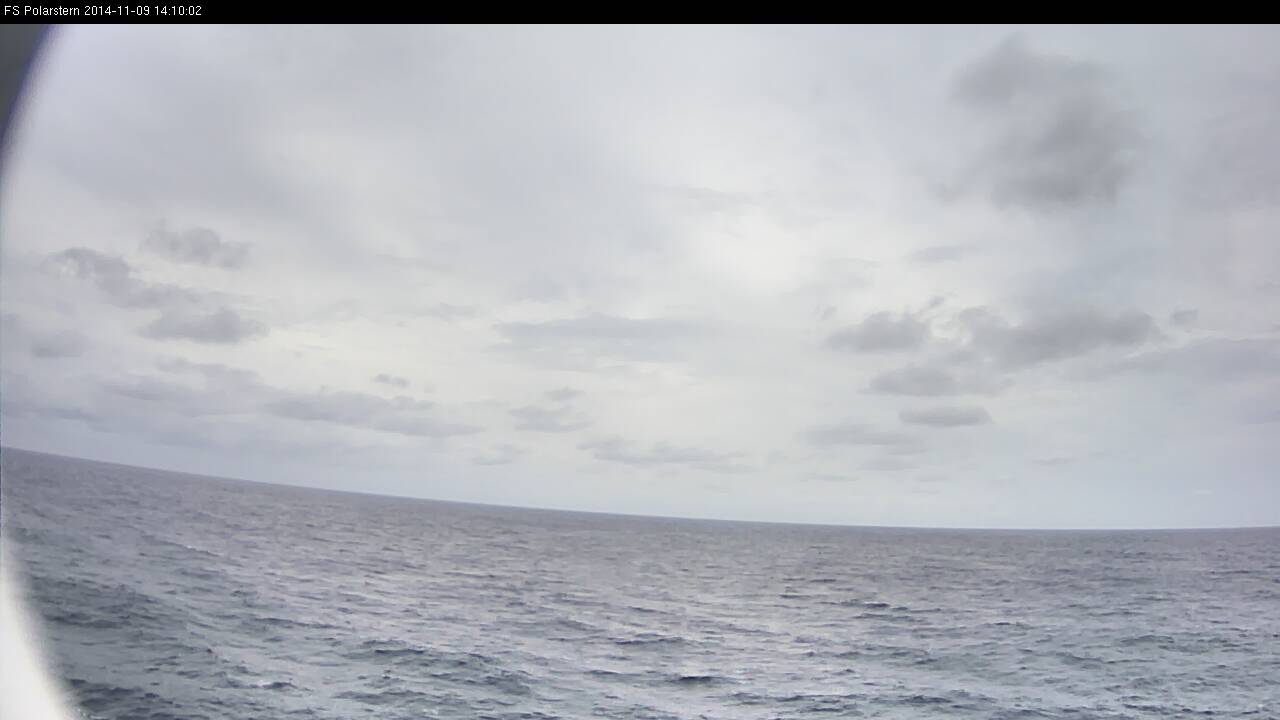
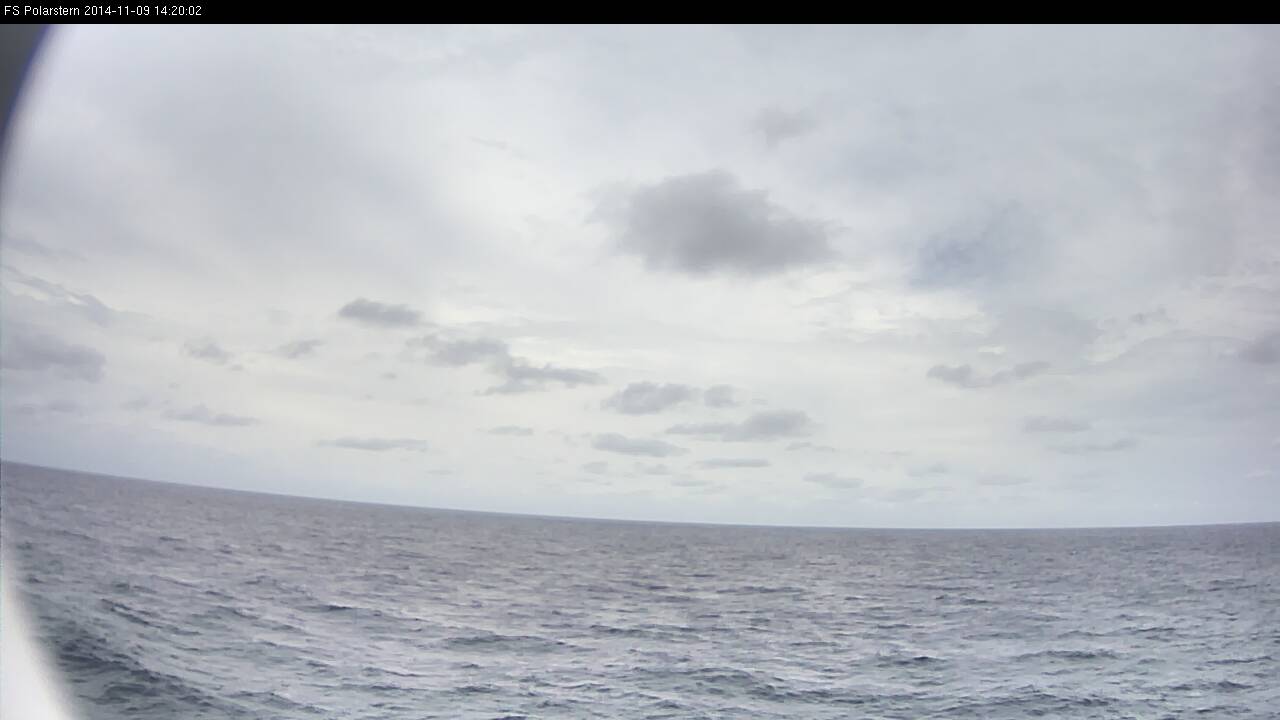
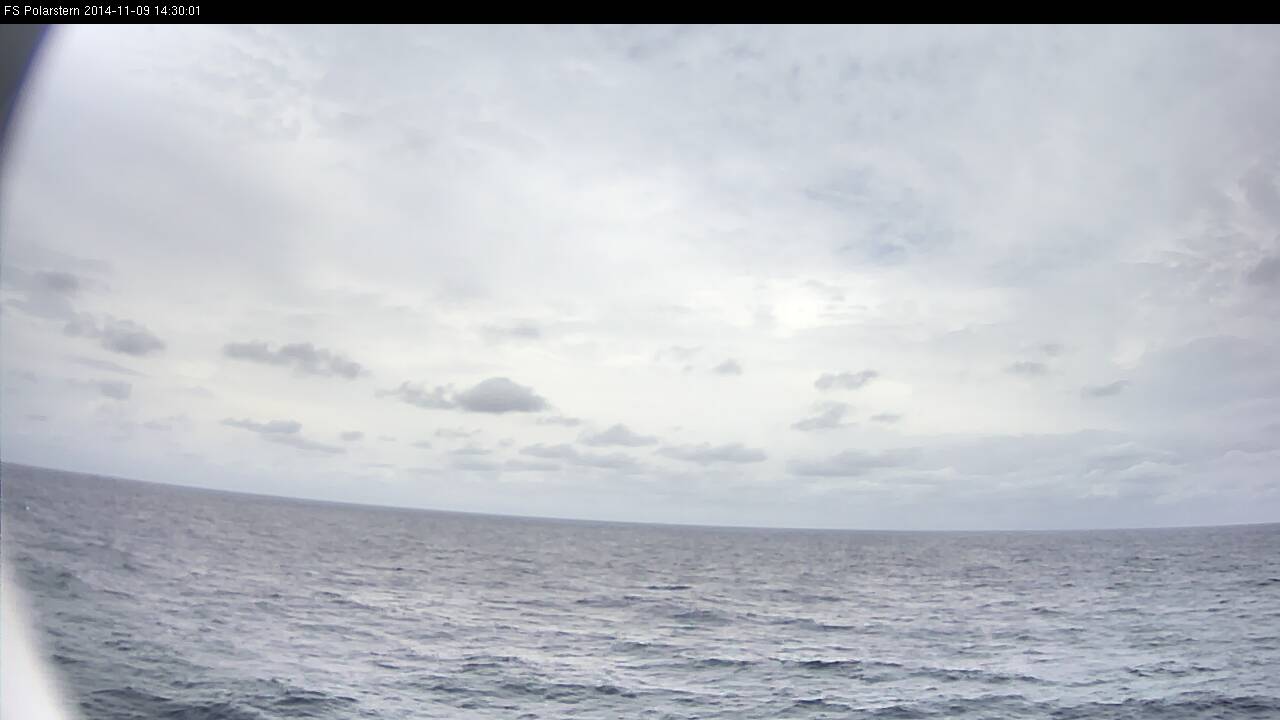
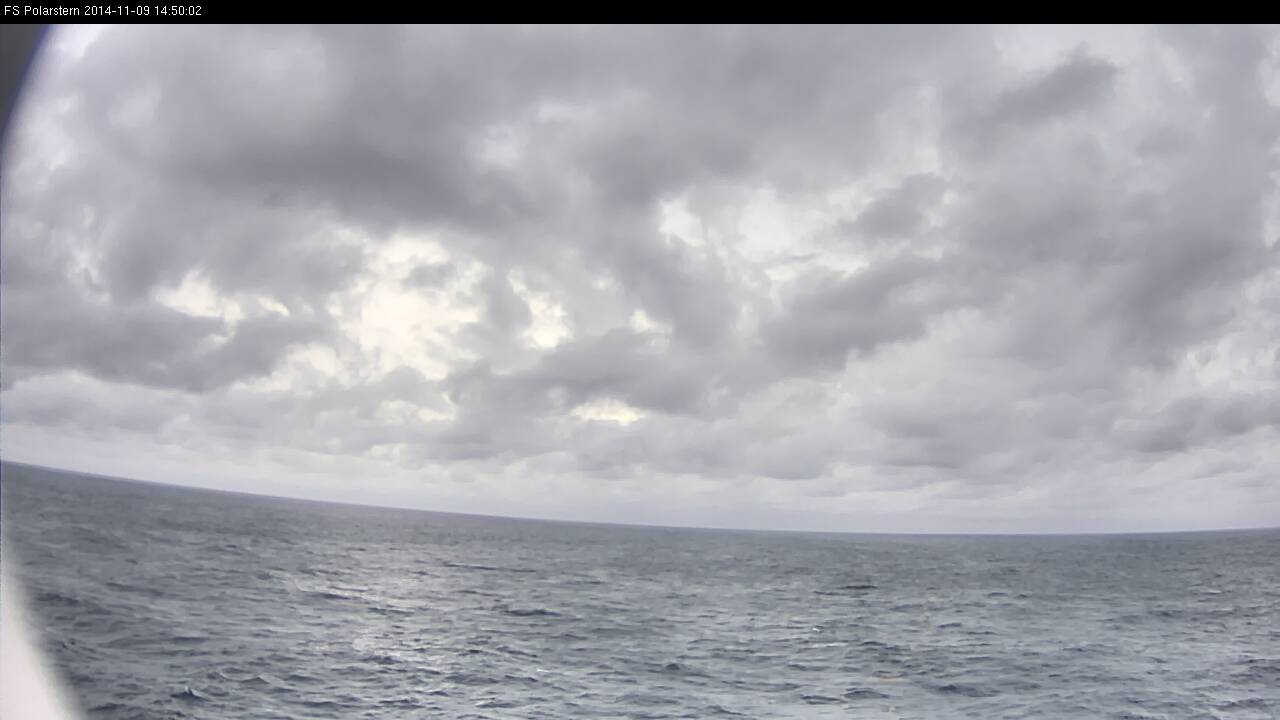
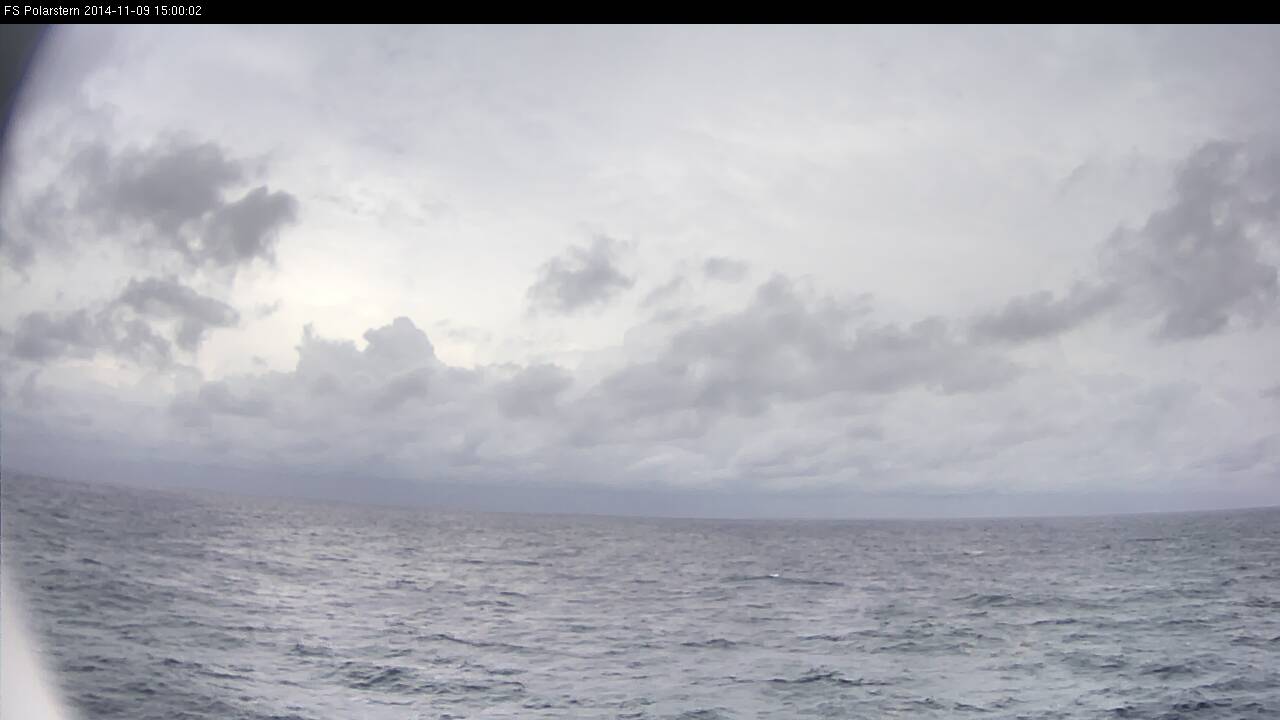
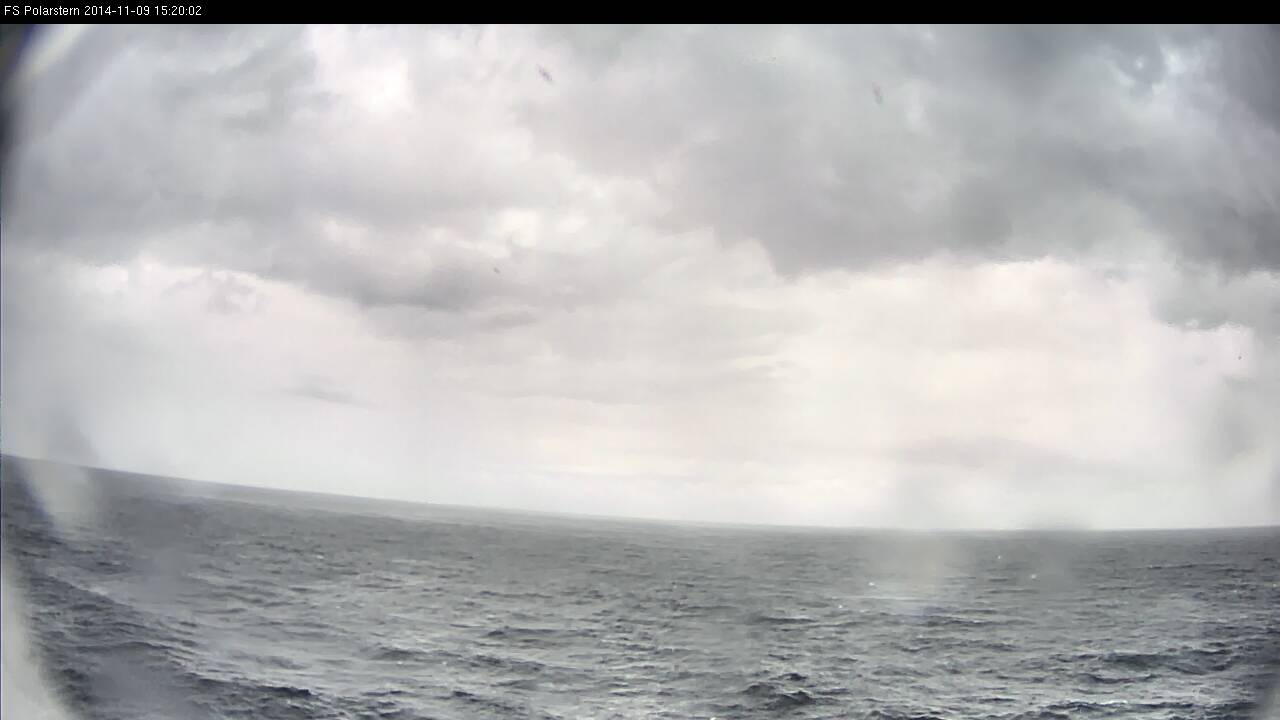
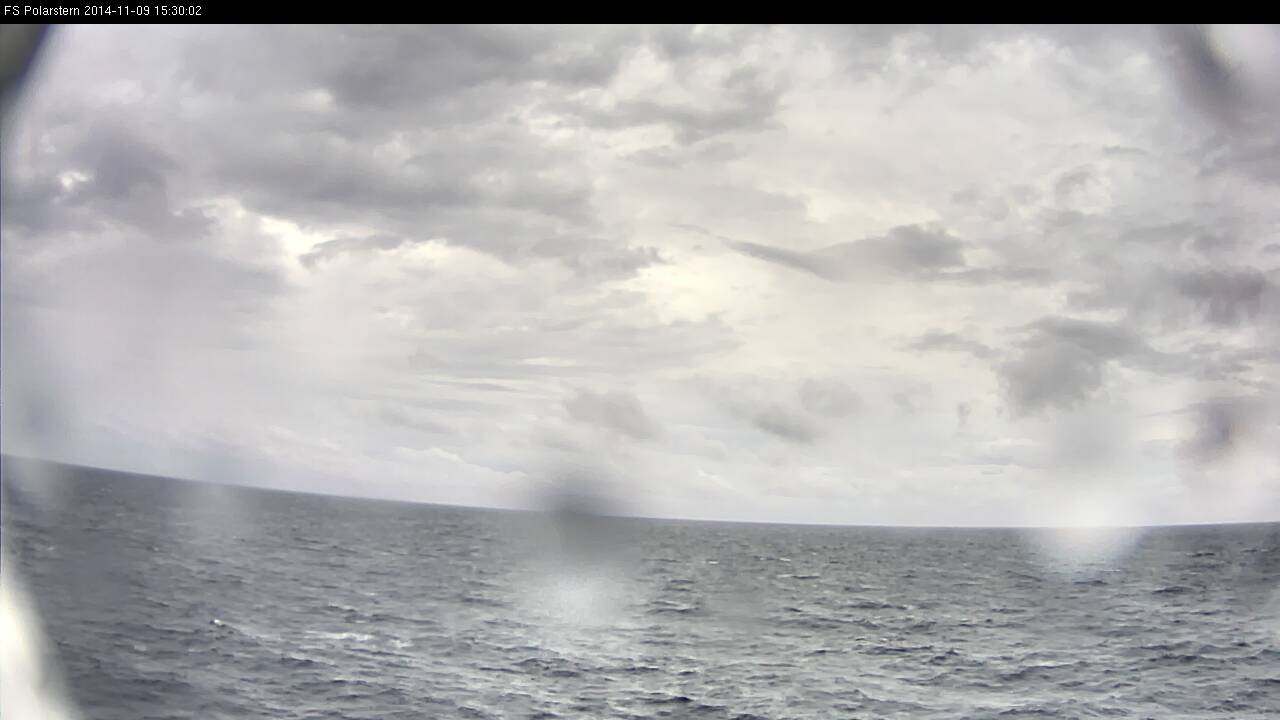
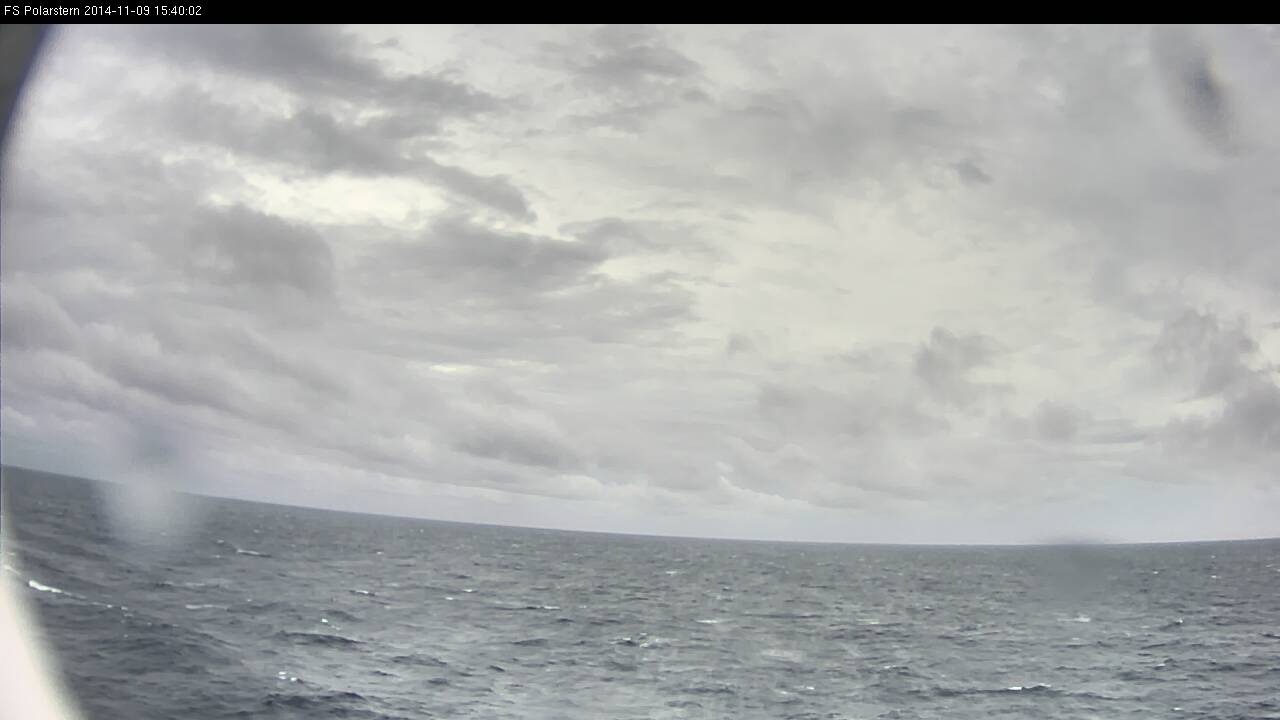
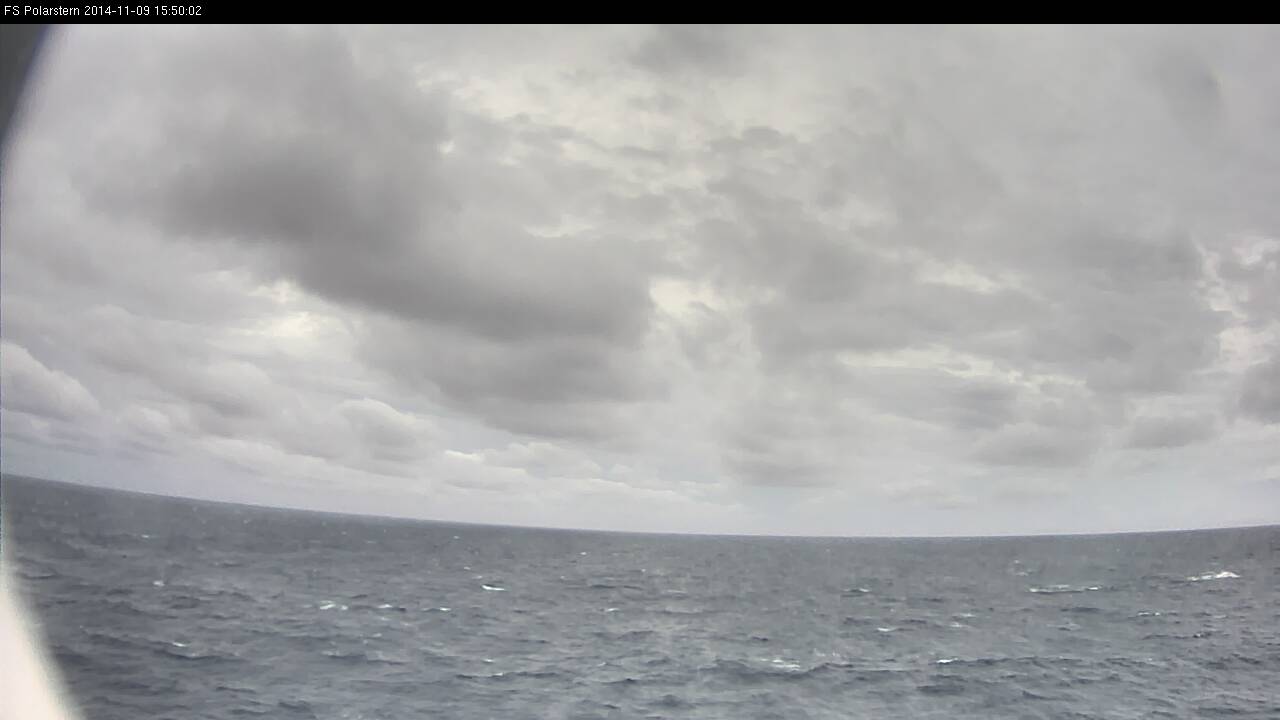
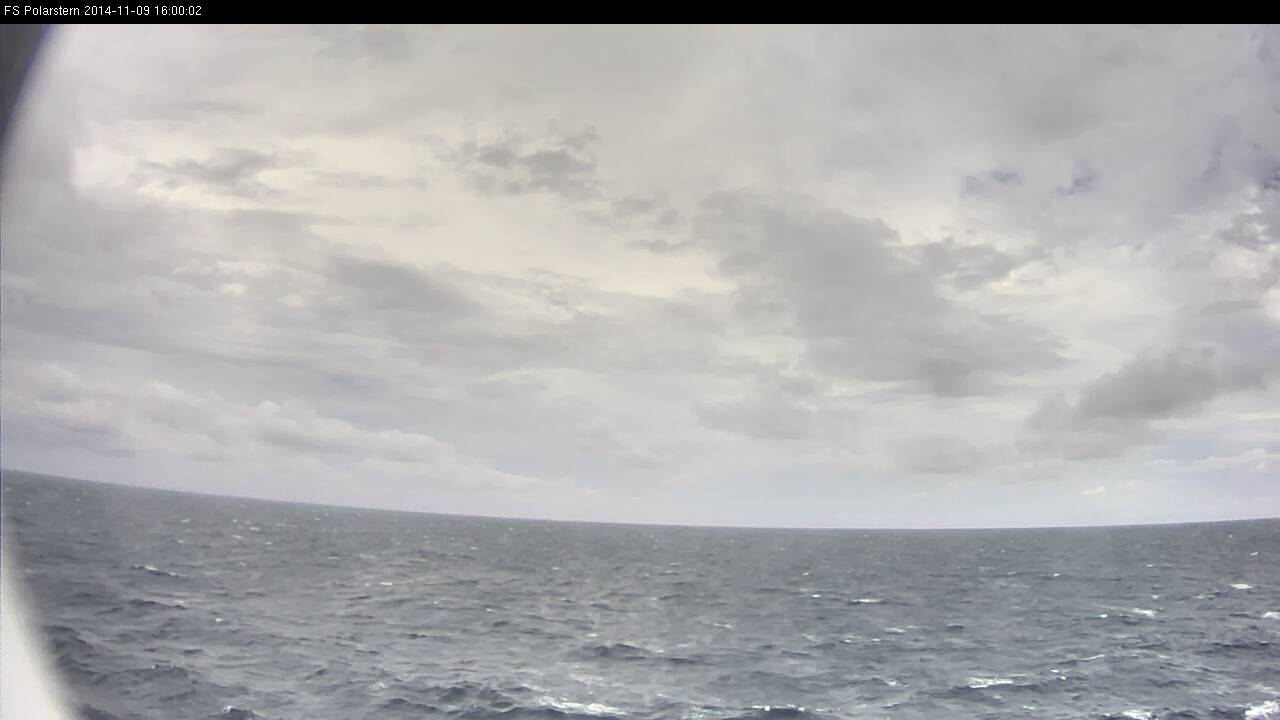
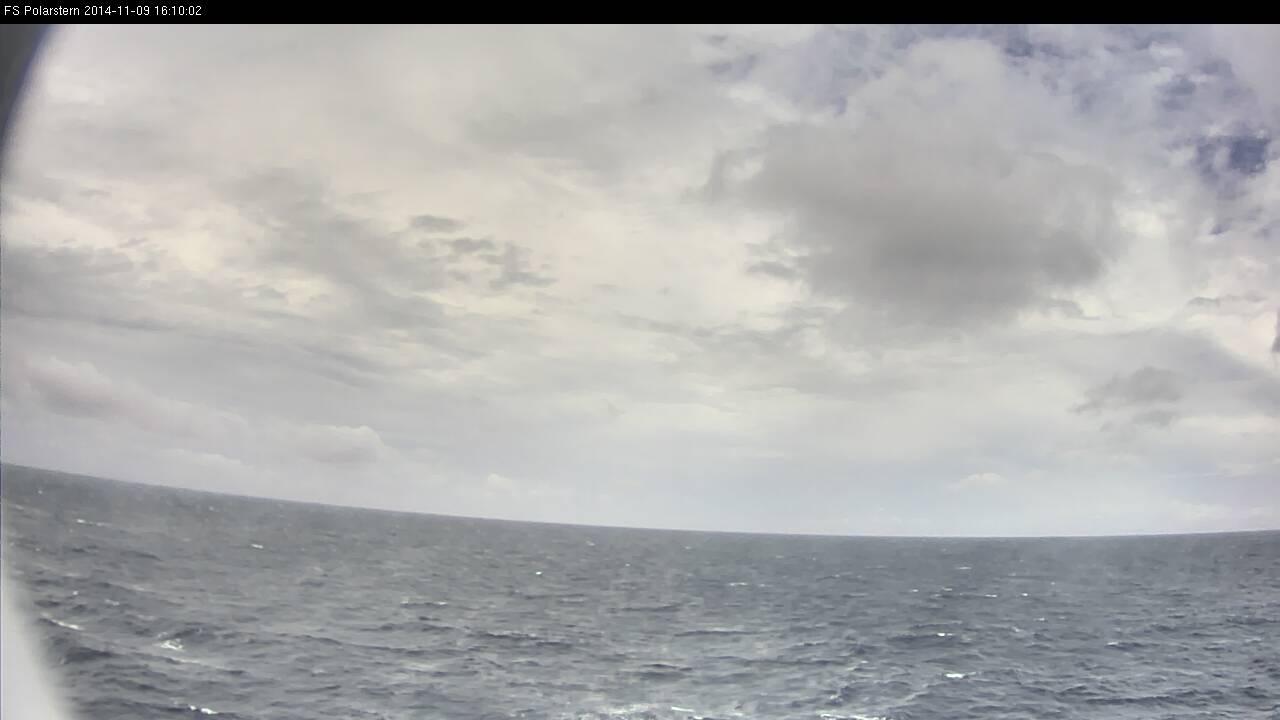
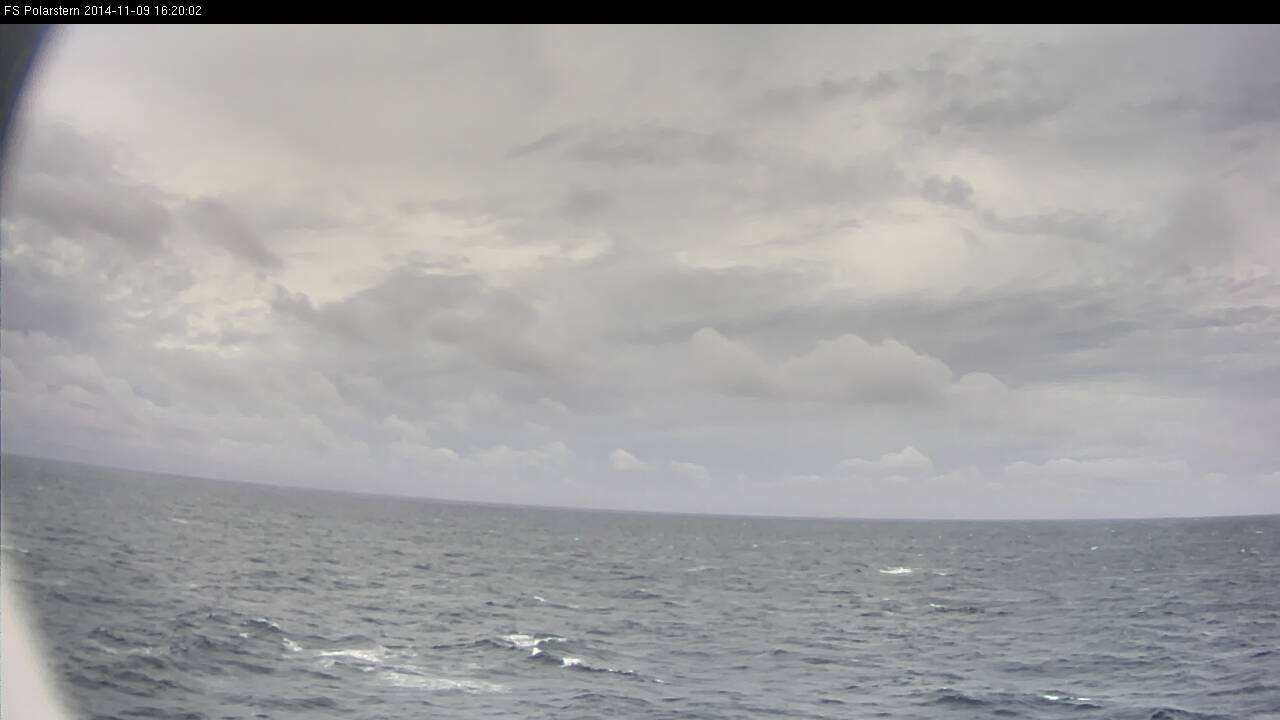
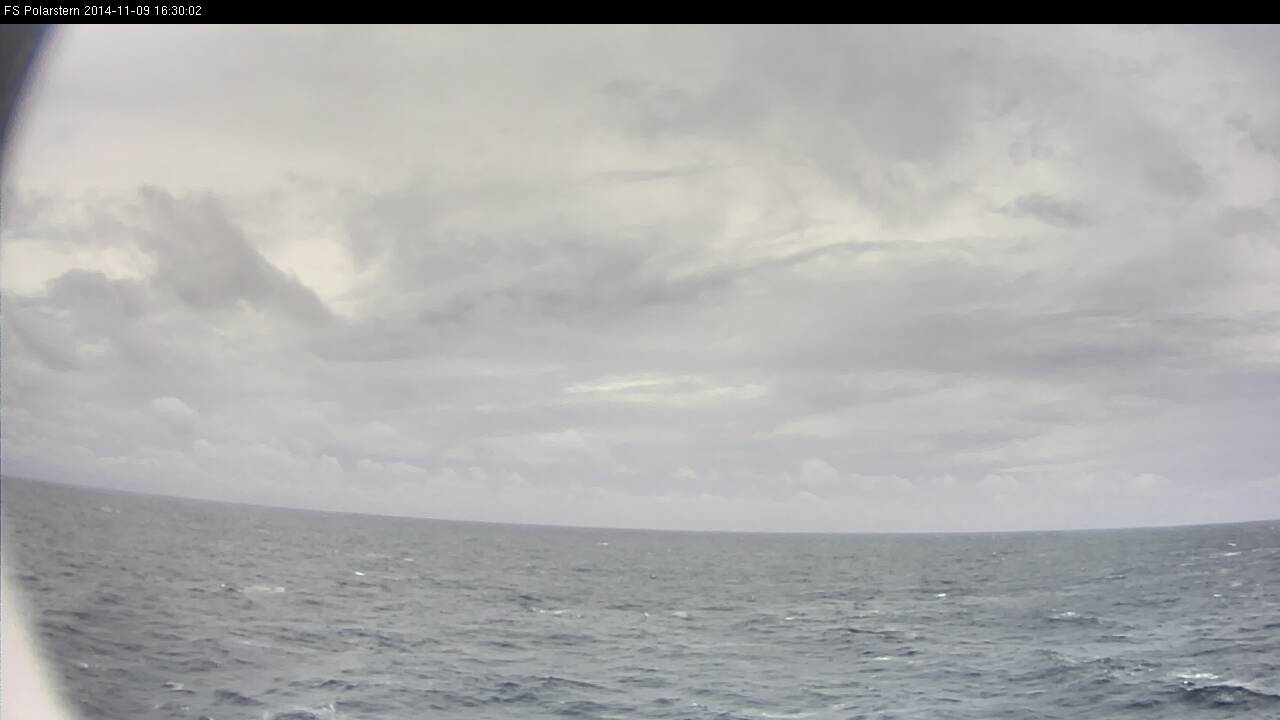
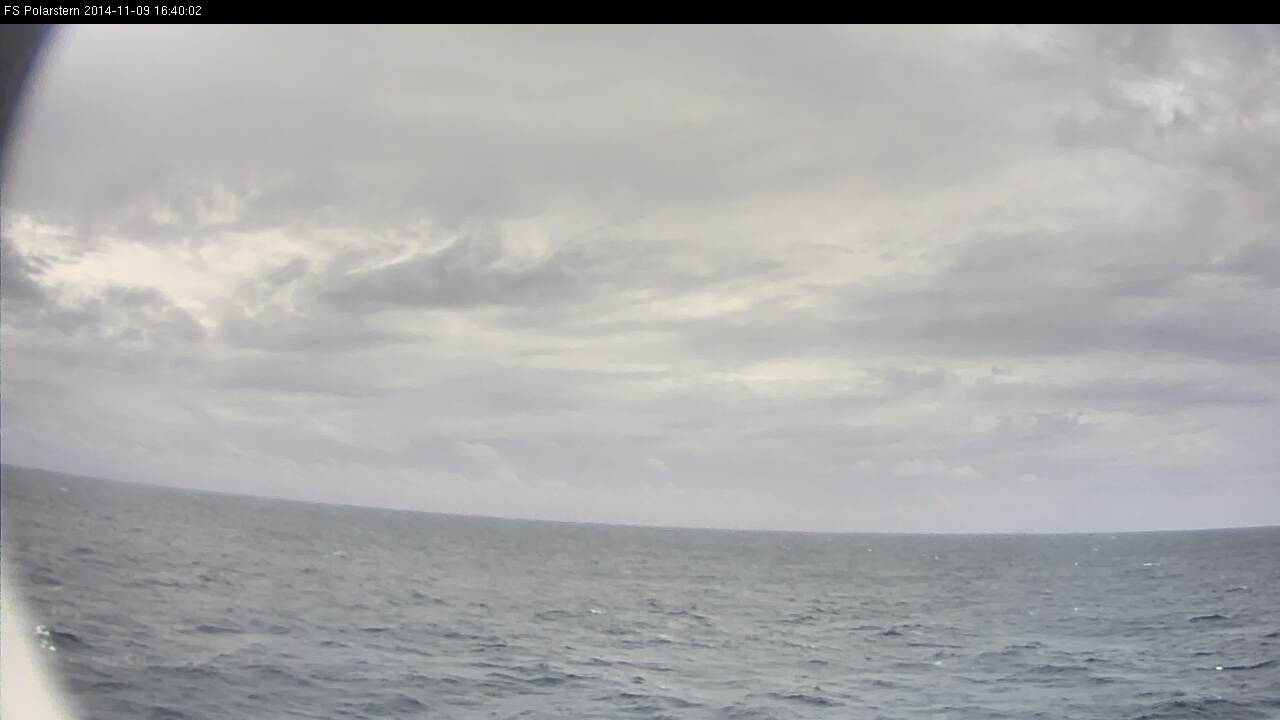
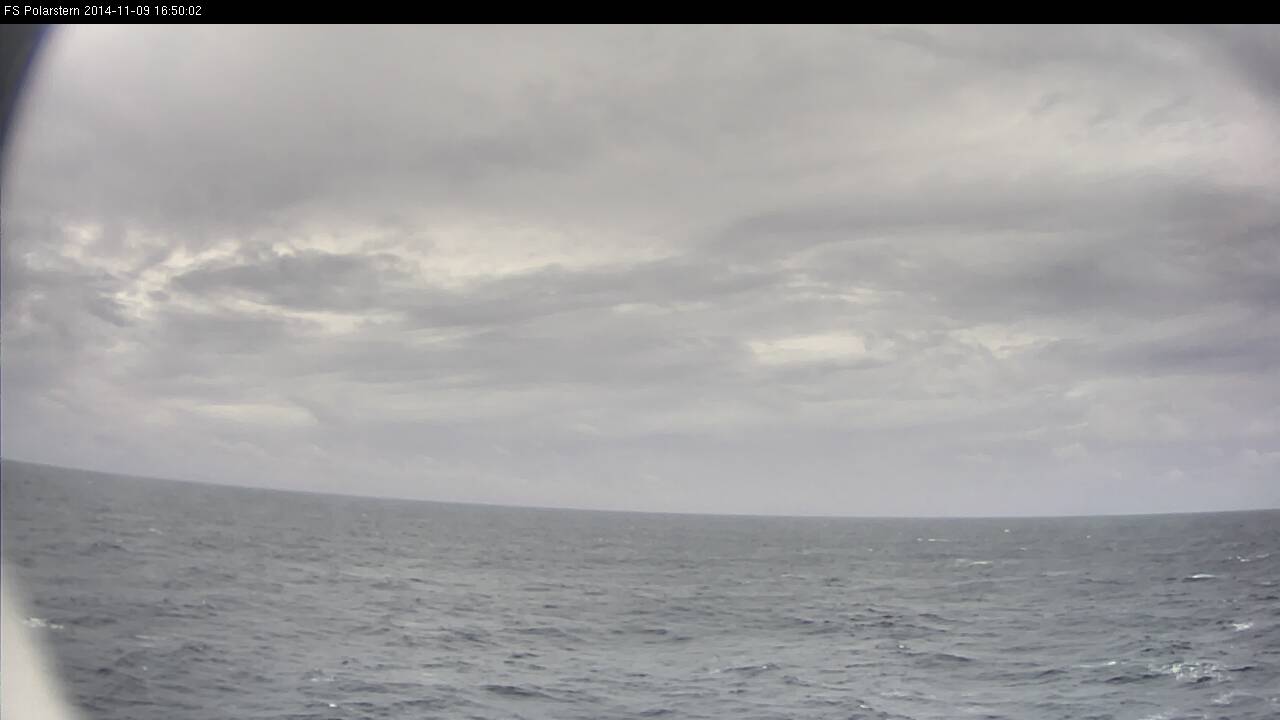
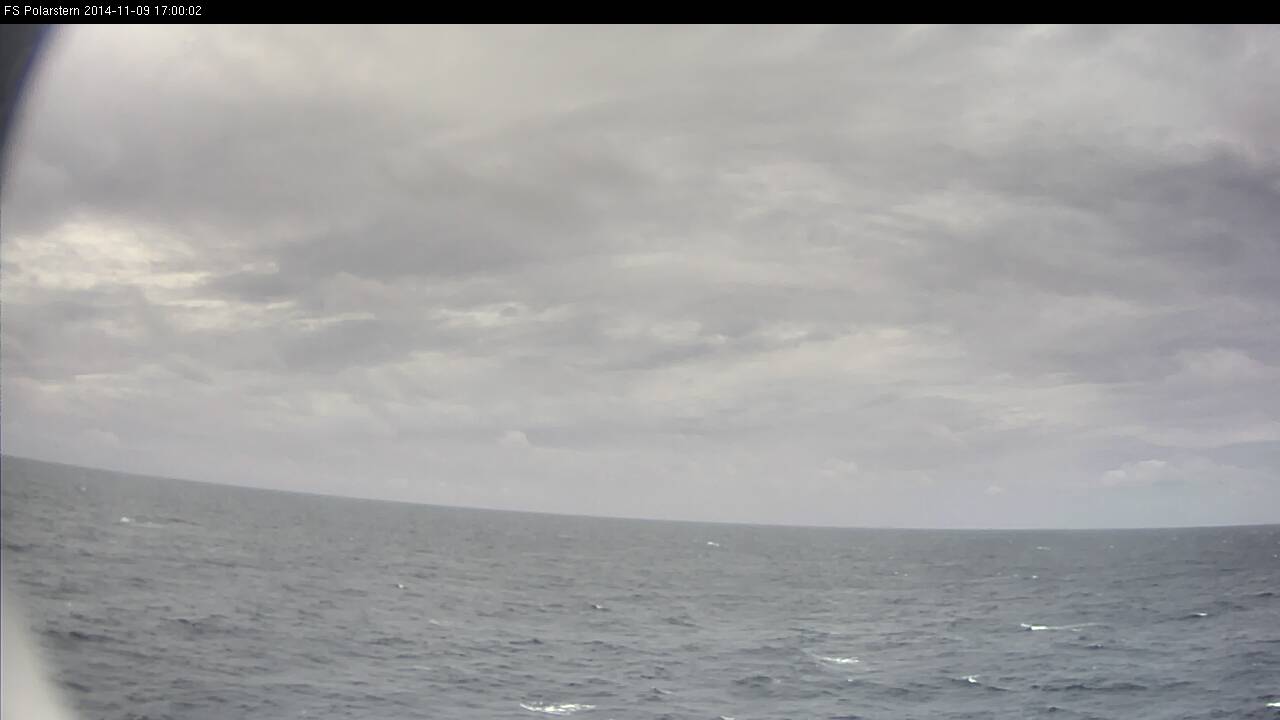
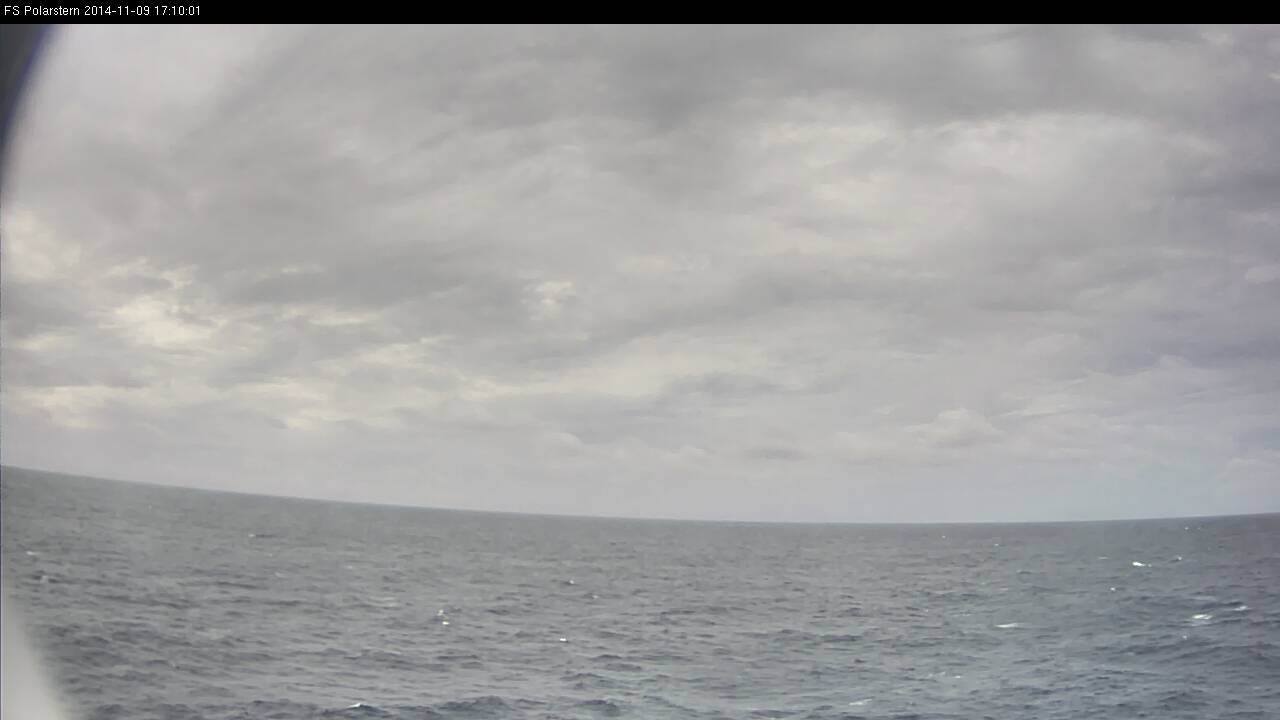
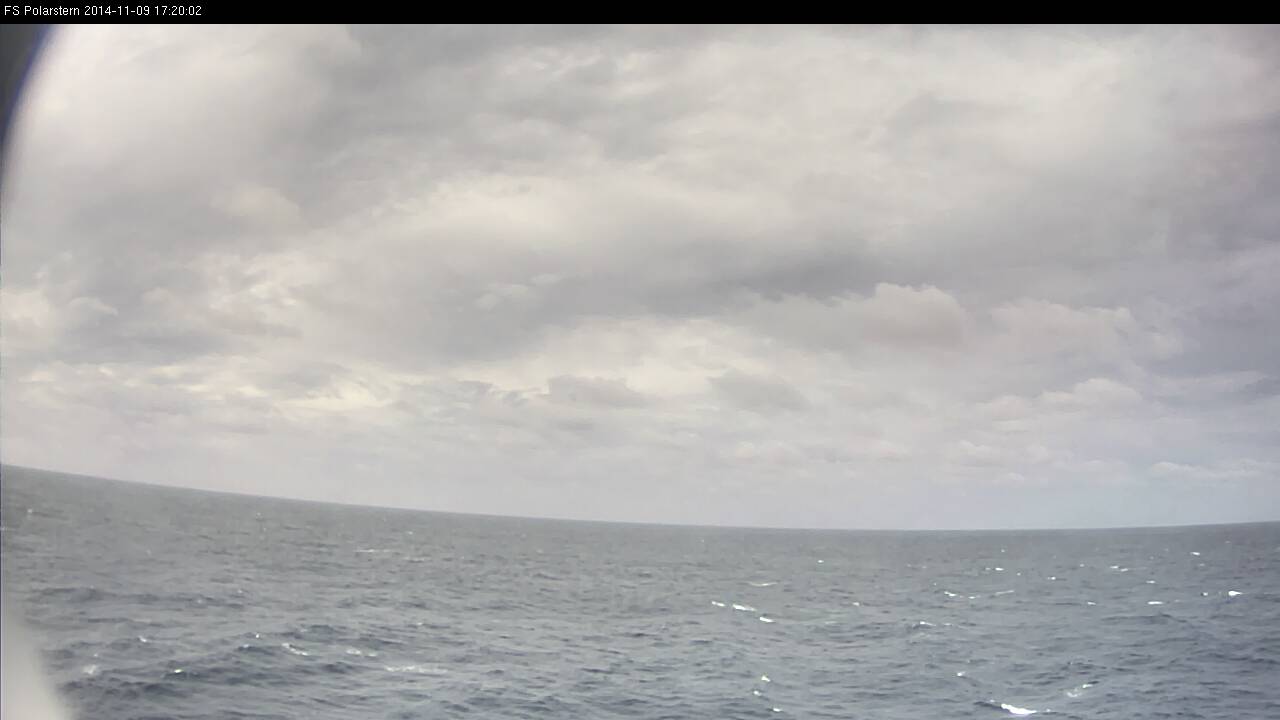
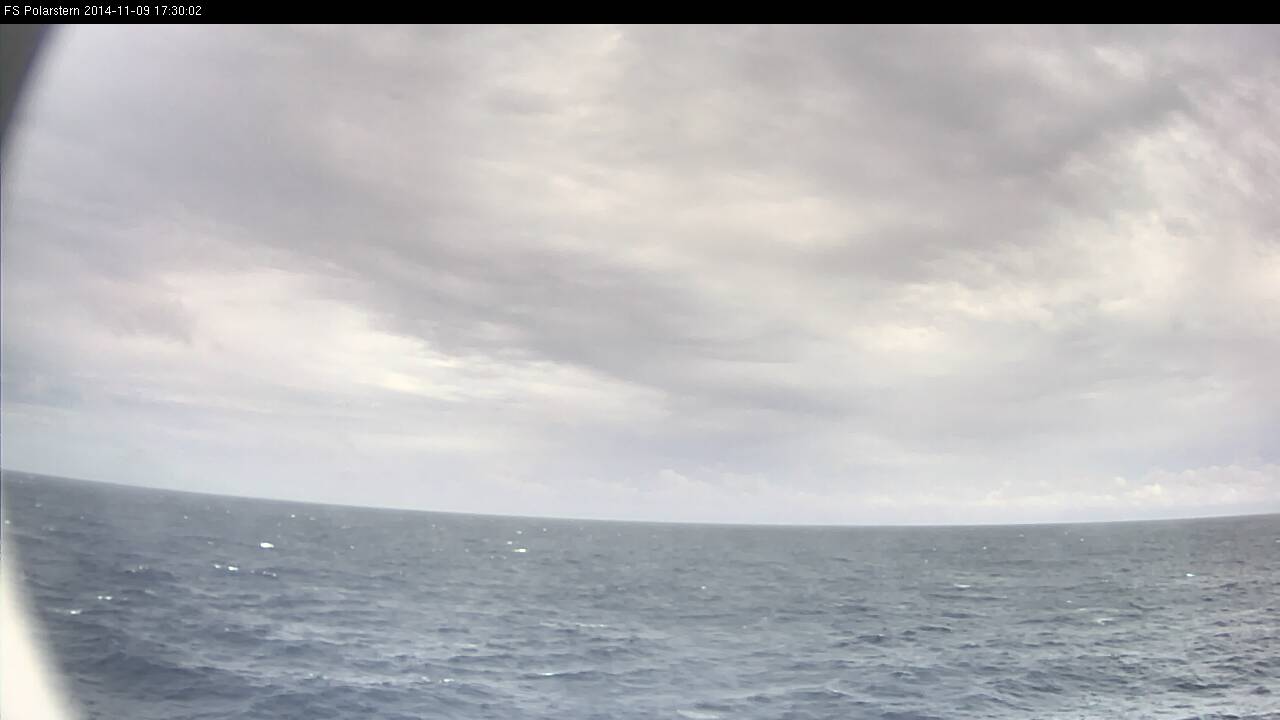
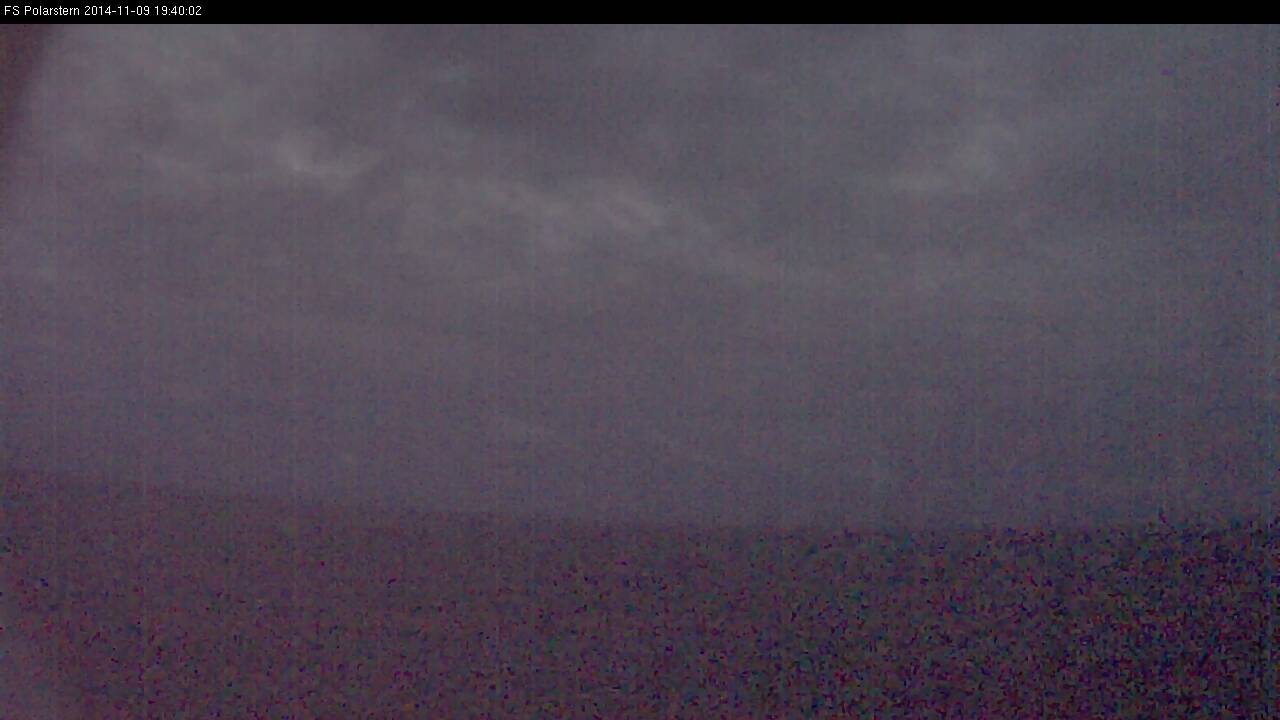
Figure L2-11 a), b) and c): 9 Nov 2014, from top to bottom: 12:10 UTC, 13:40 UTC, 15:10 UTC. Source: DWD.
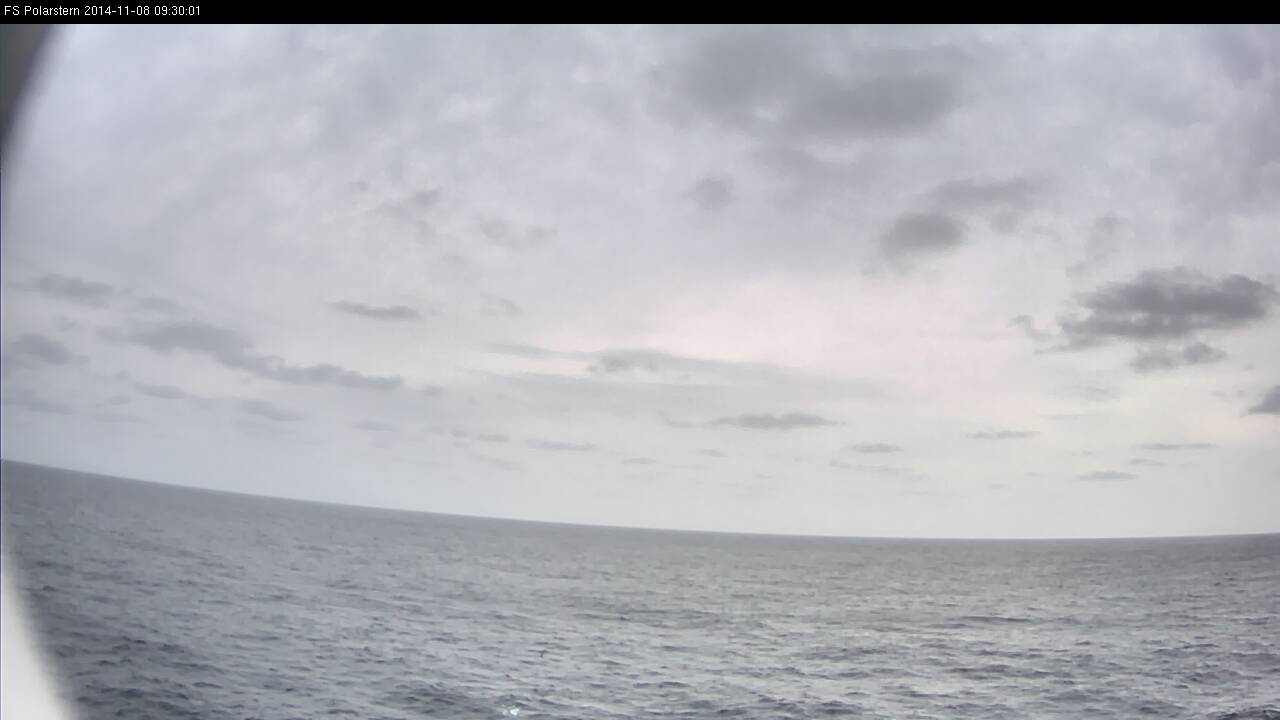
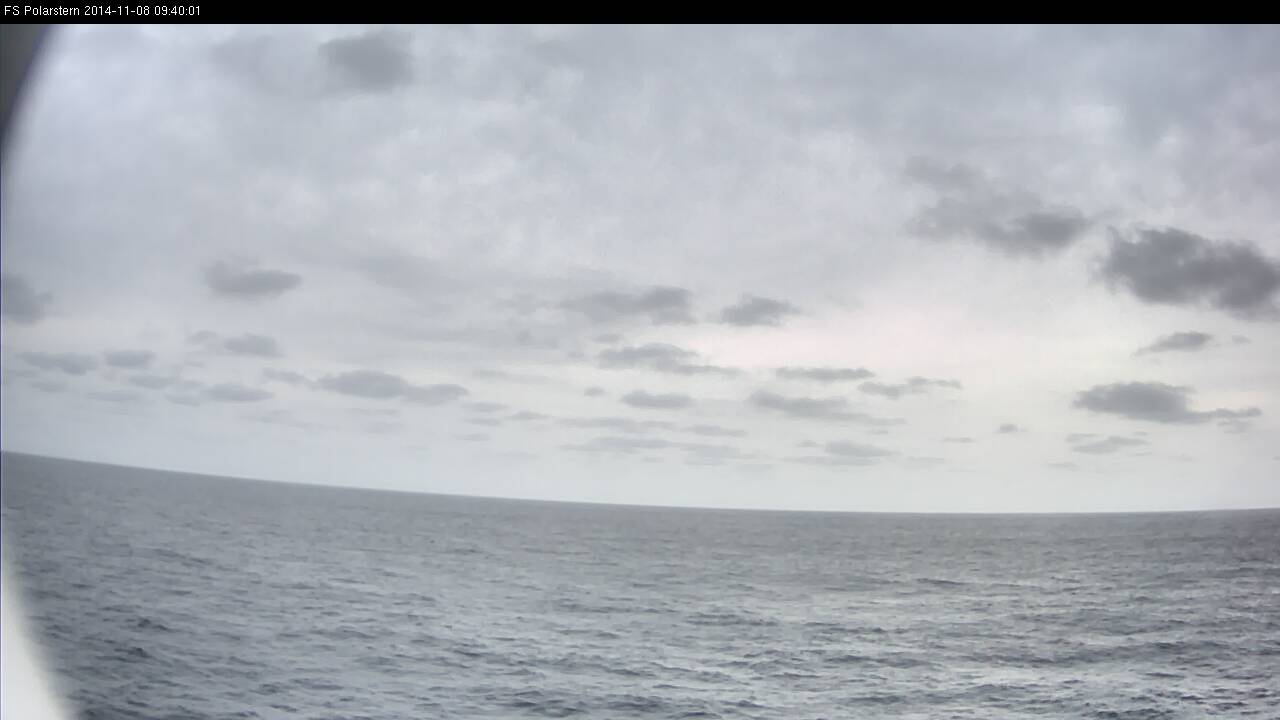
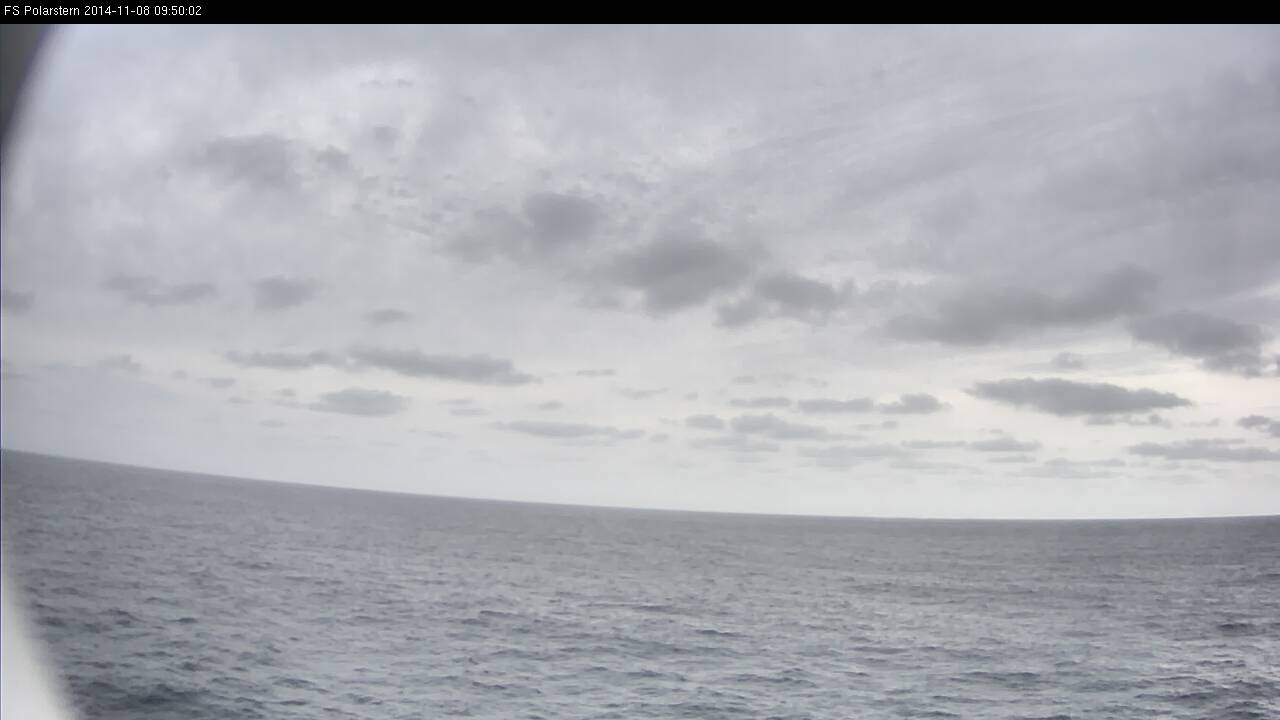
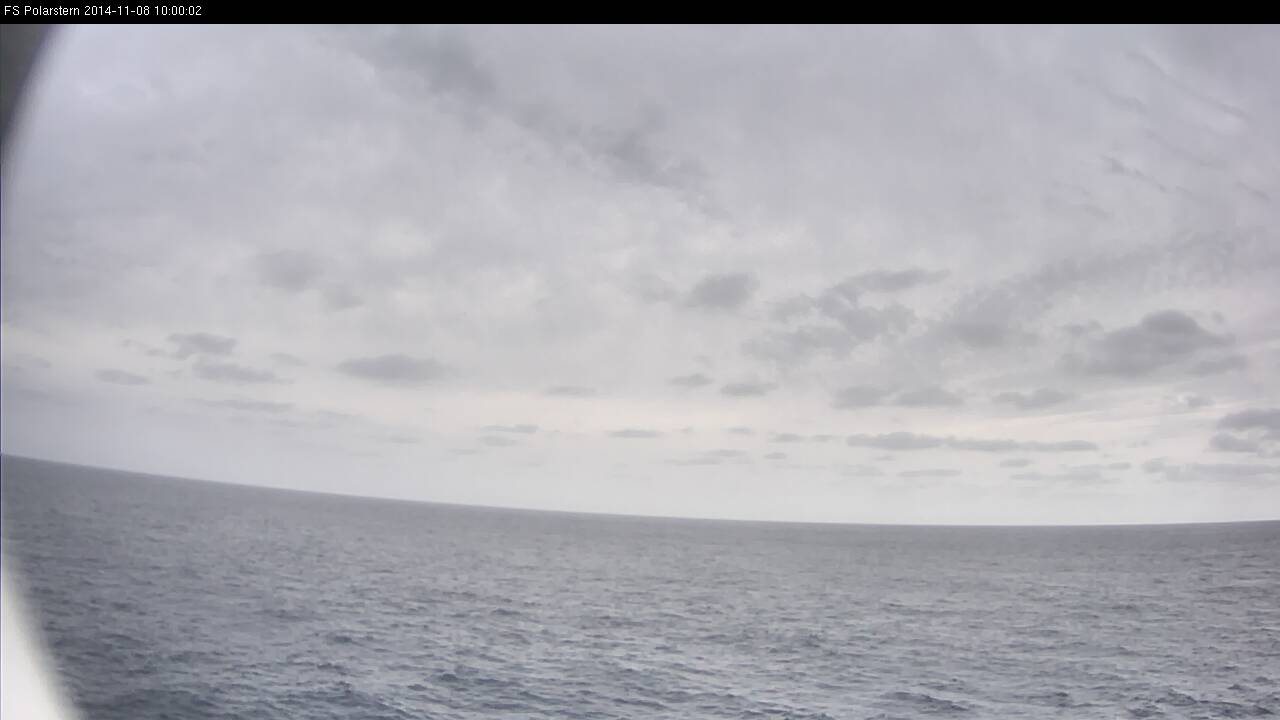
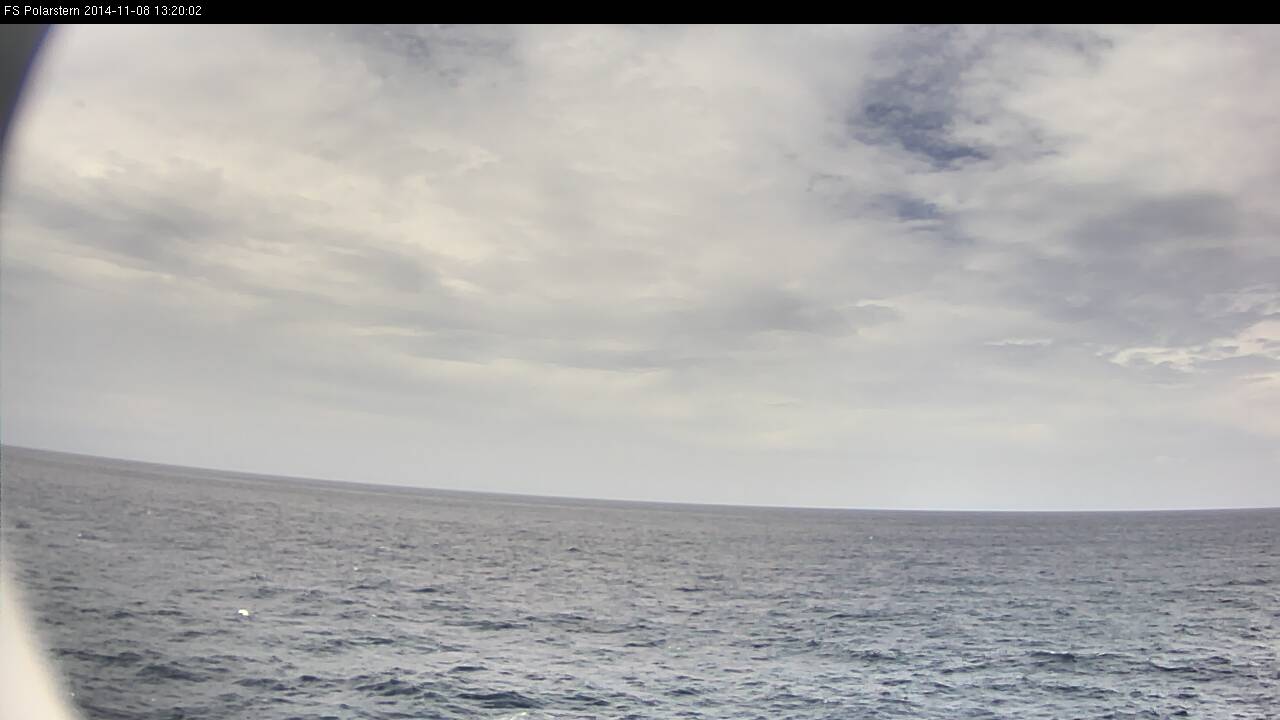
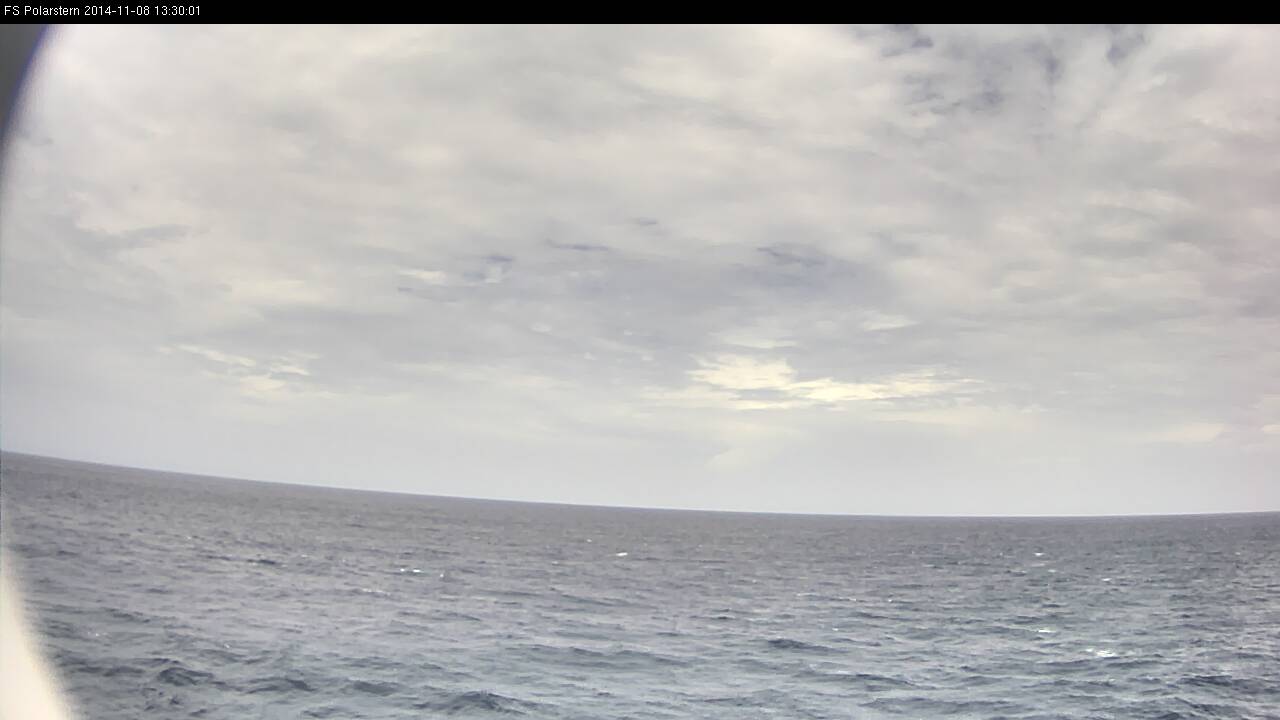
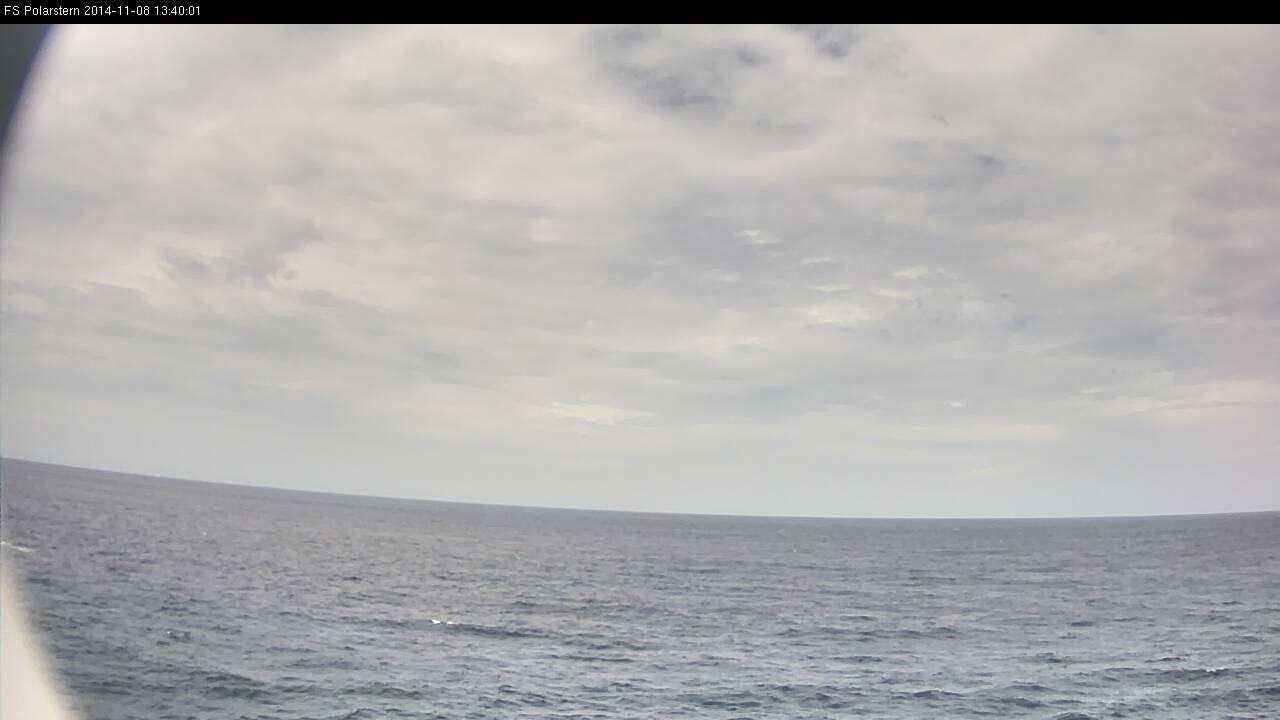
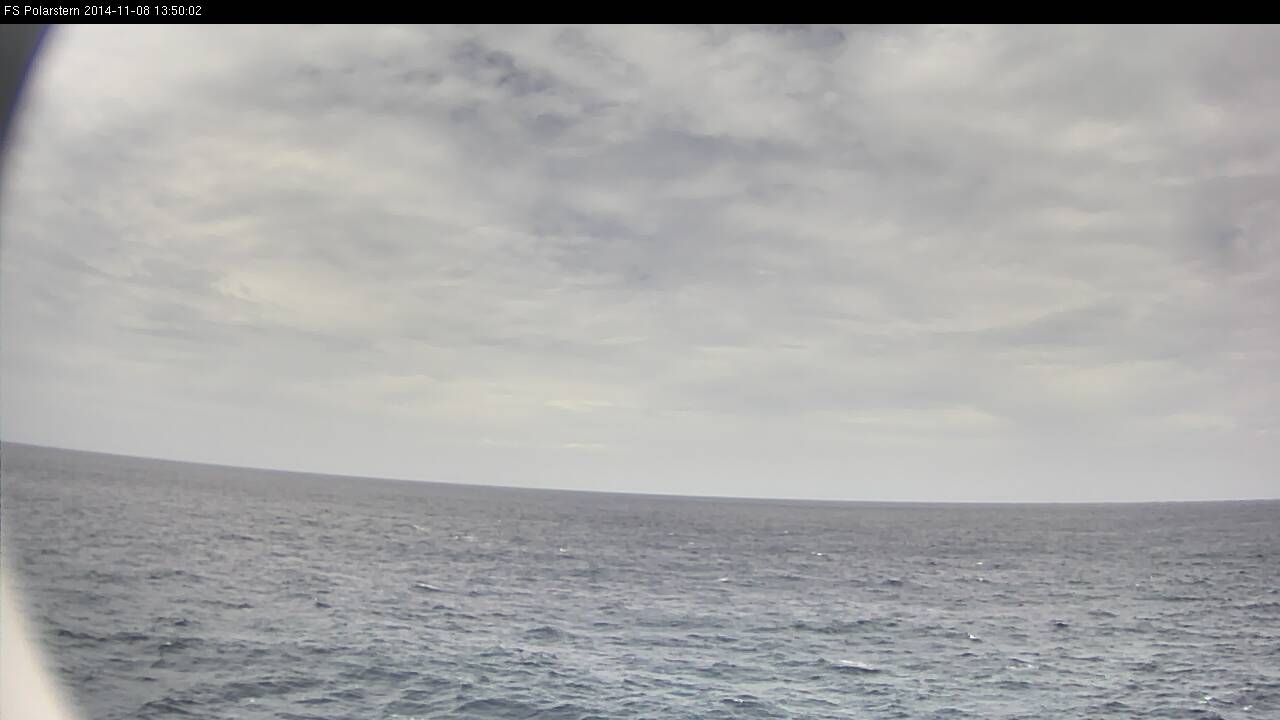
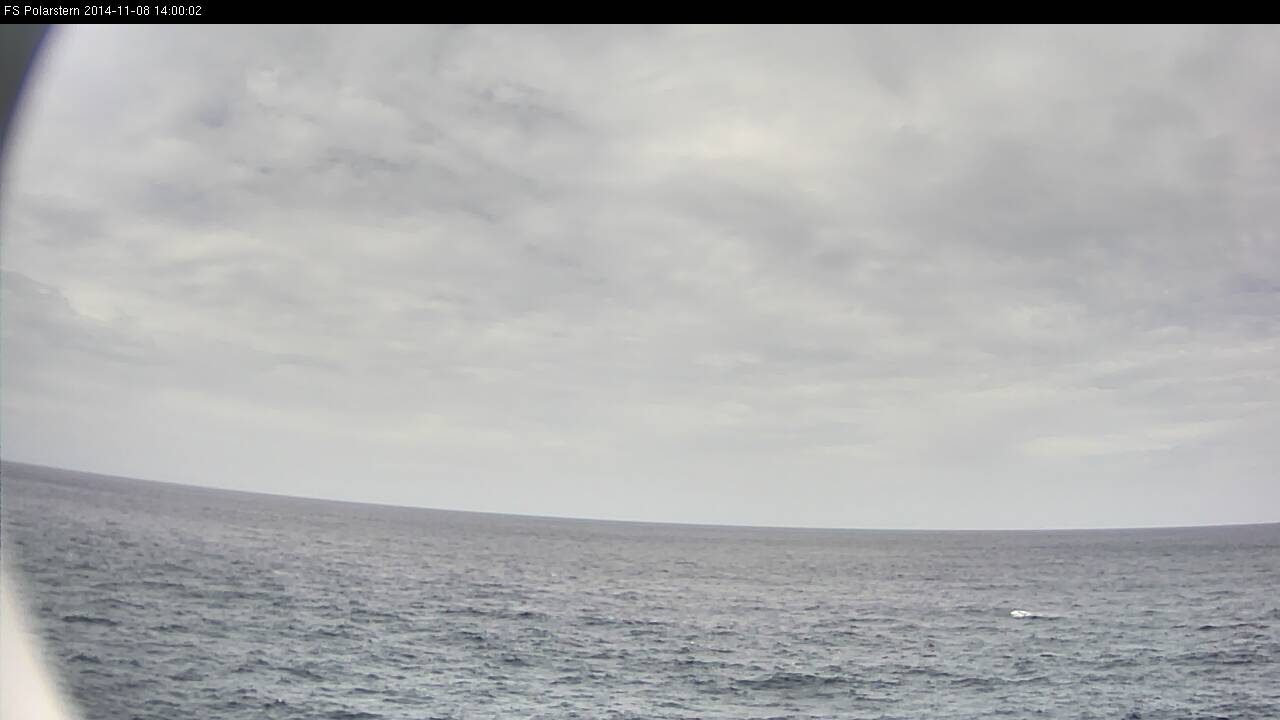
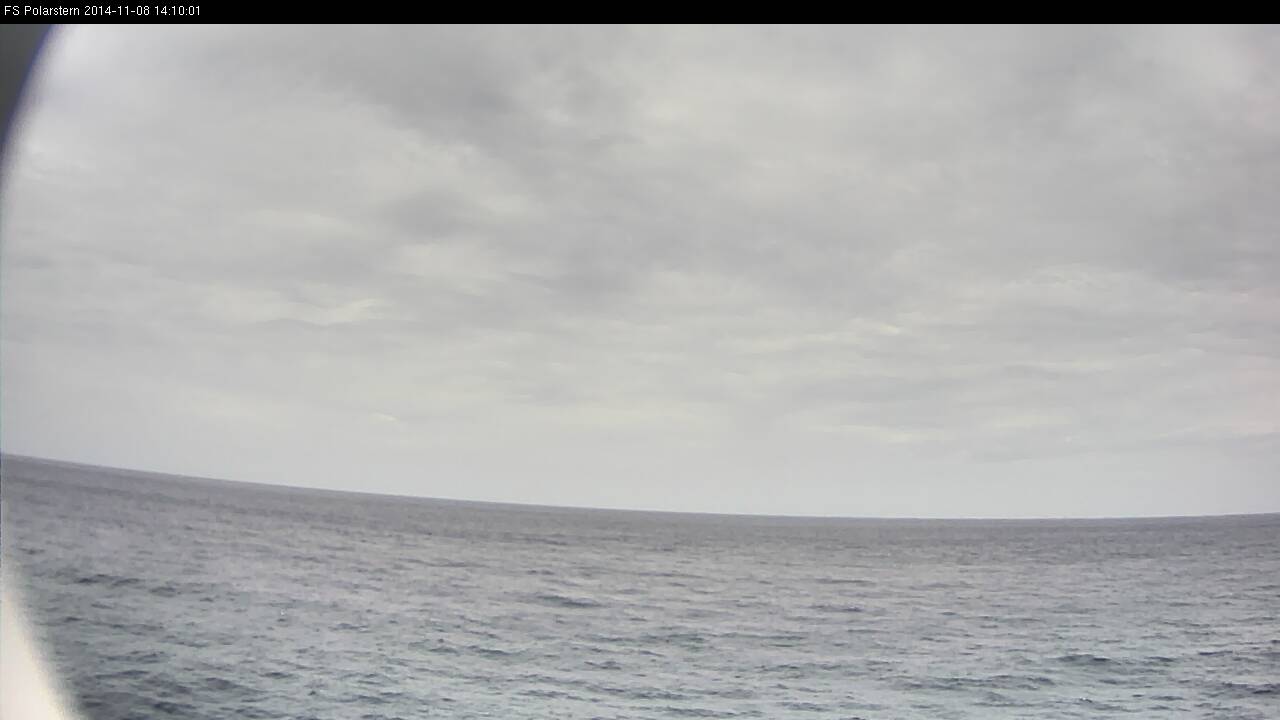
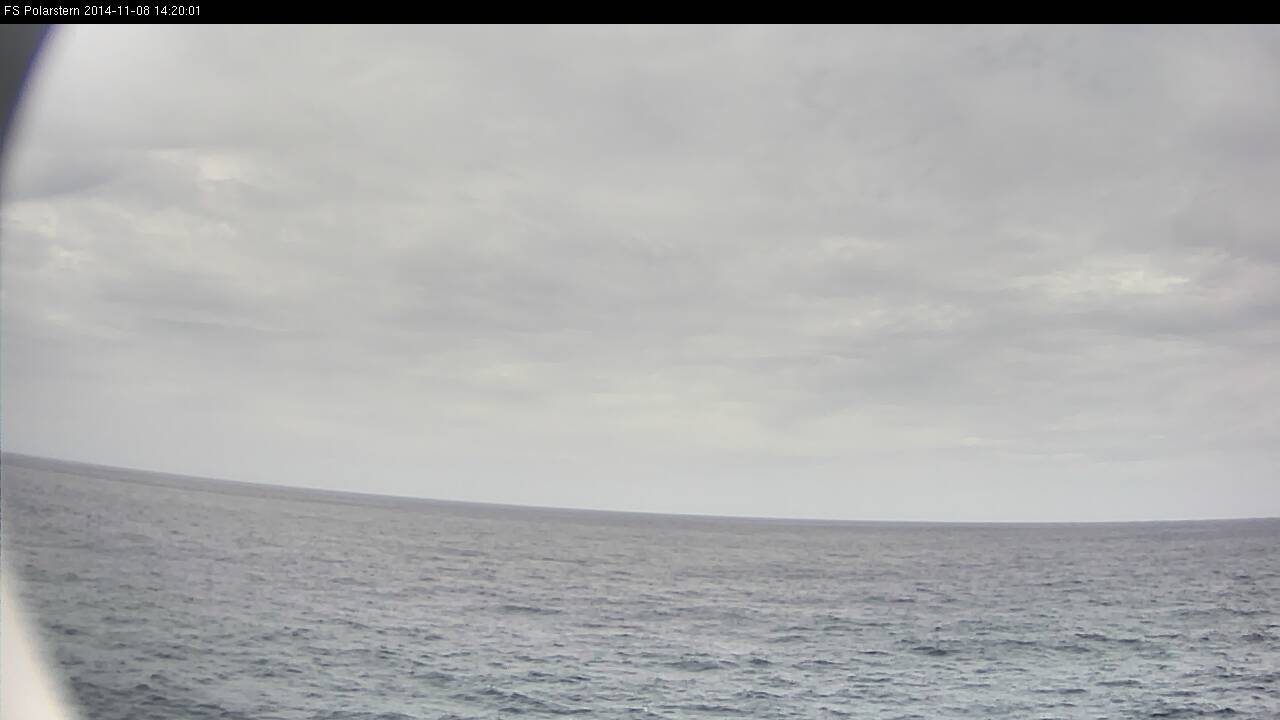
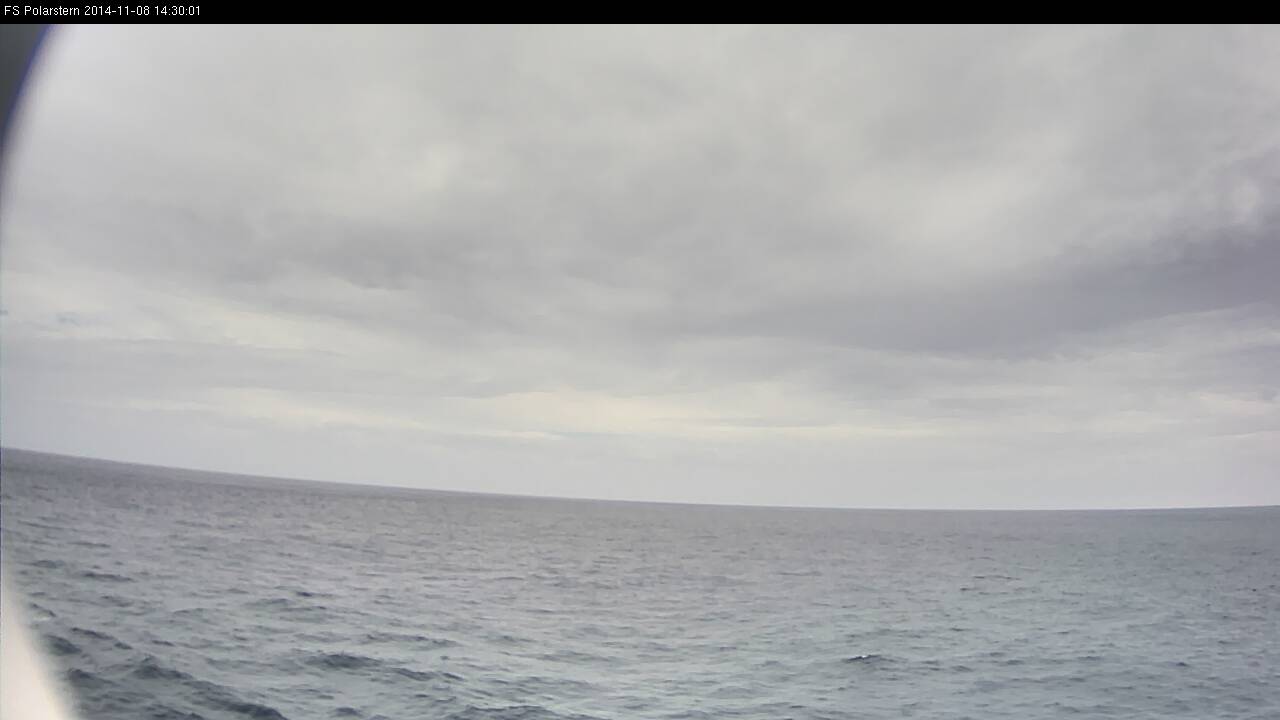
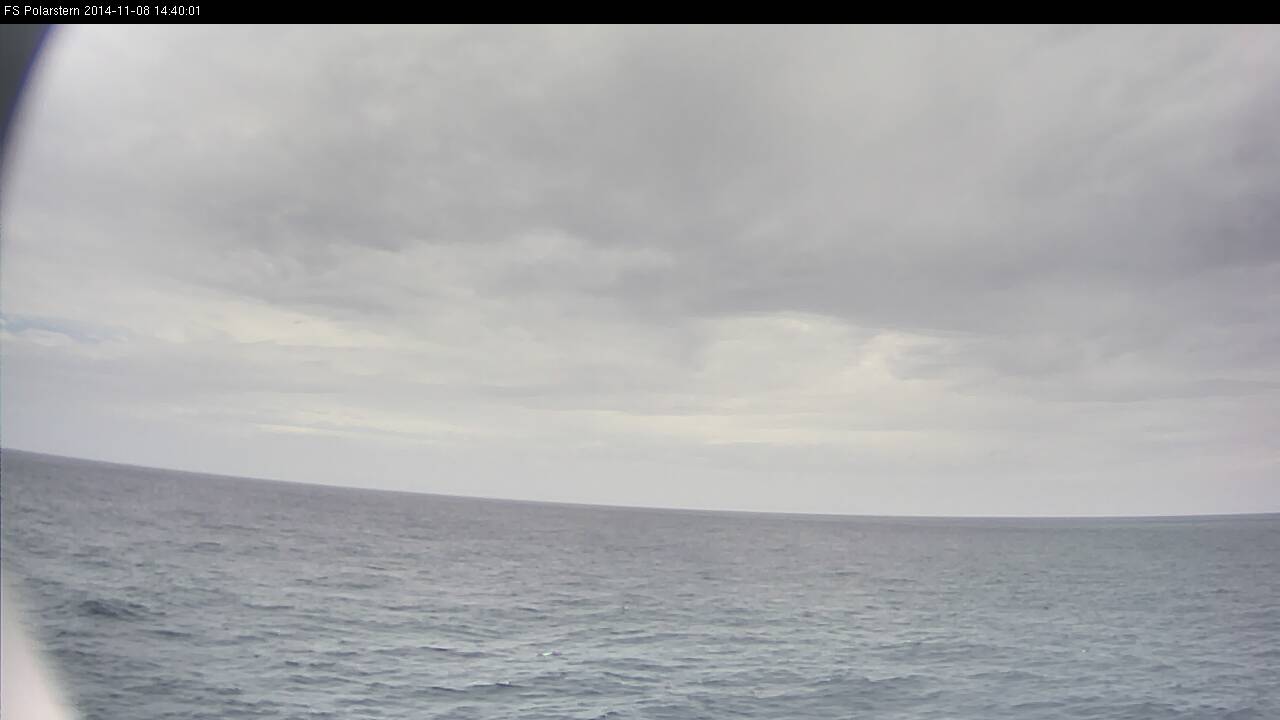
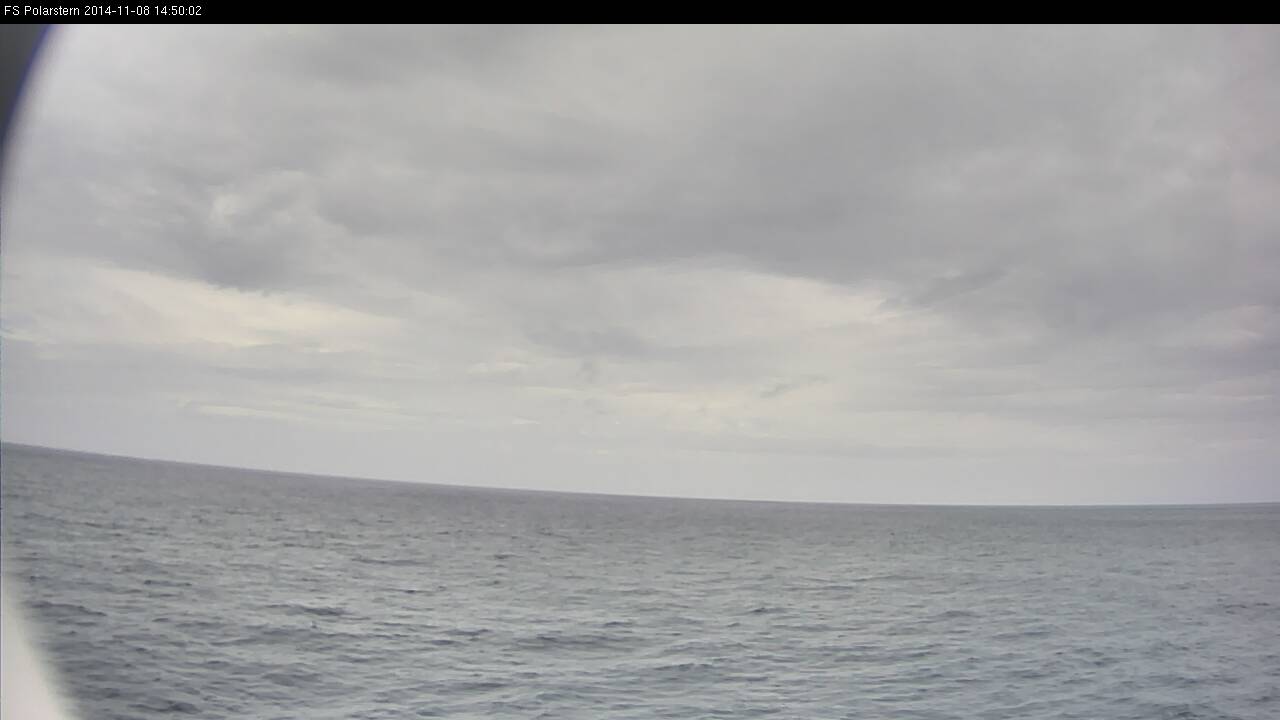
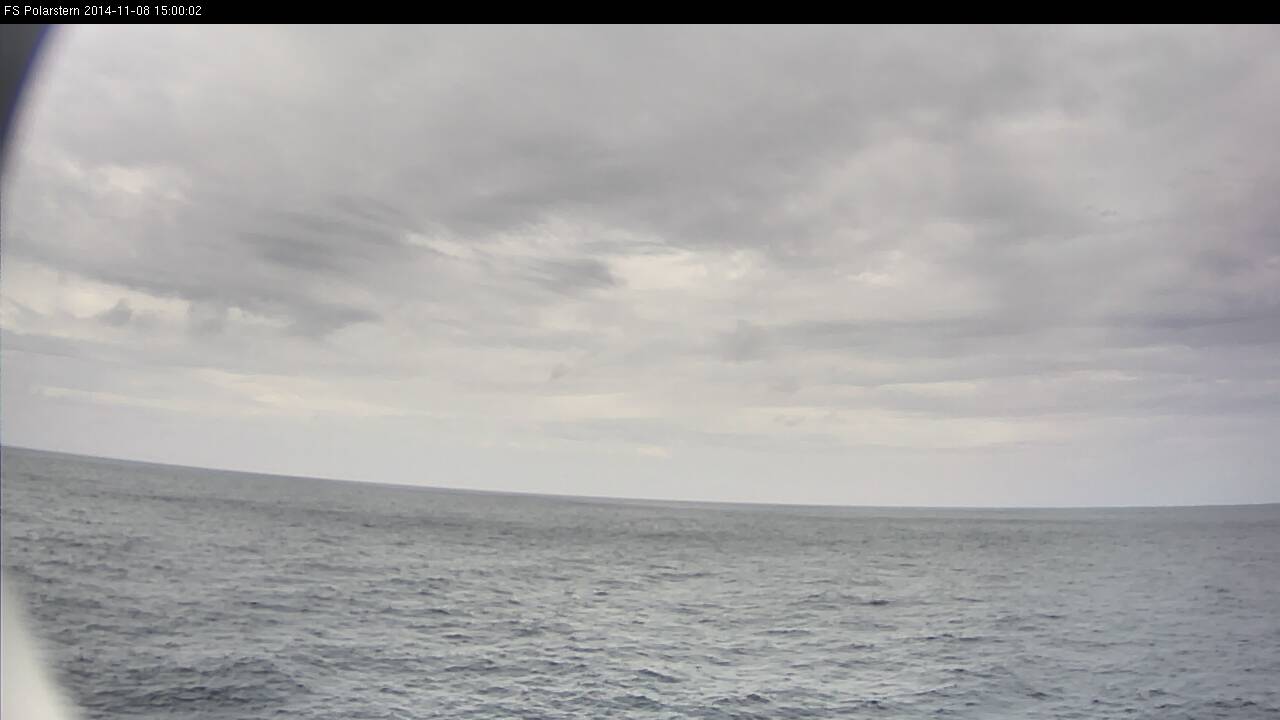
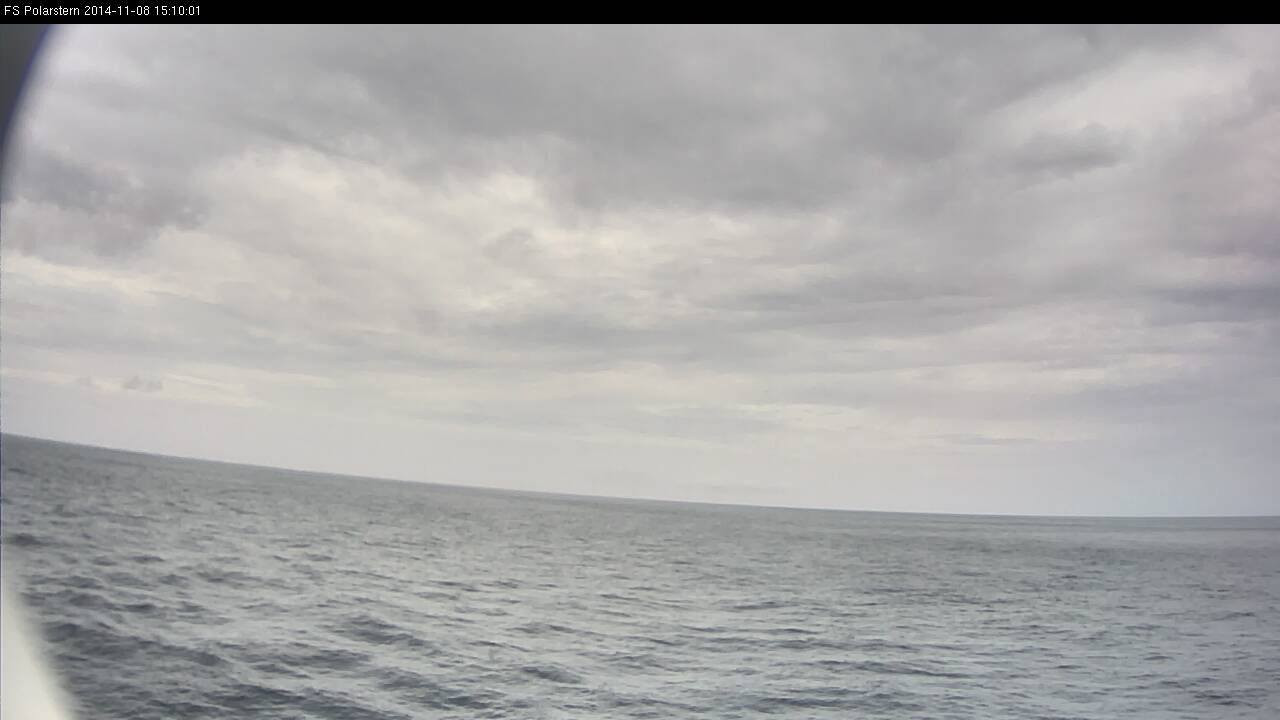
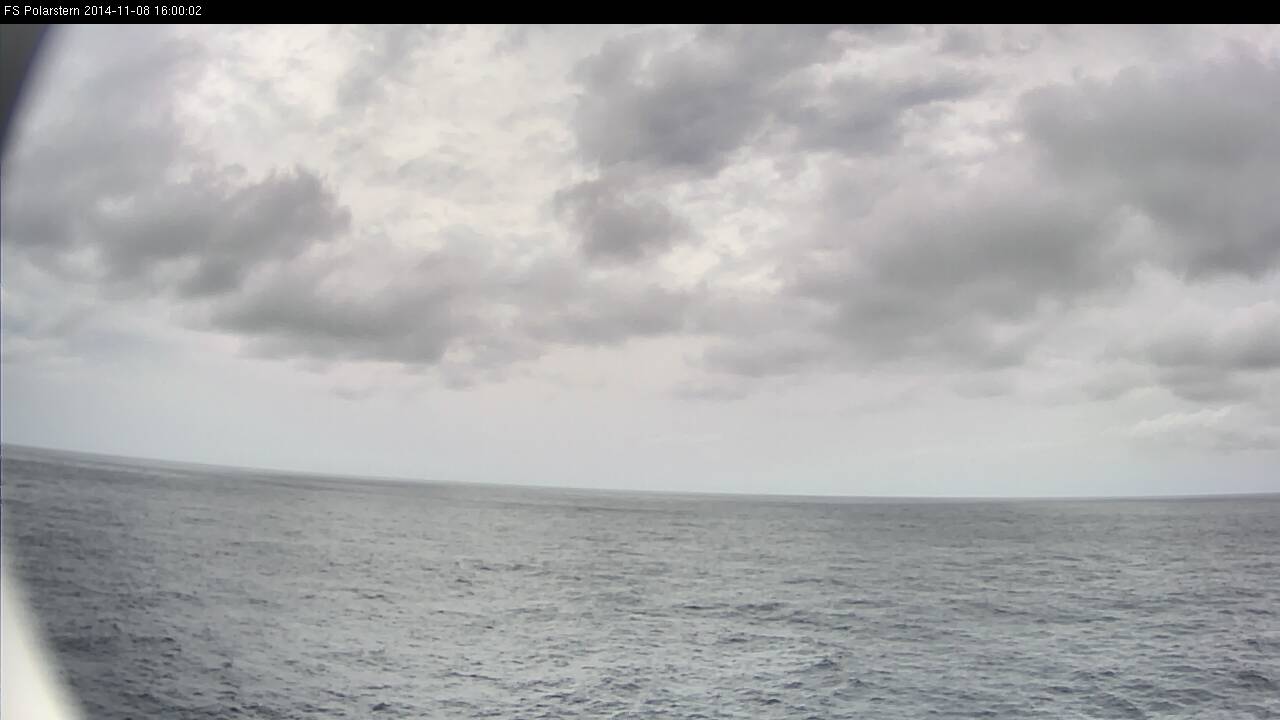
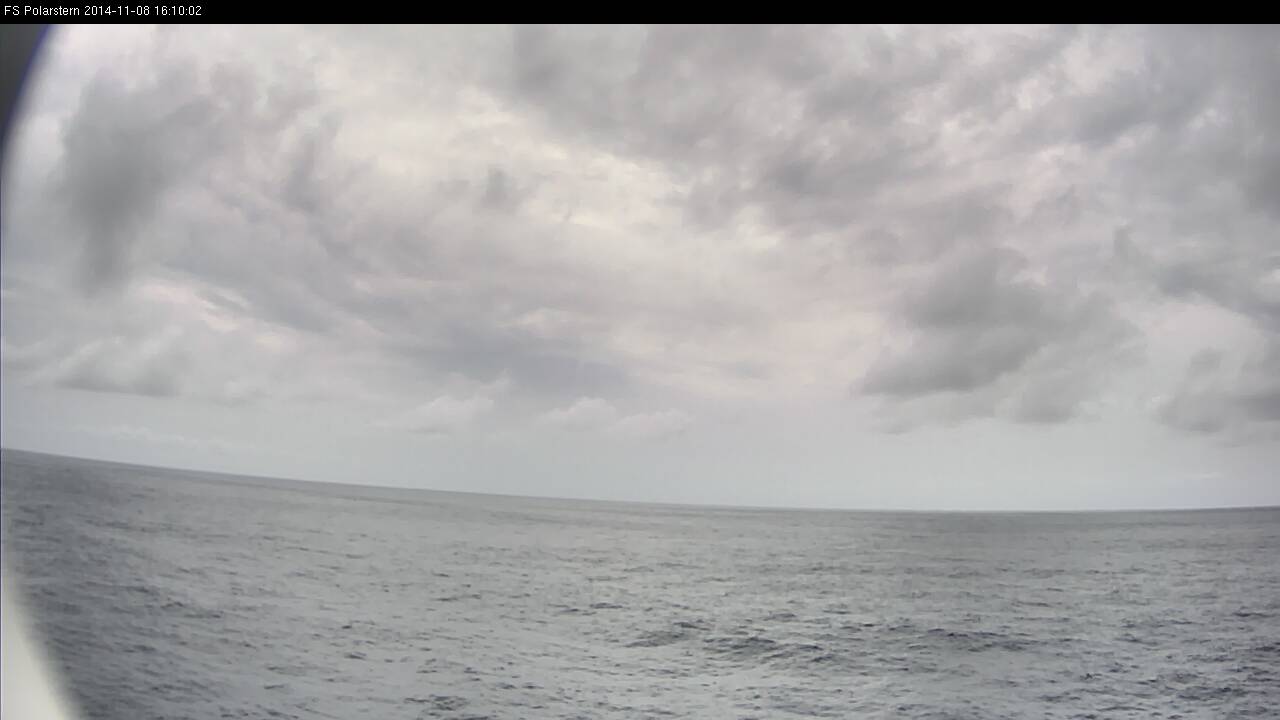
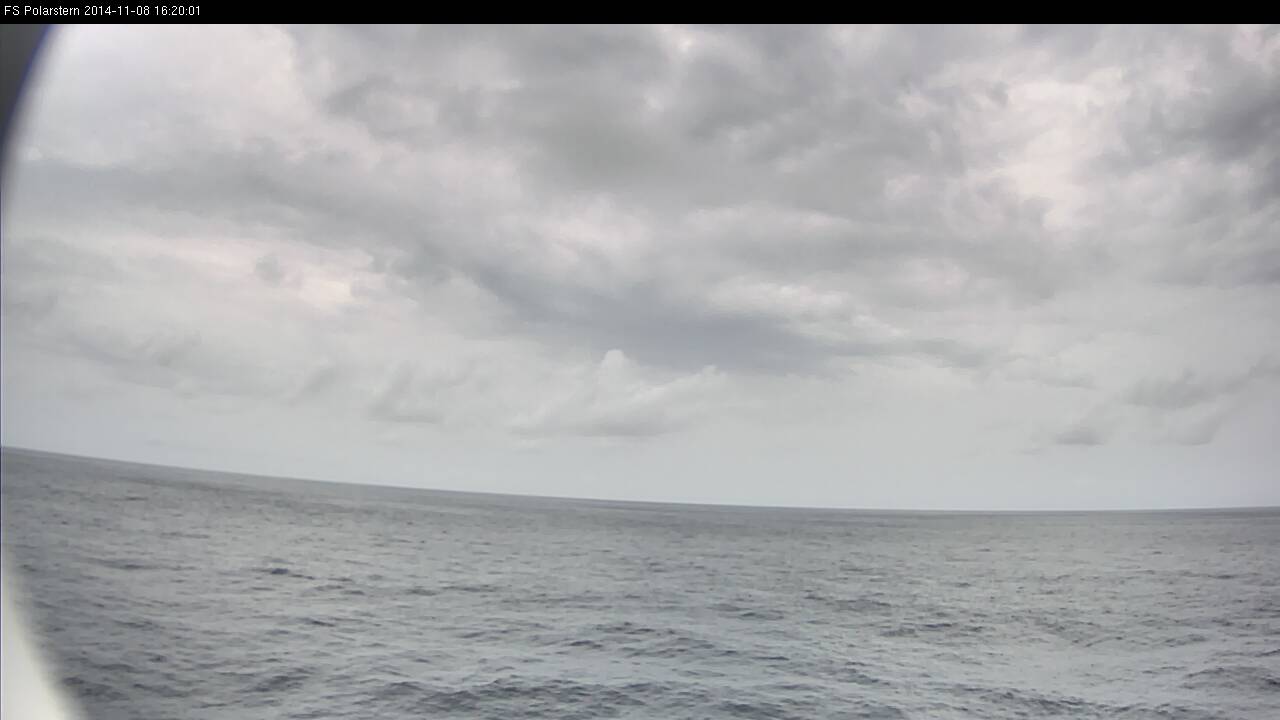
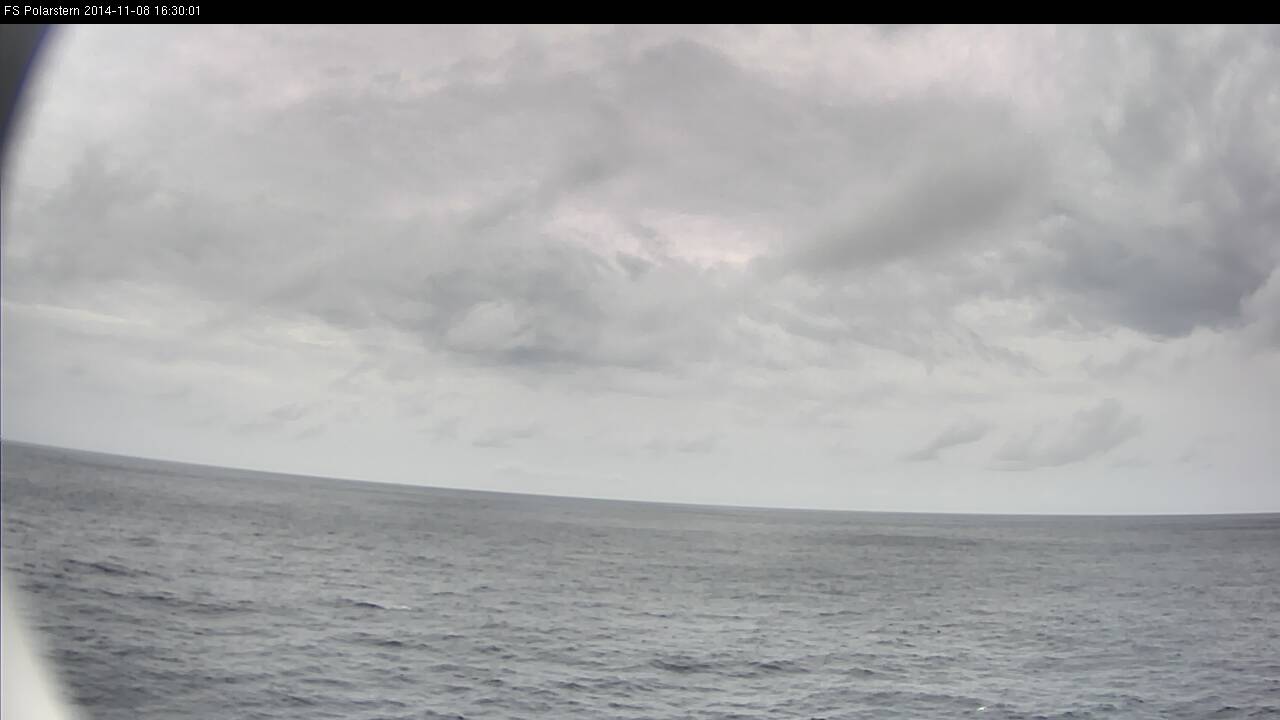
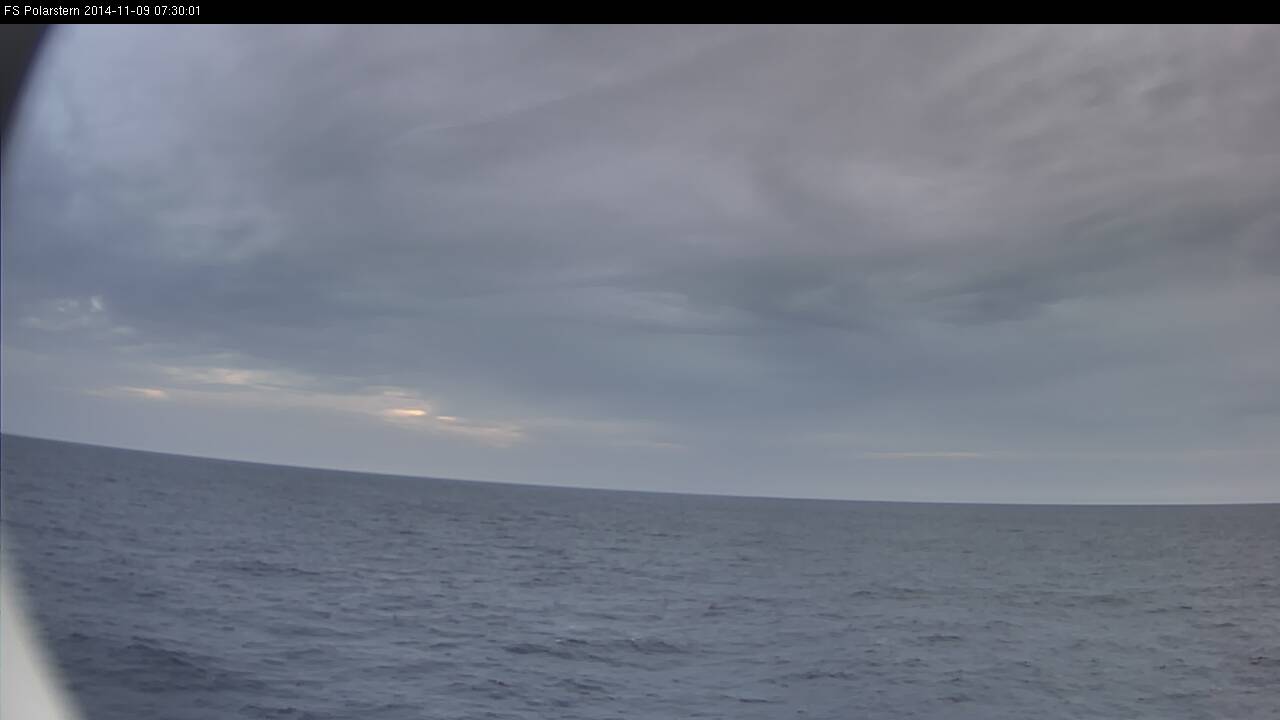
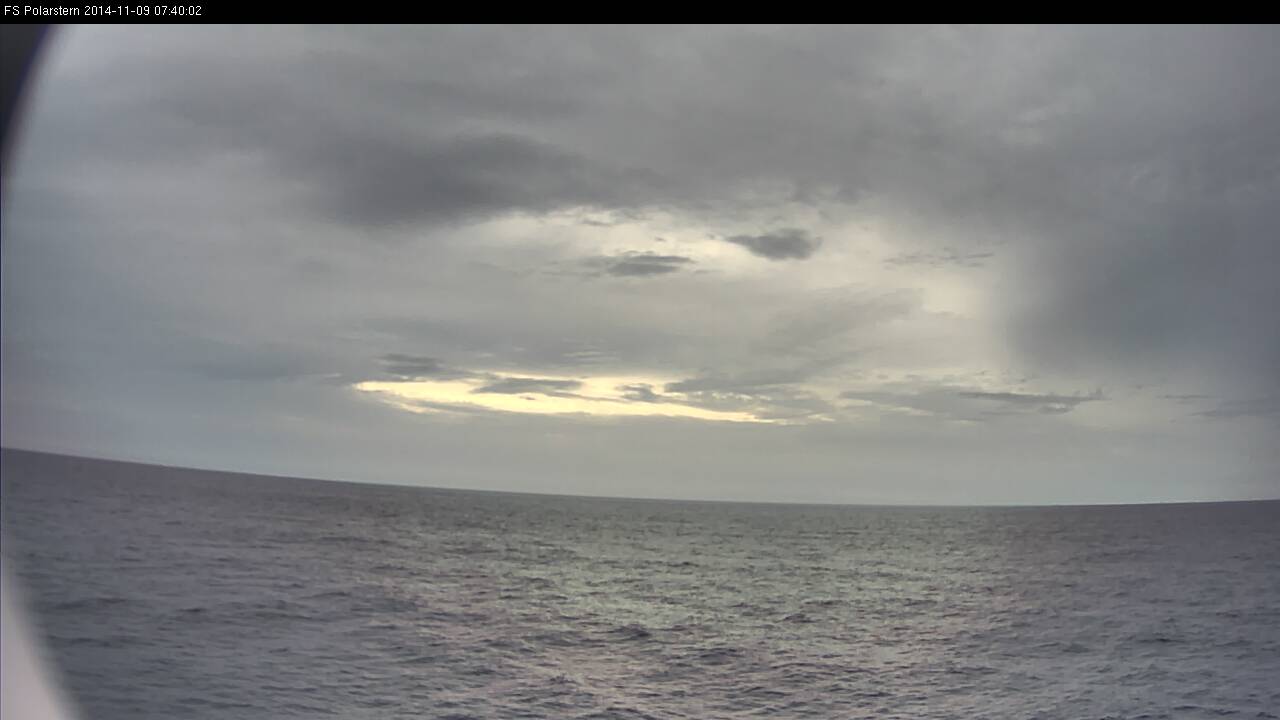
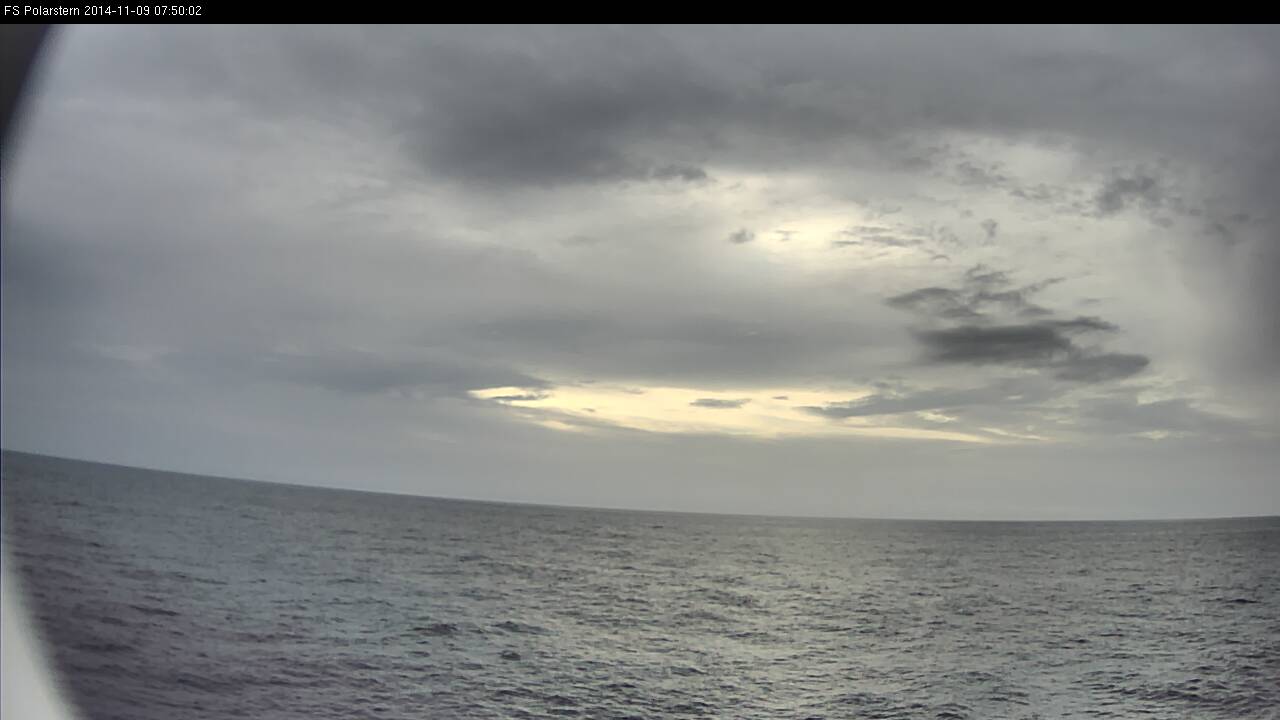
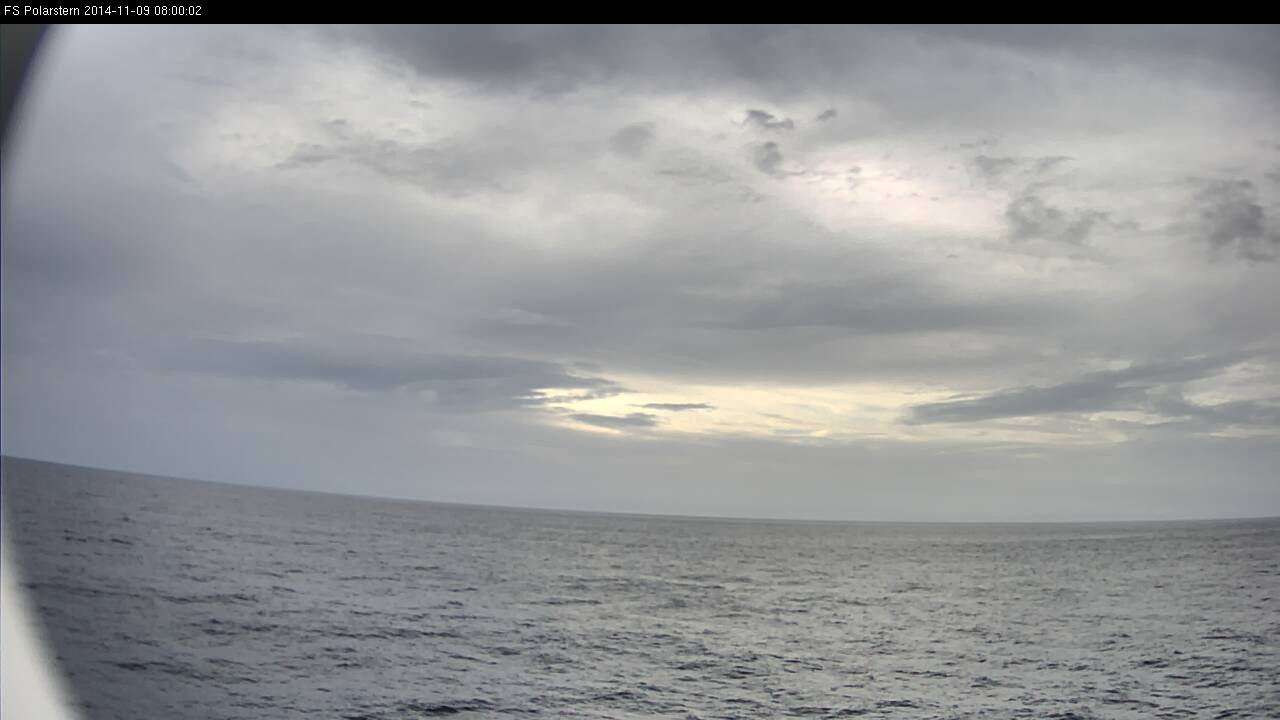
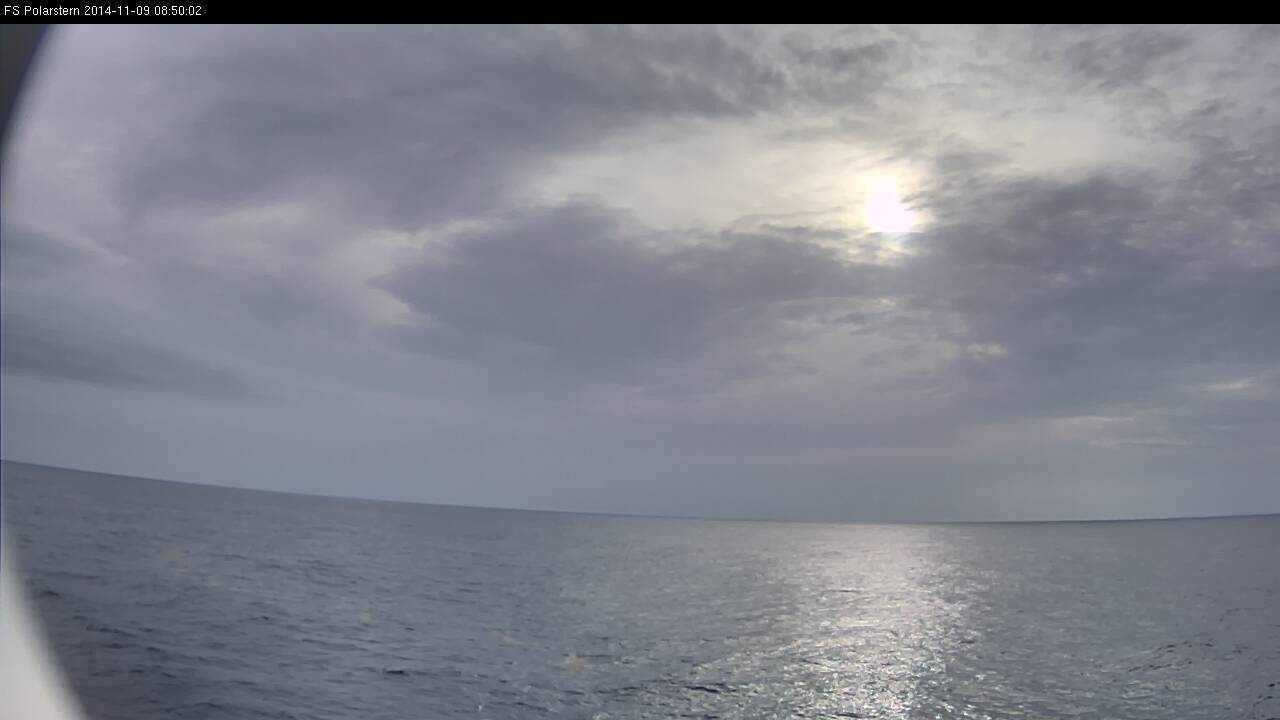
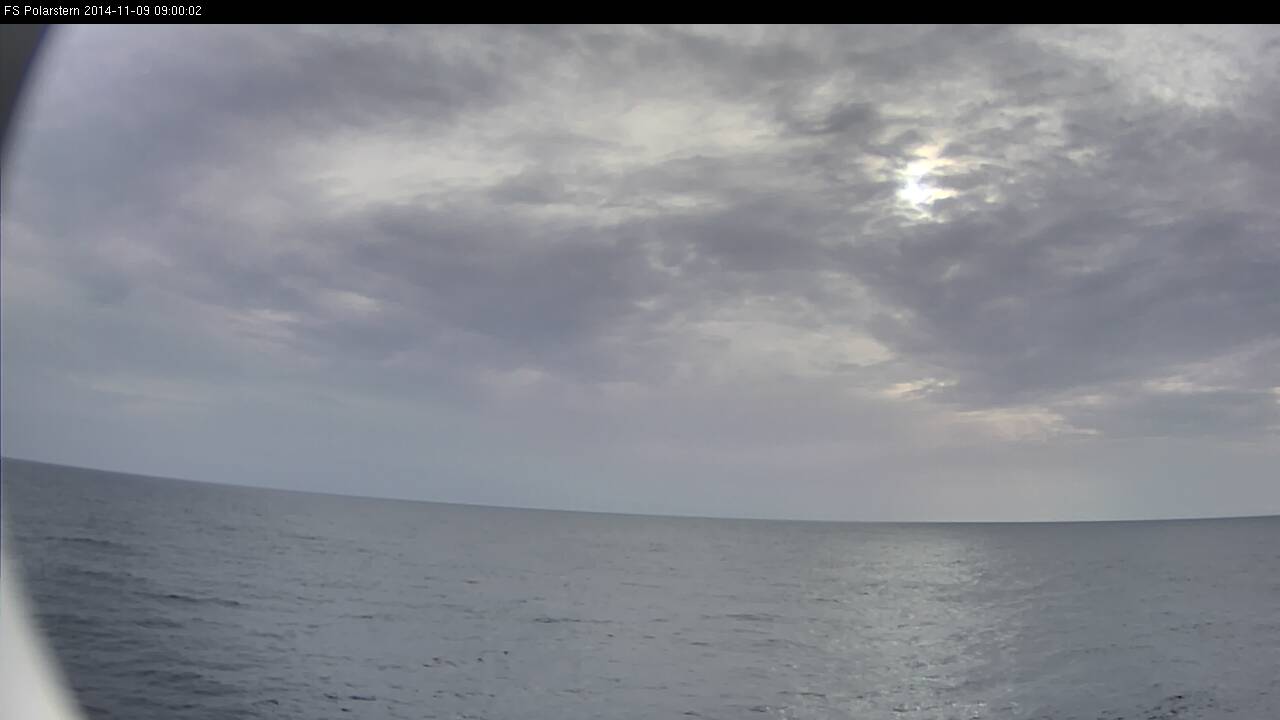
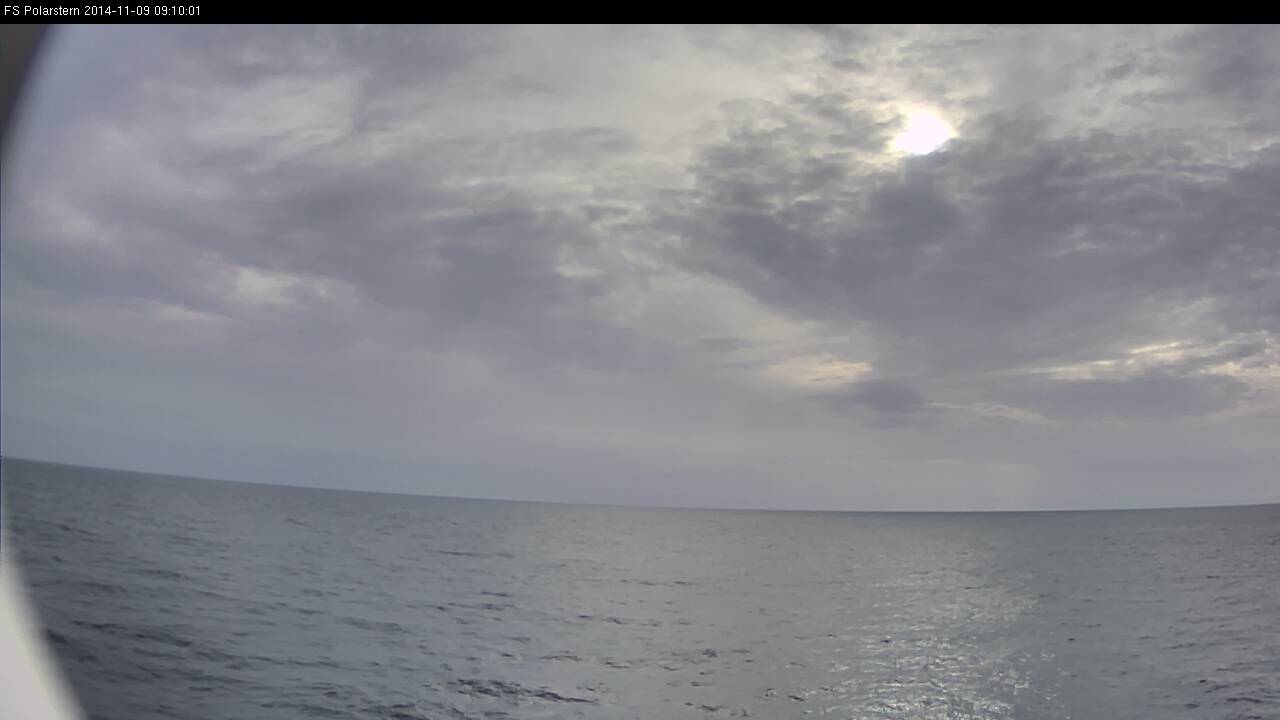
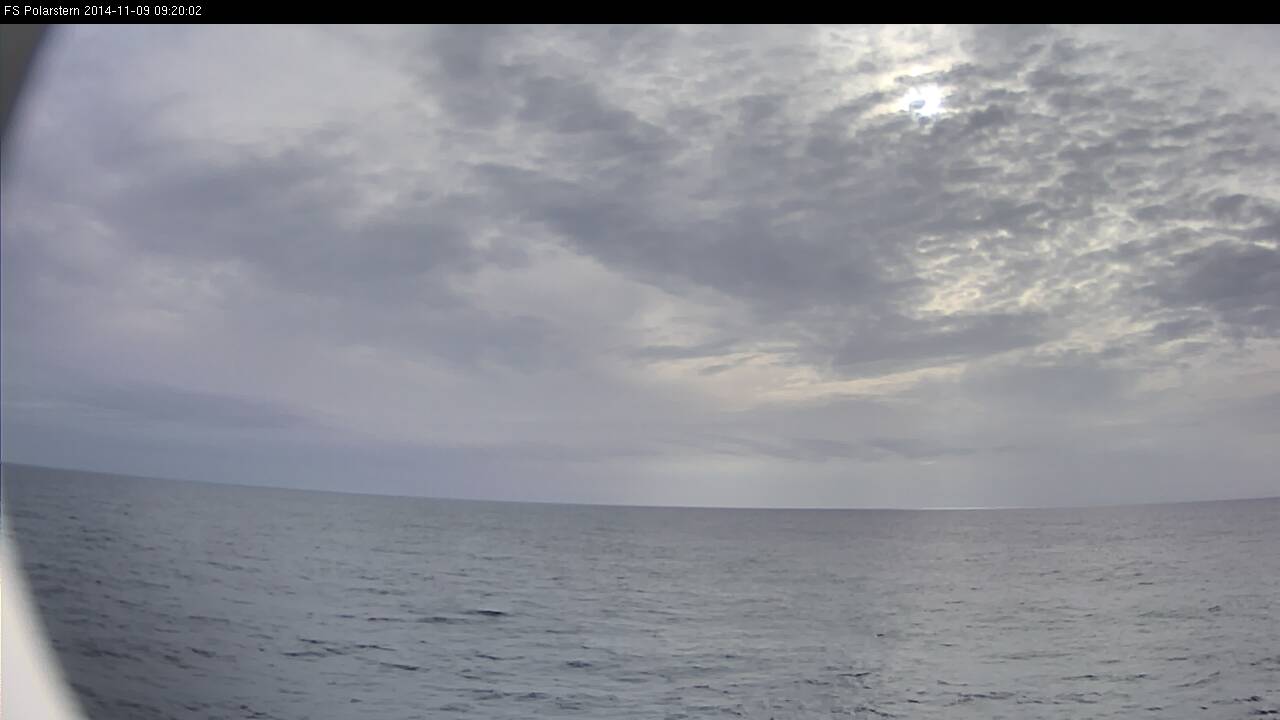
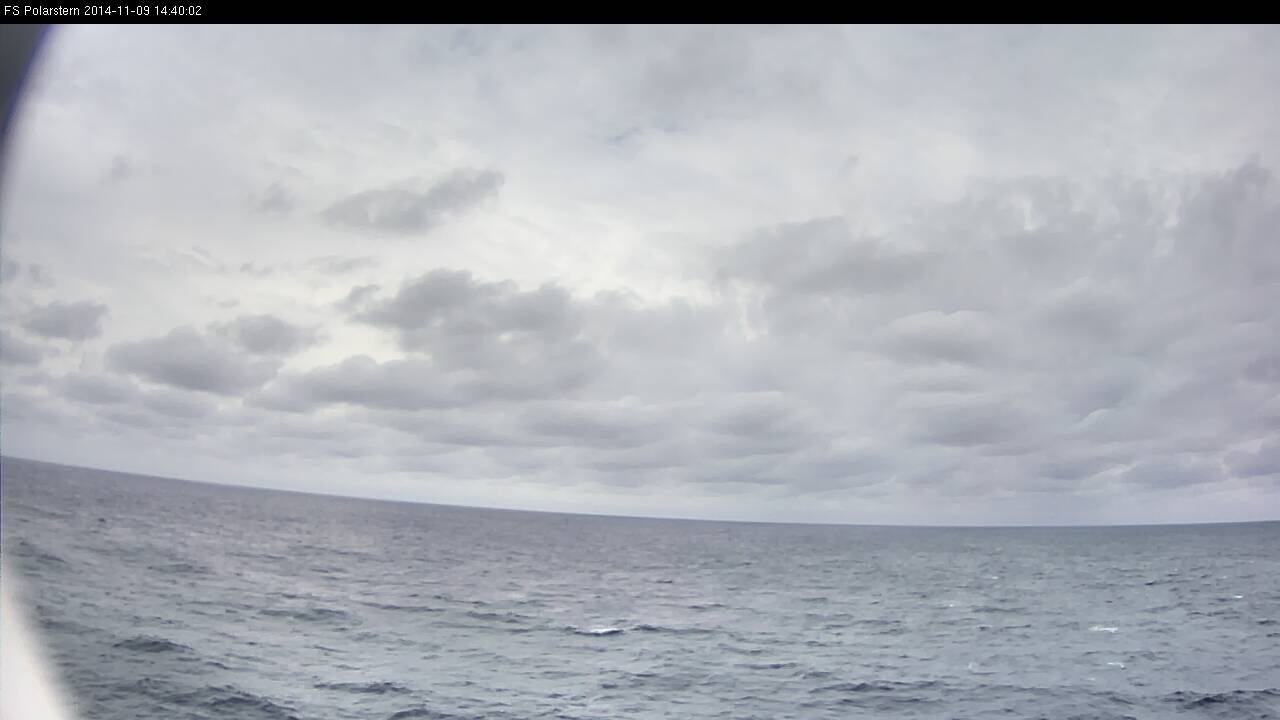
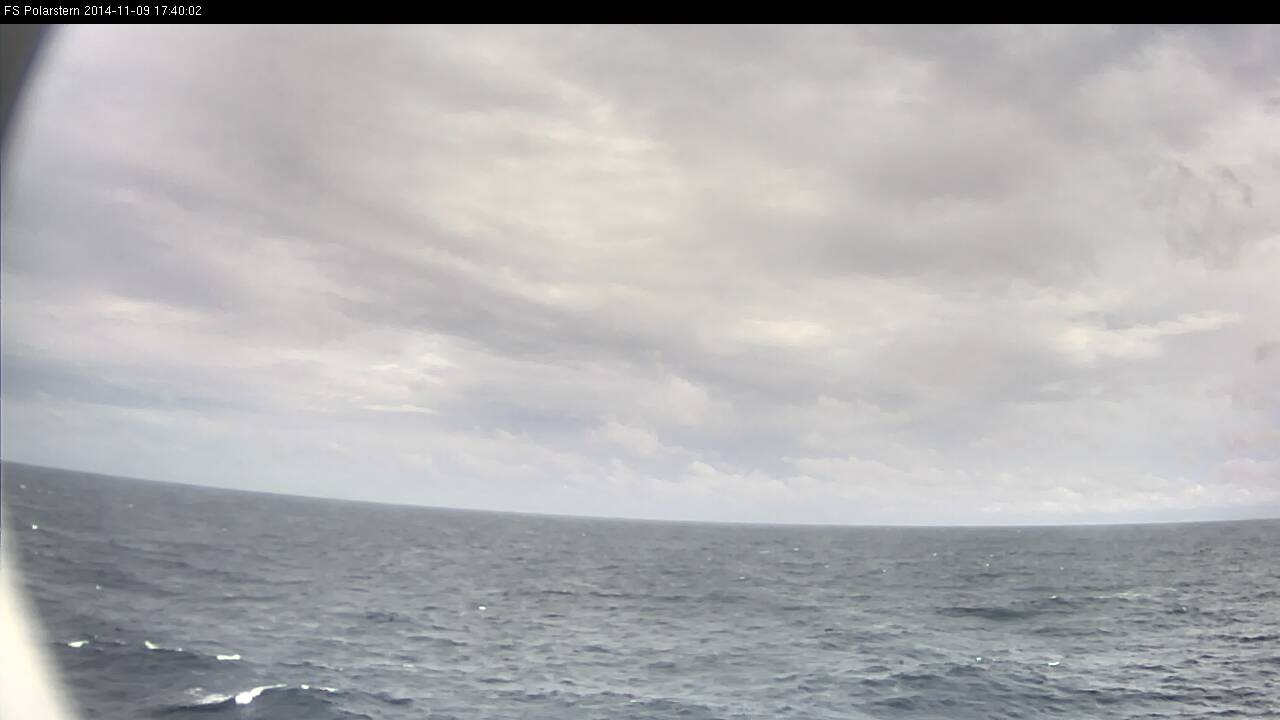
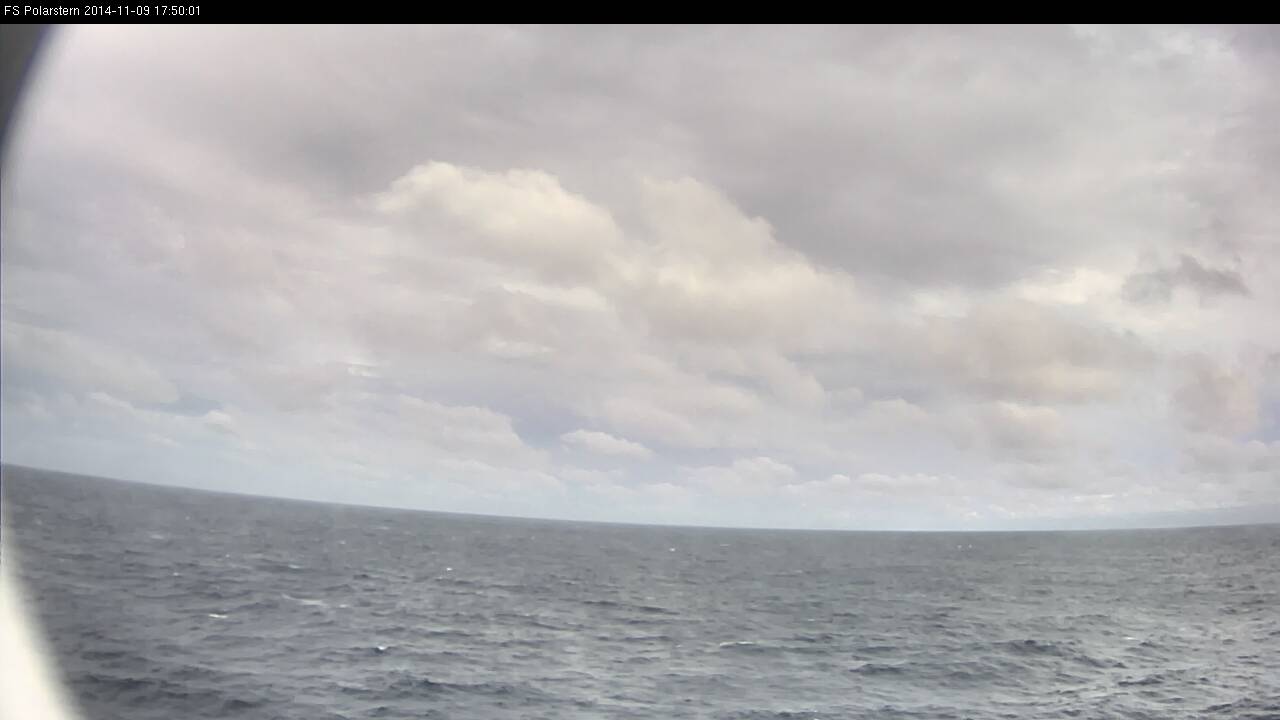
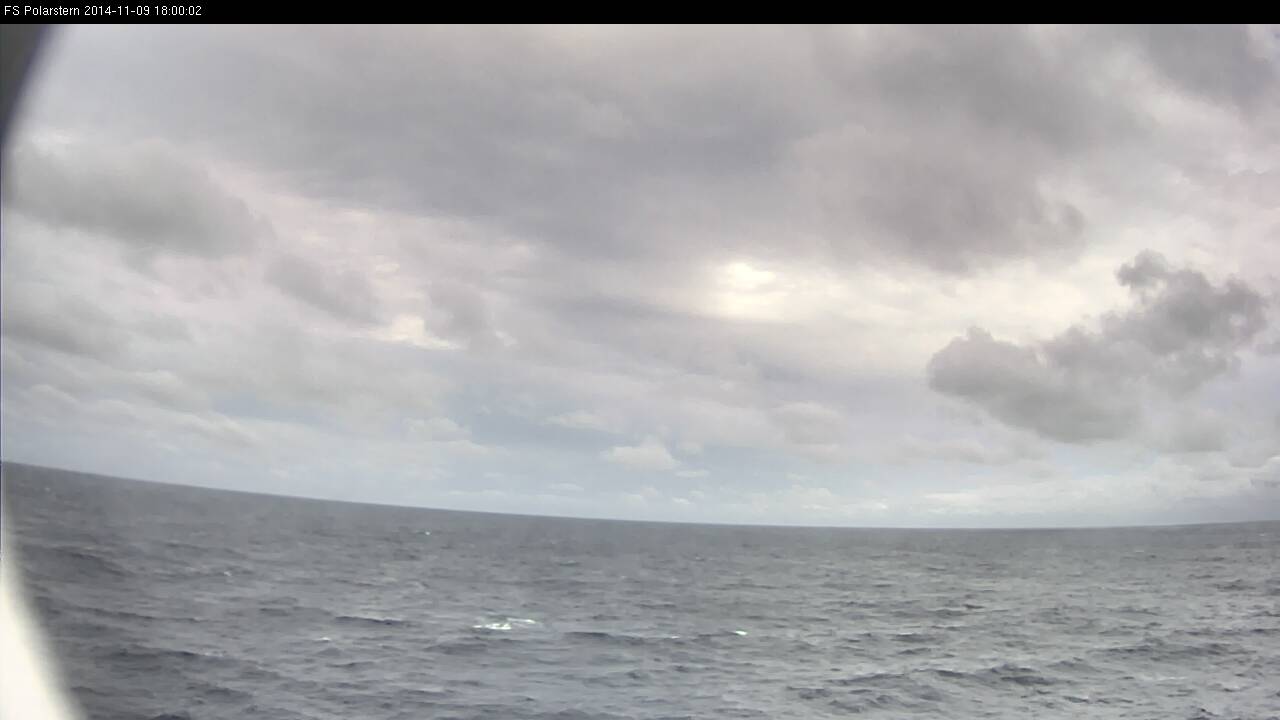
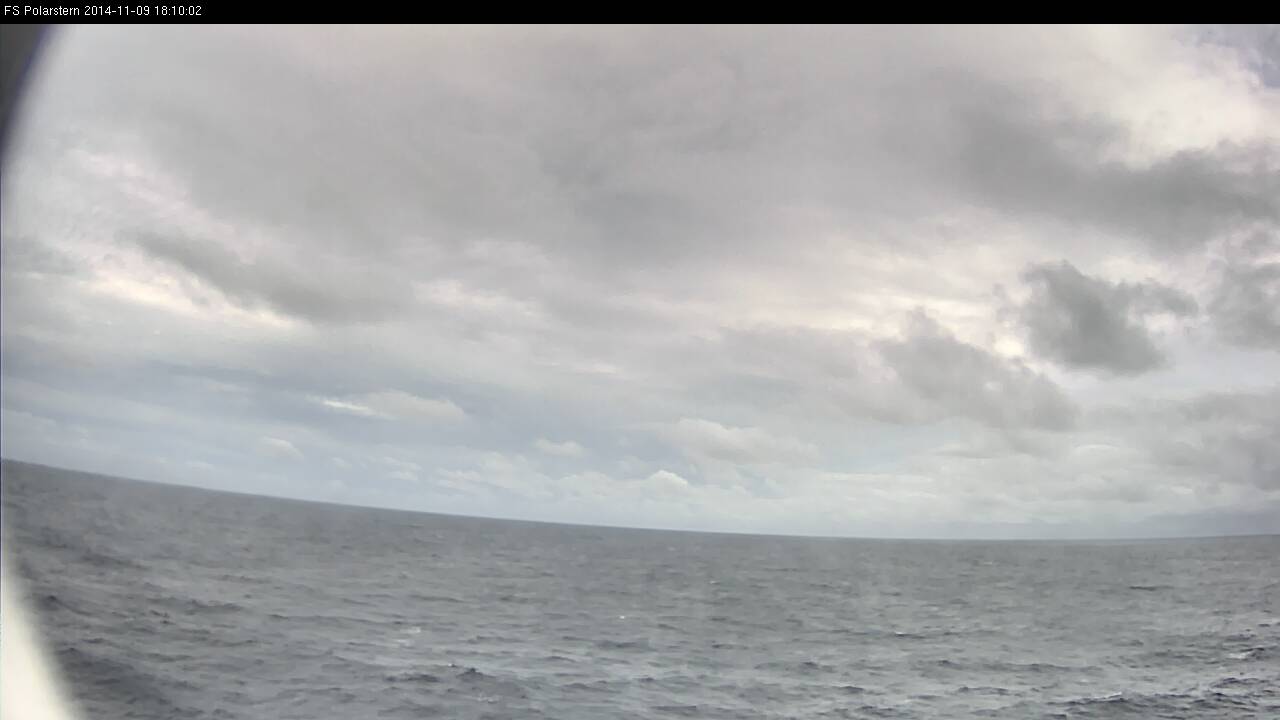
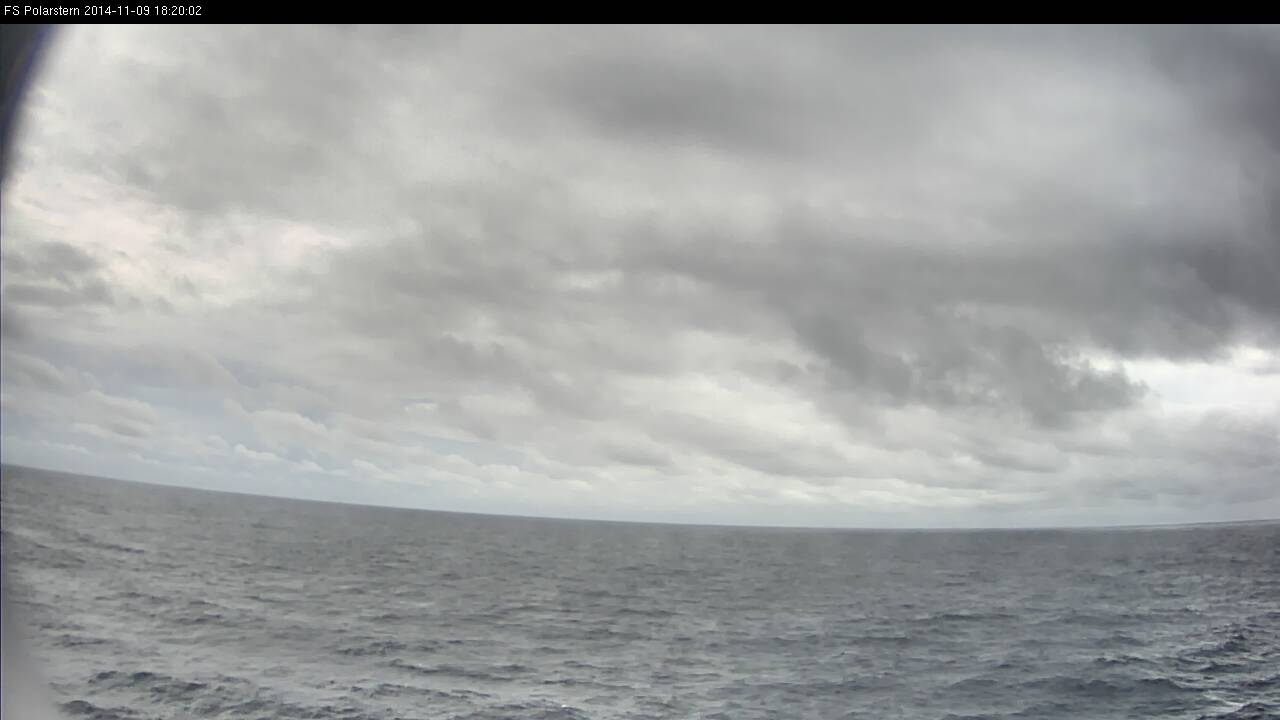
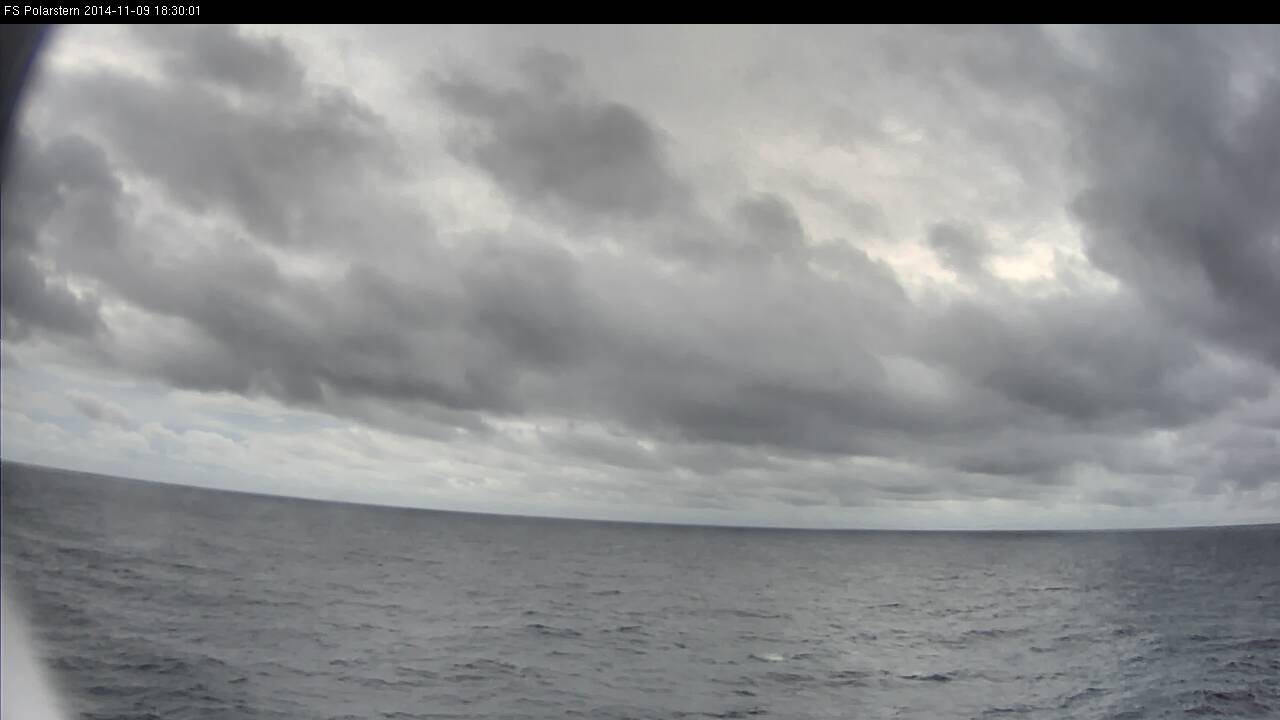
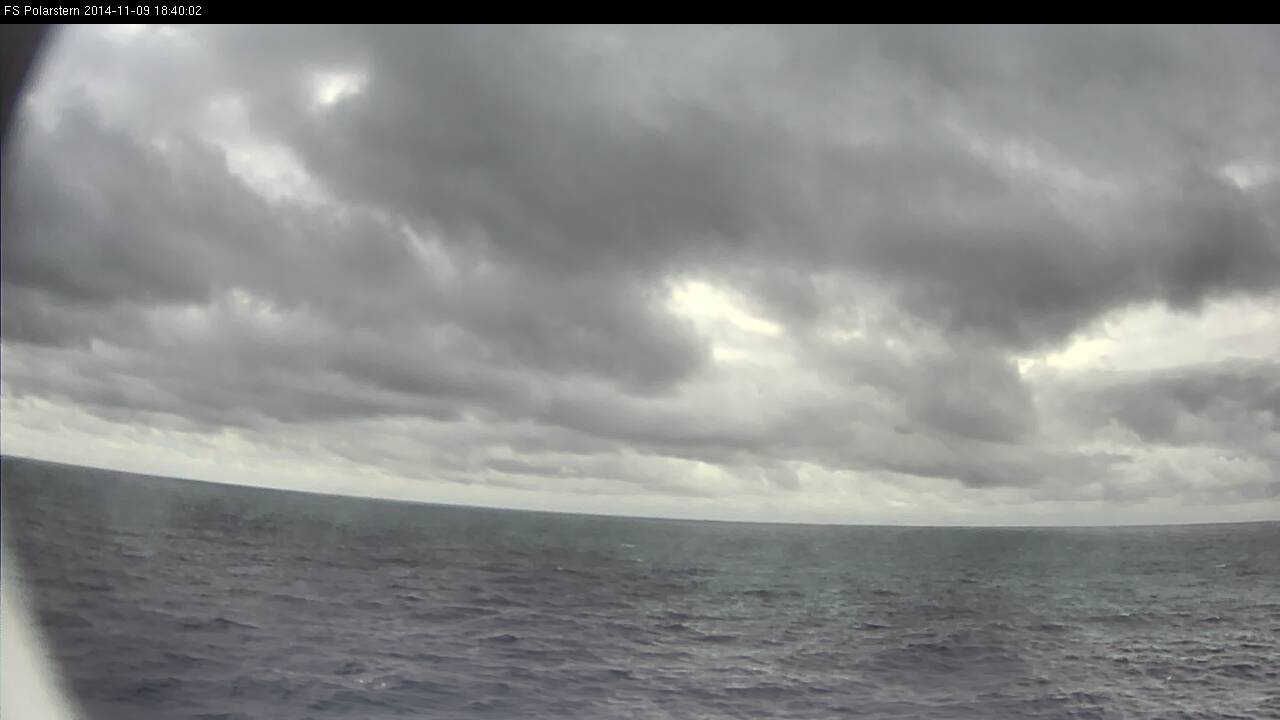
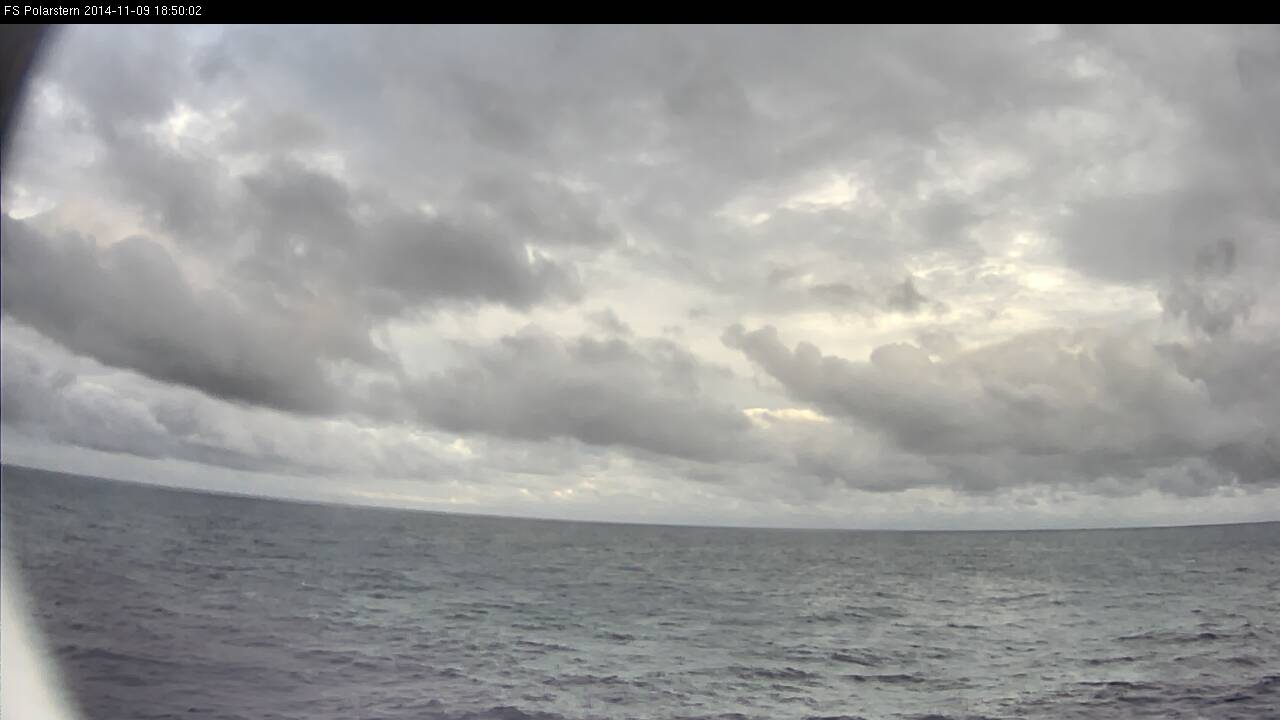
In this loop you will see all daytime webcam images taken every 10 minutes on 9 Nov 2014 between 07:10 UTC and 19:40 UTC.
Loop 4: Note - click on the loop to go through individual images
In the morning the weather was mostly cloudy with different cloud layers and some short sunny intervals. From 12:00 UTC on showers began to develop around the Polarstern.
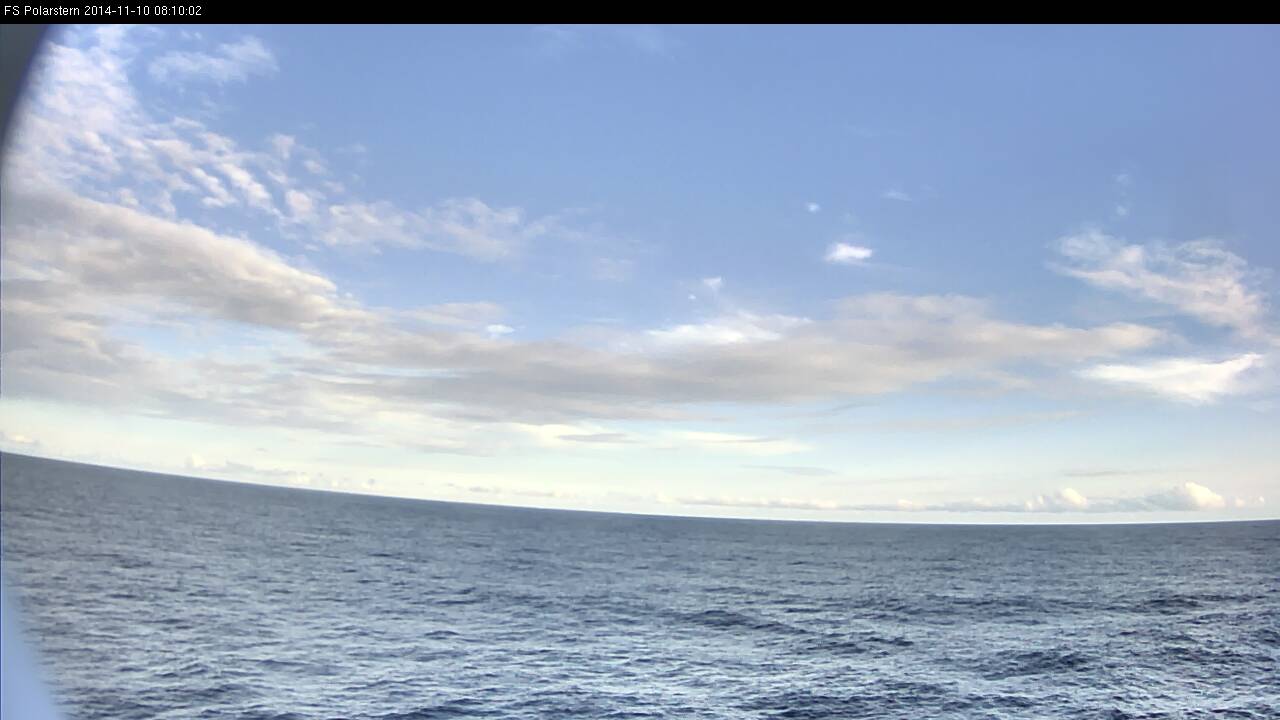
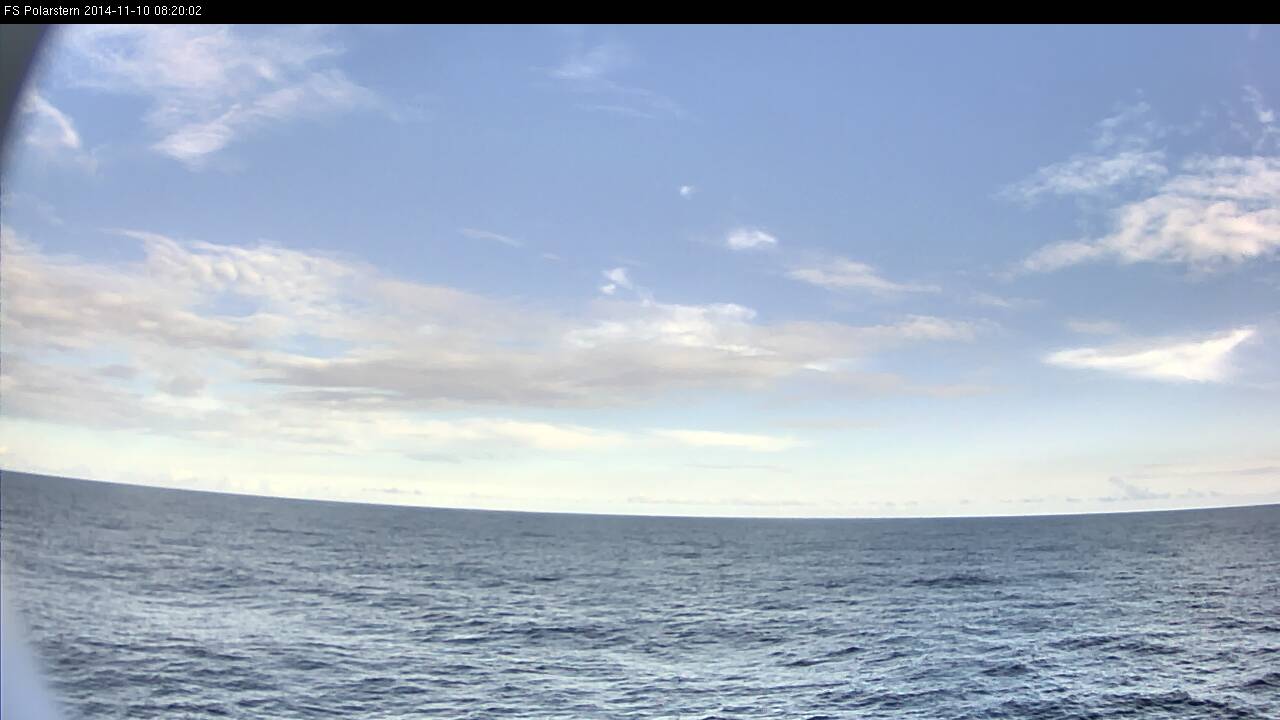
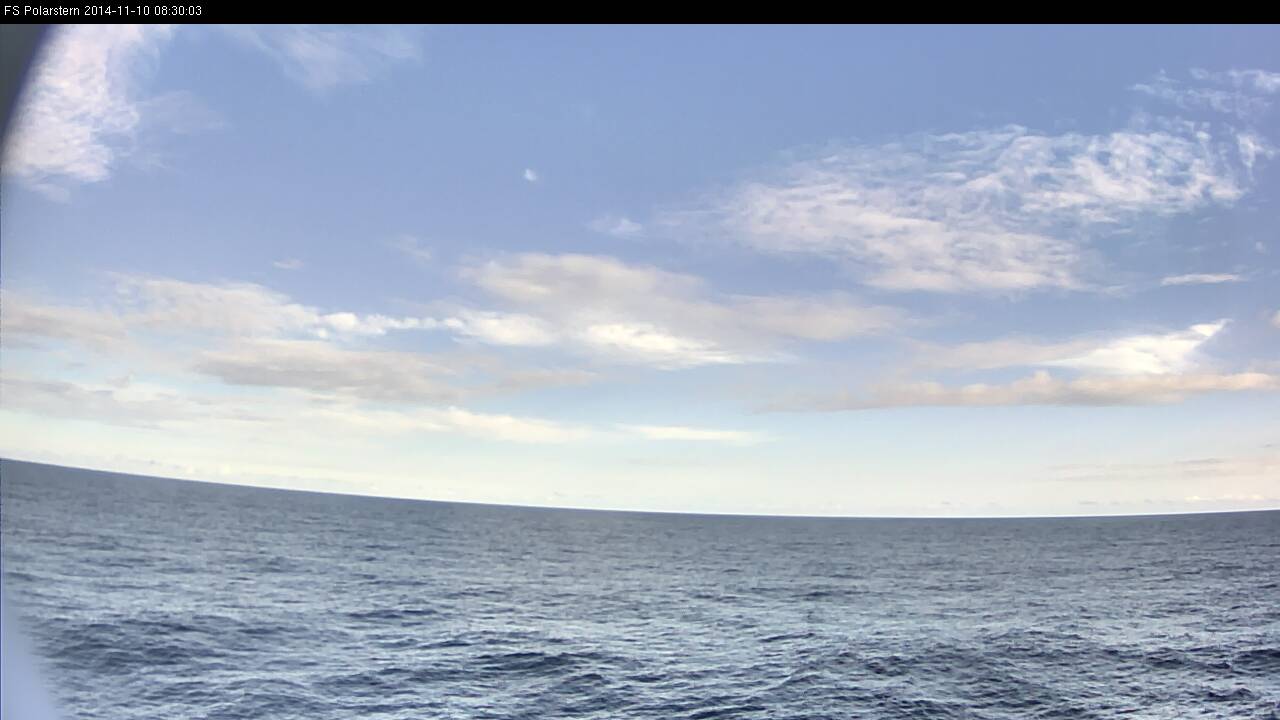
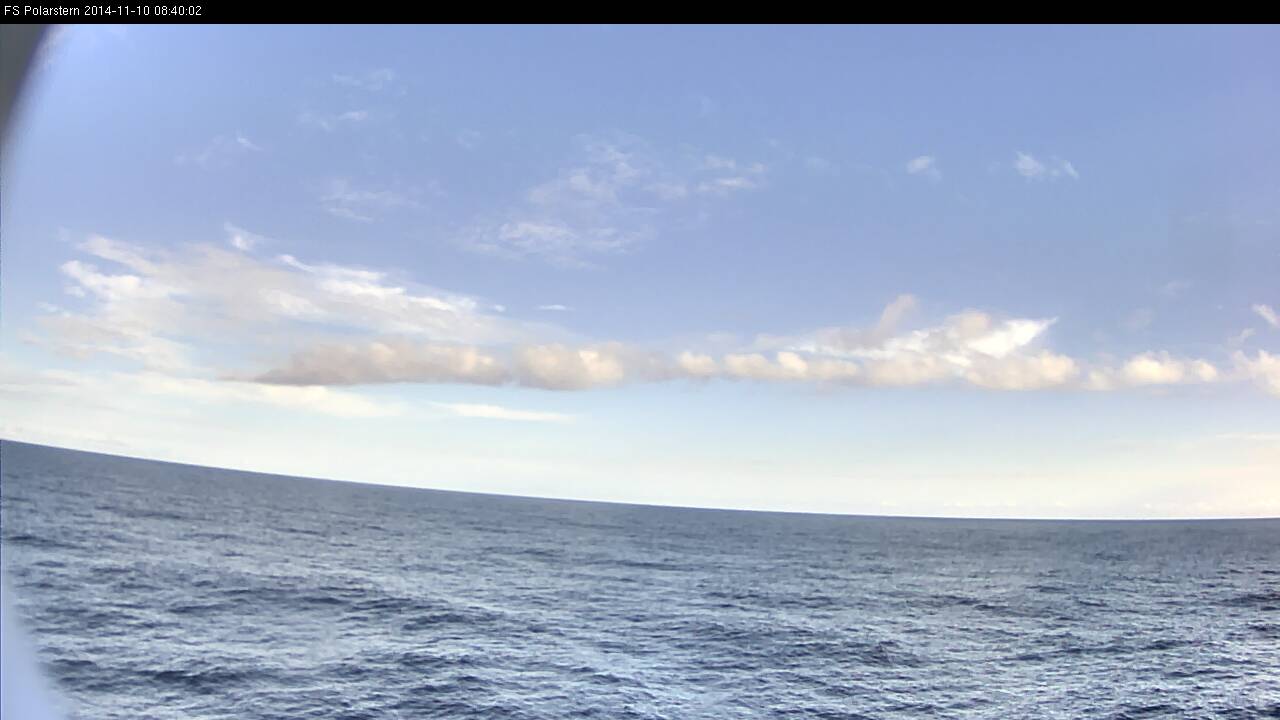
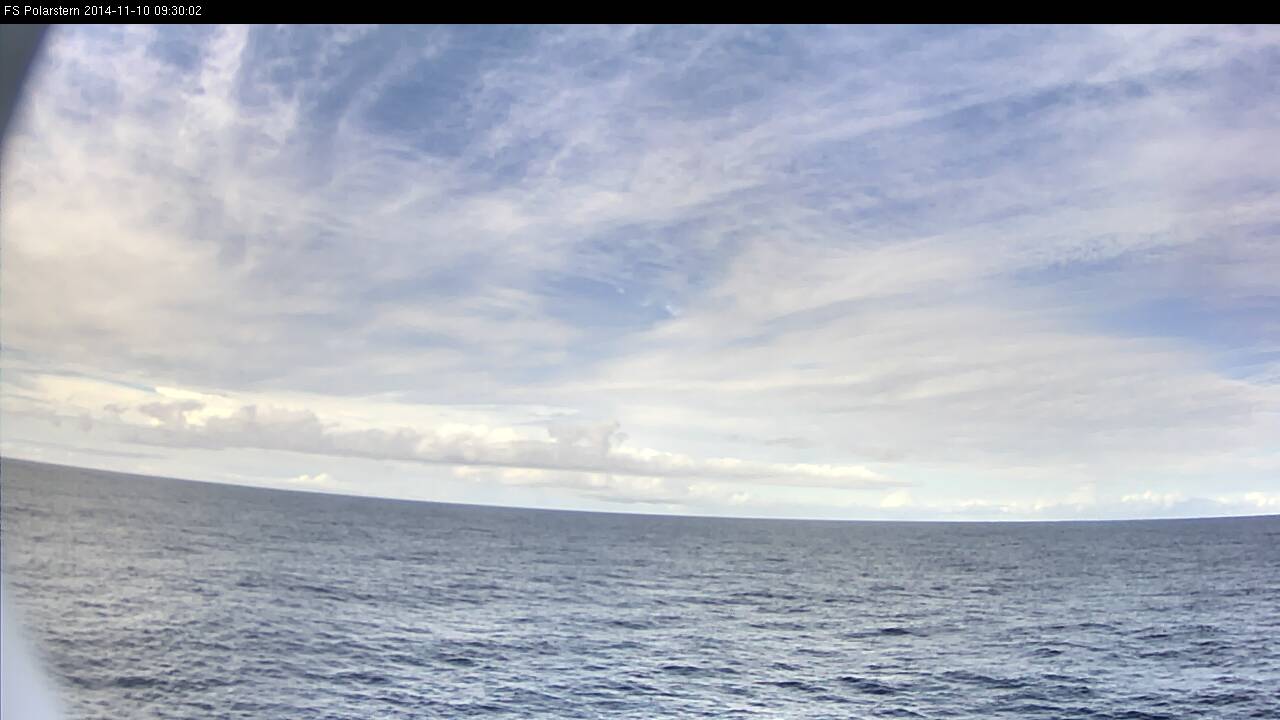
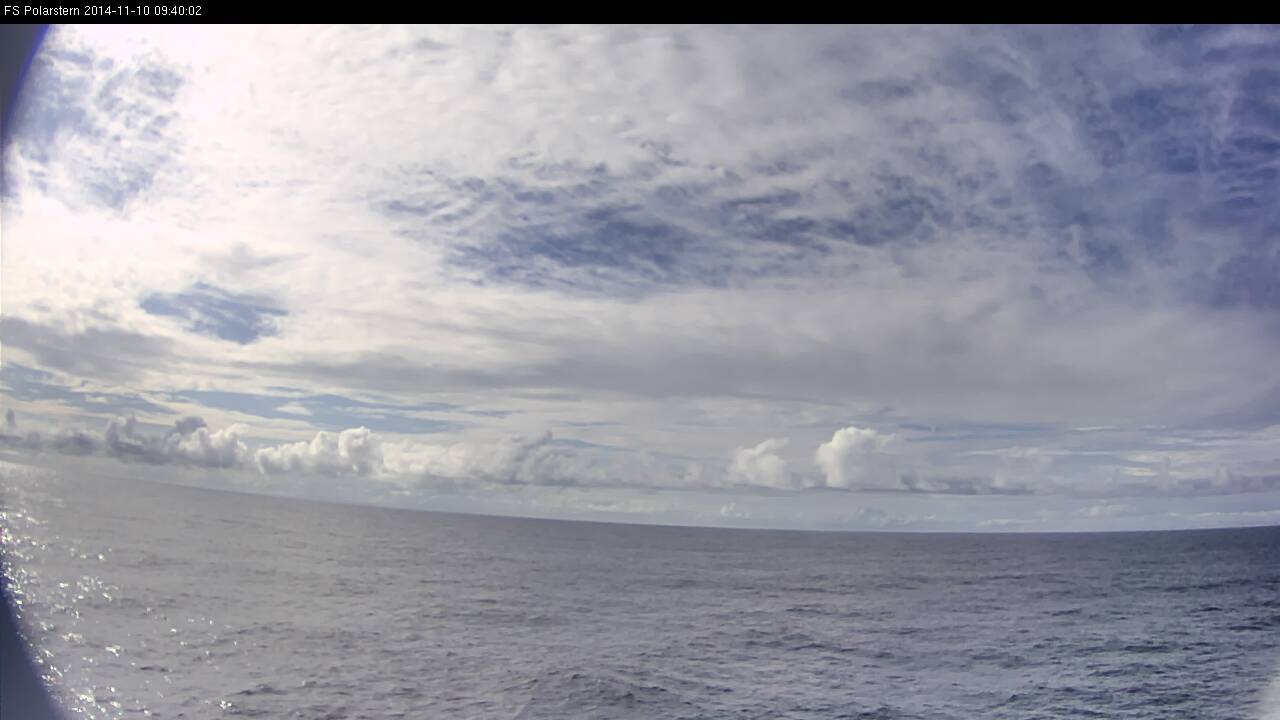
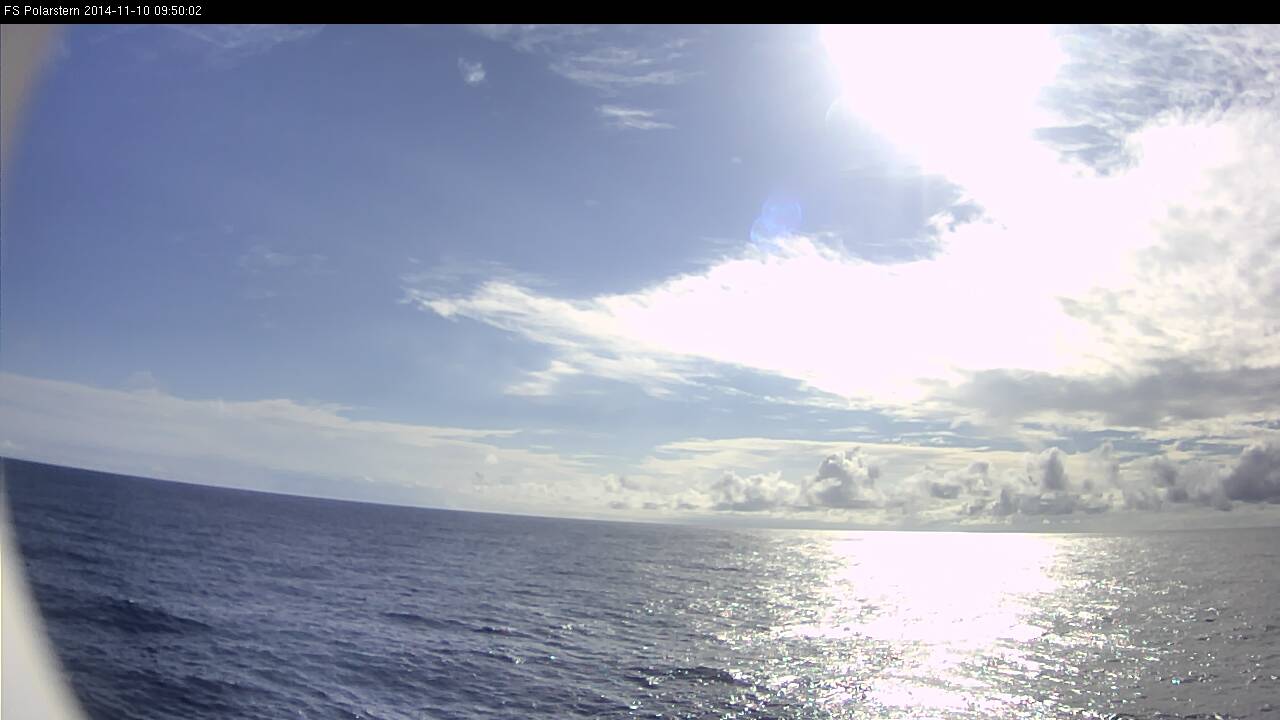
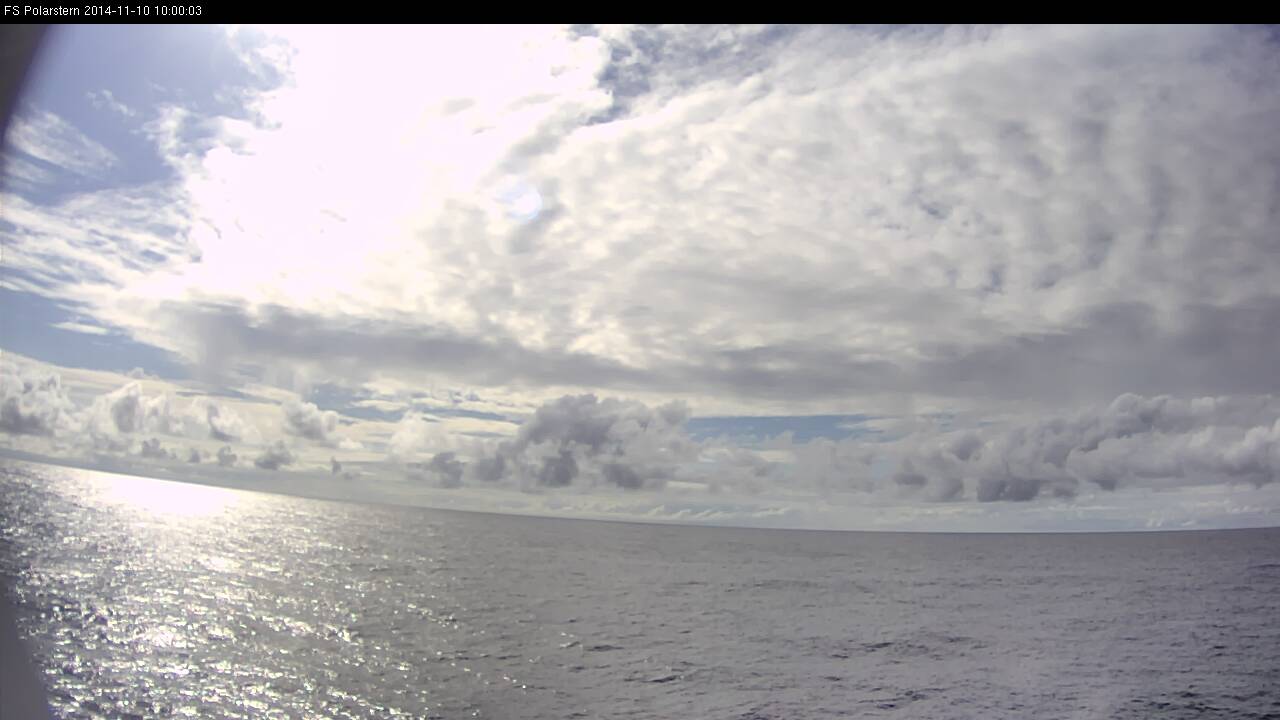
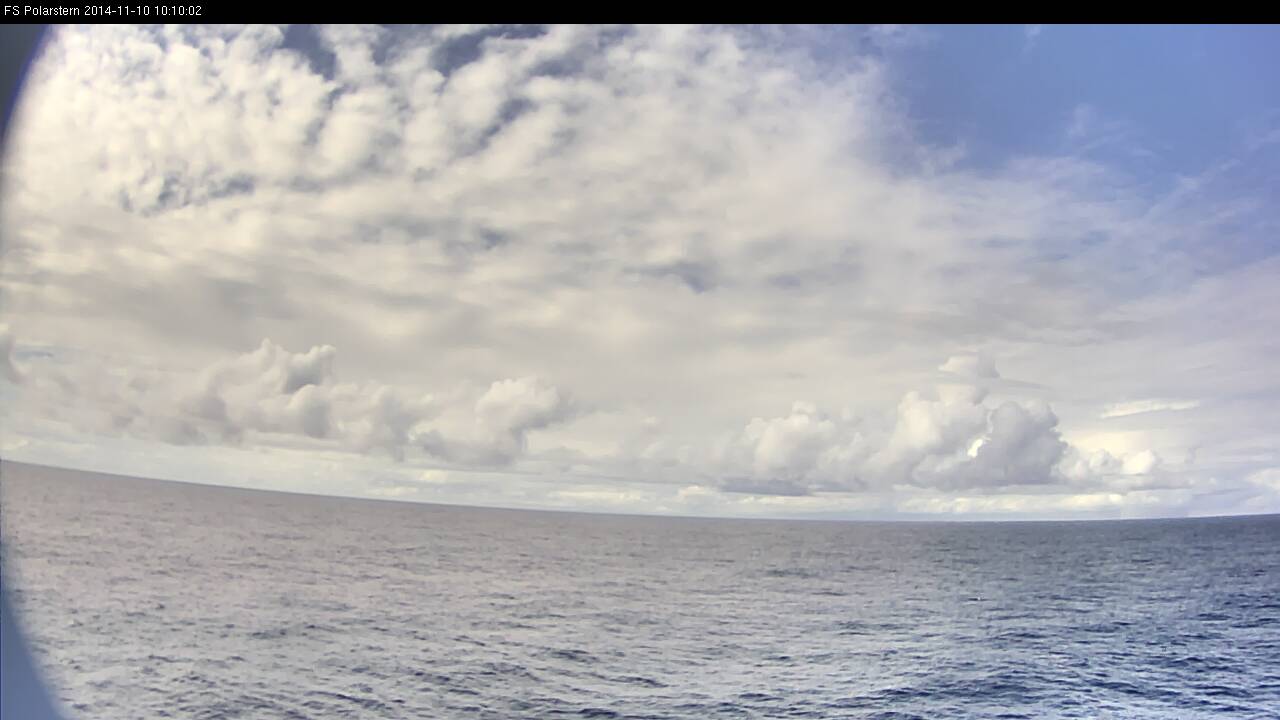
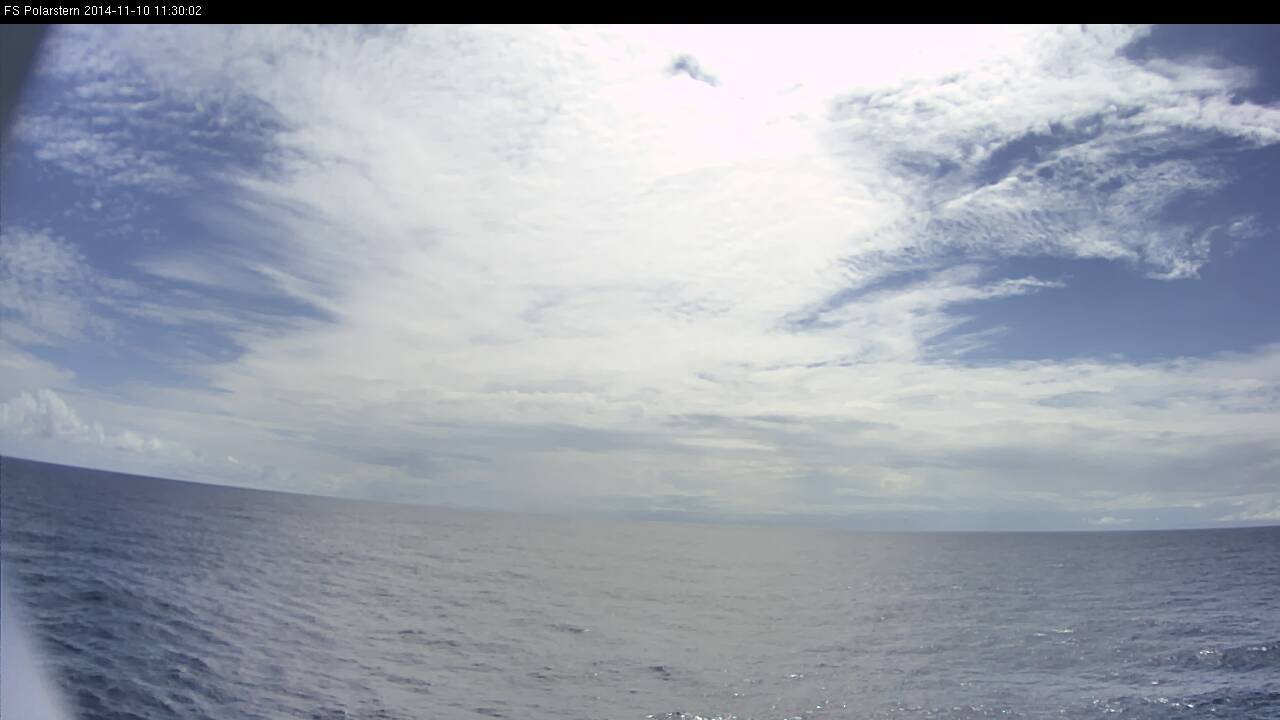
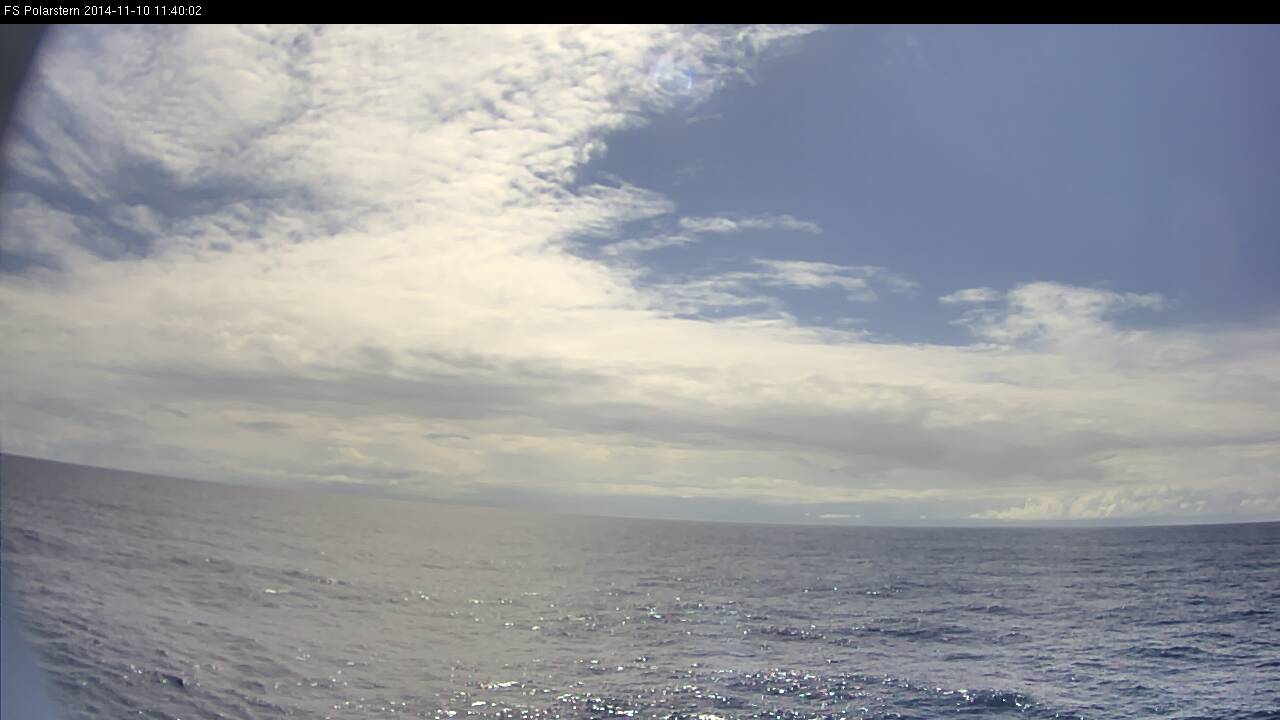
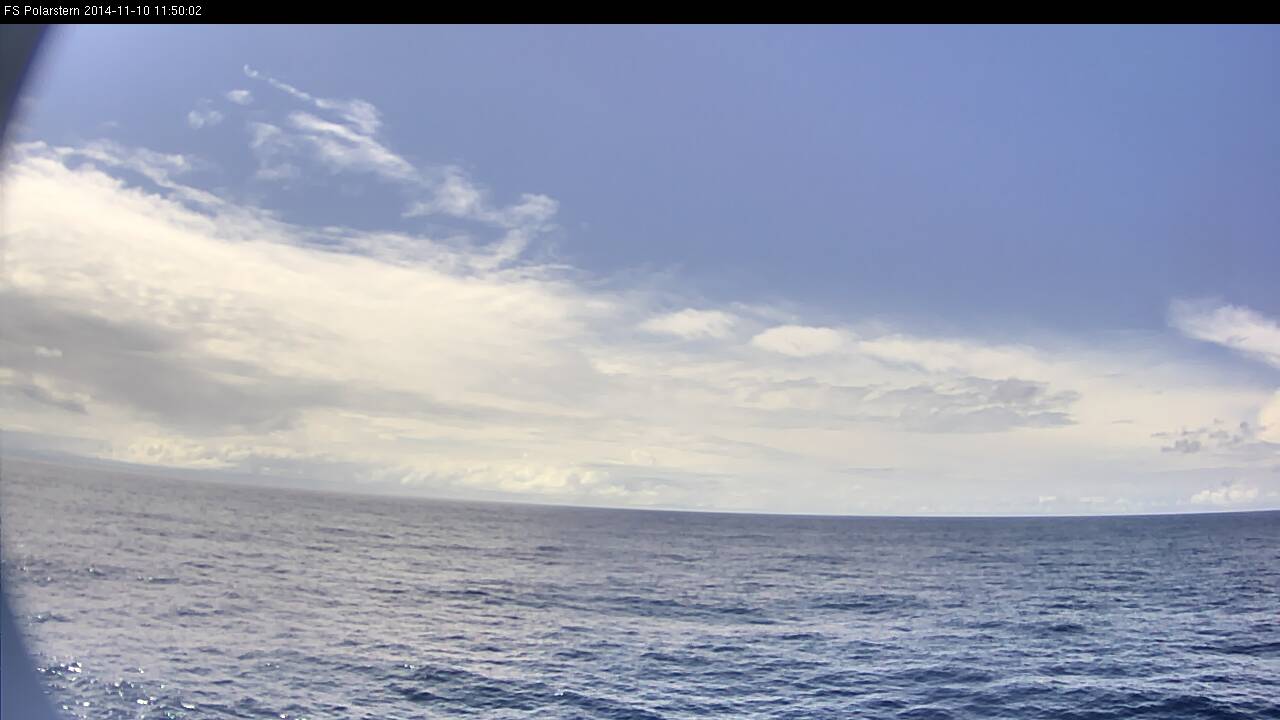
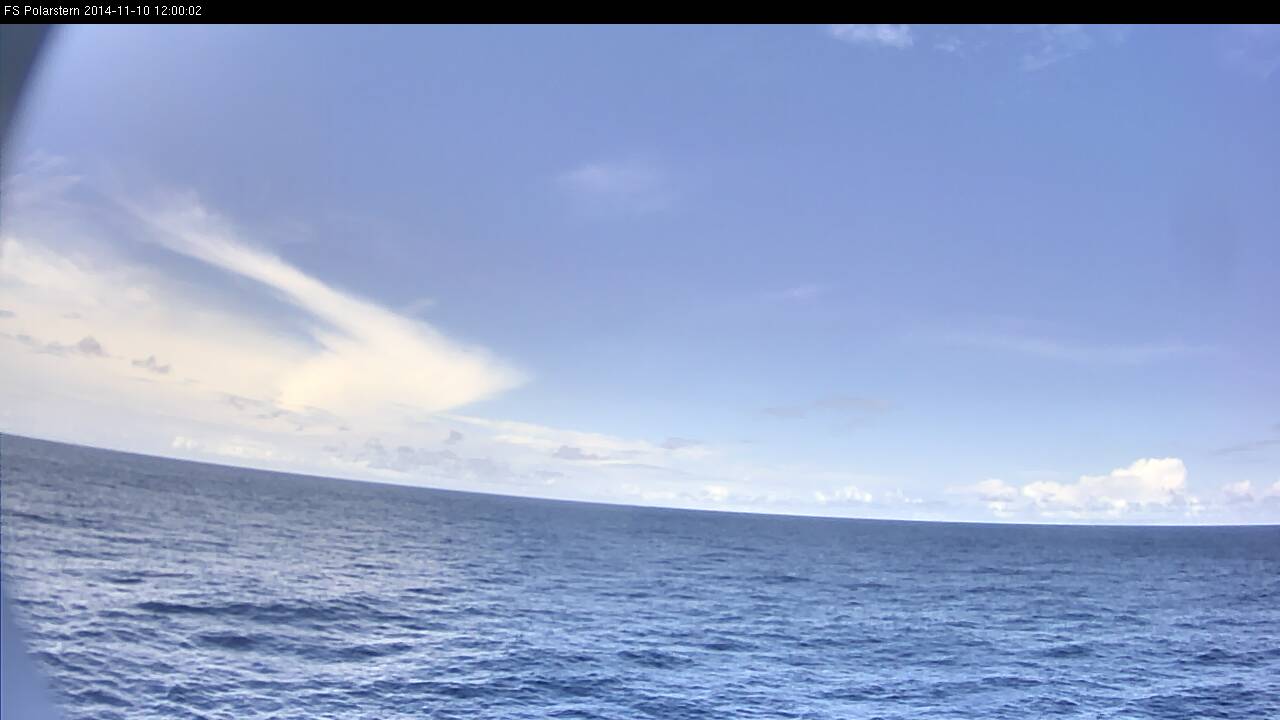
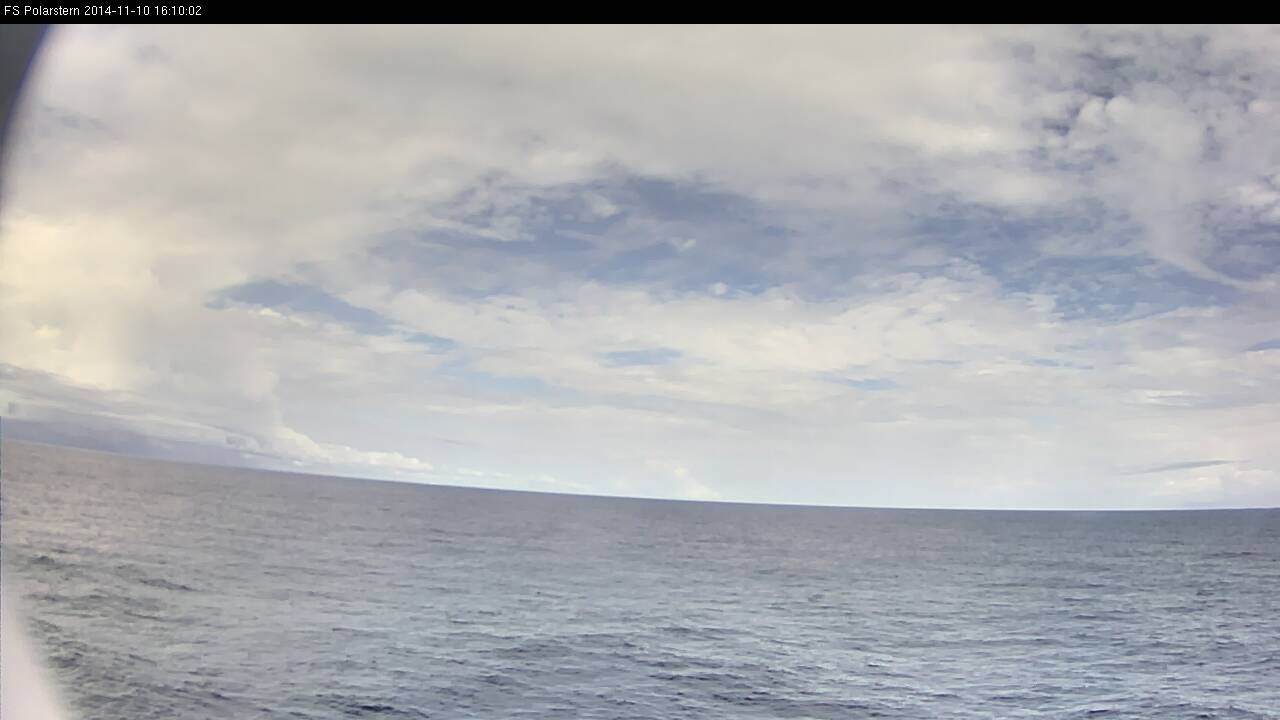
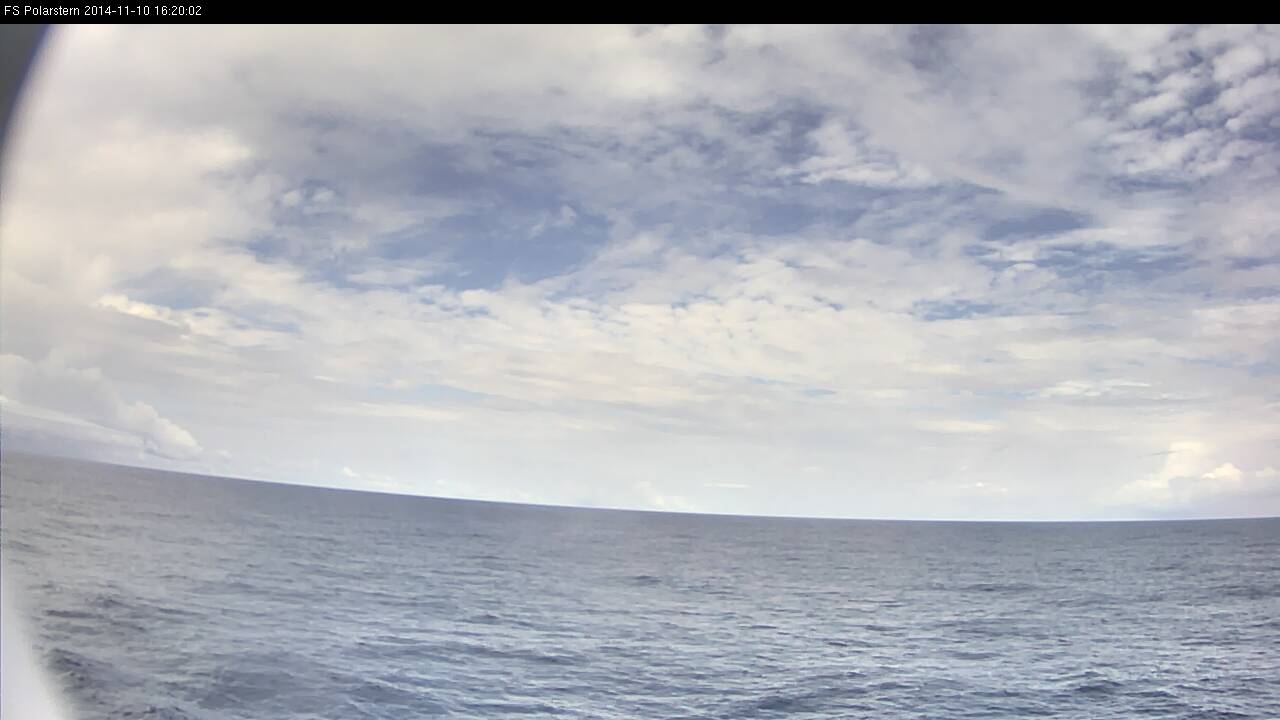
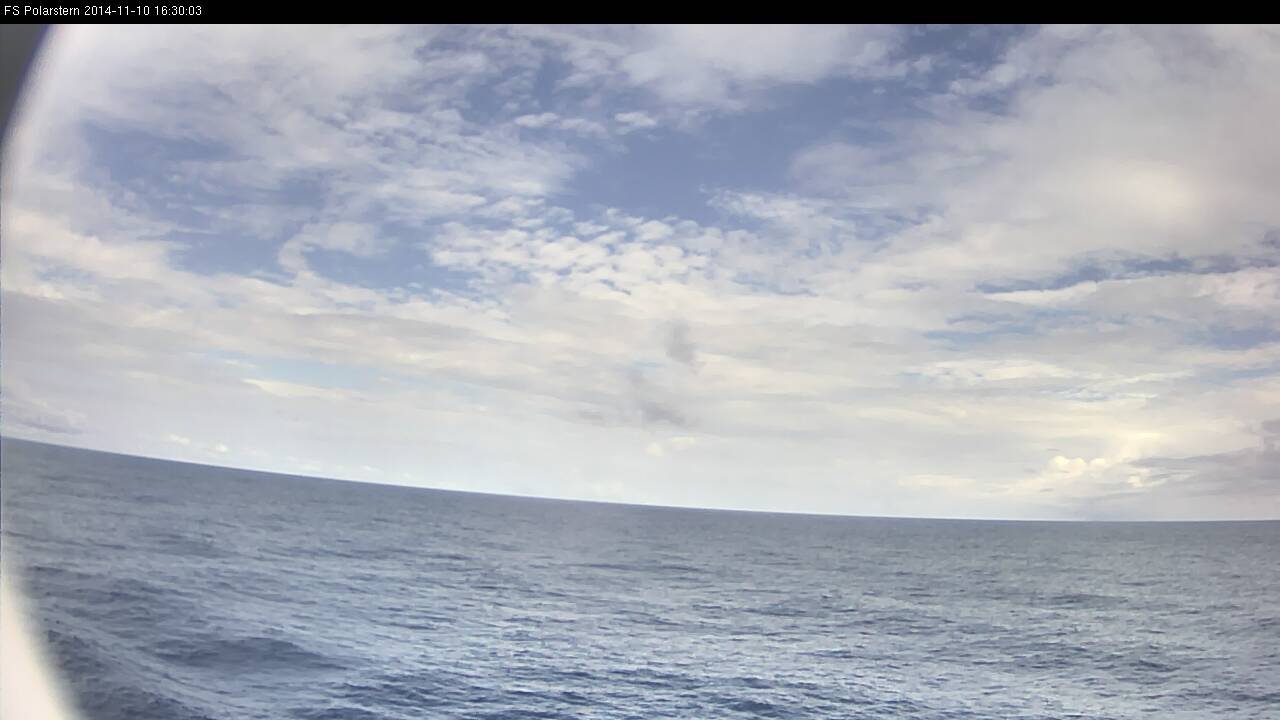
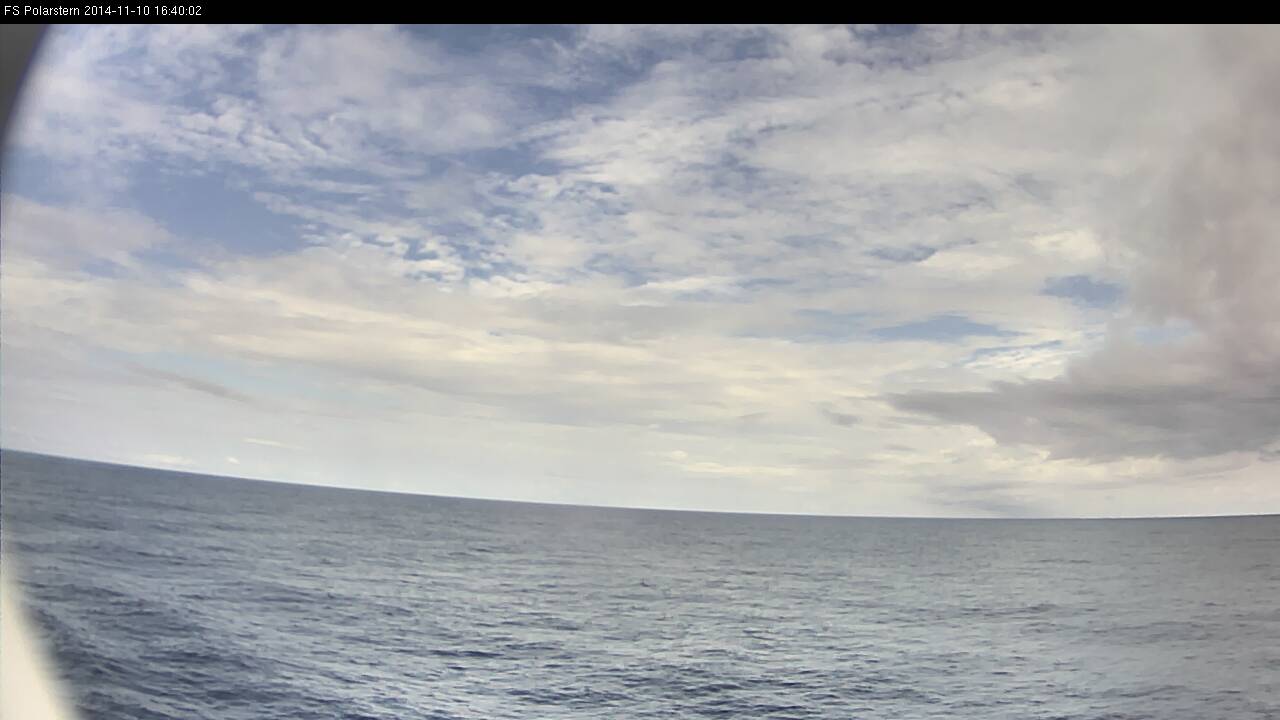
Weather situation on 10 Nov 2014
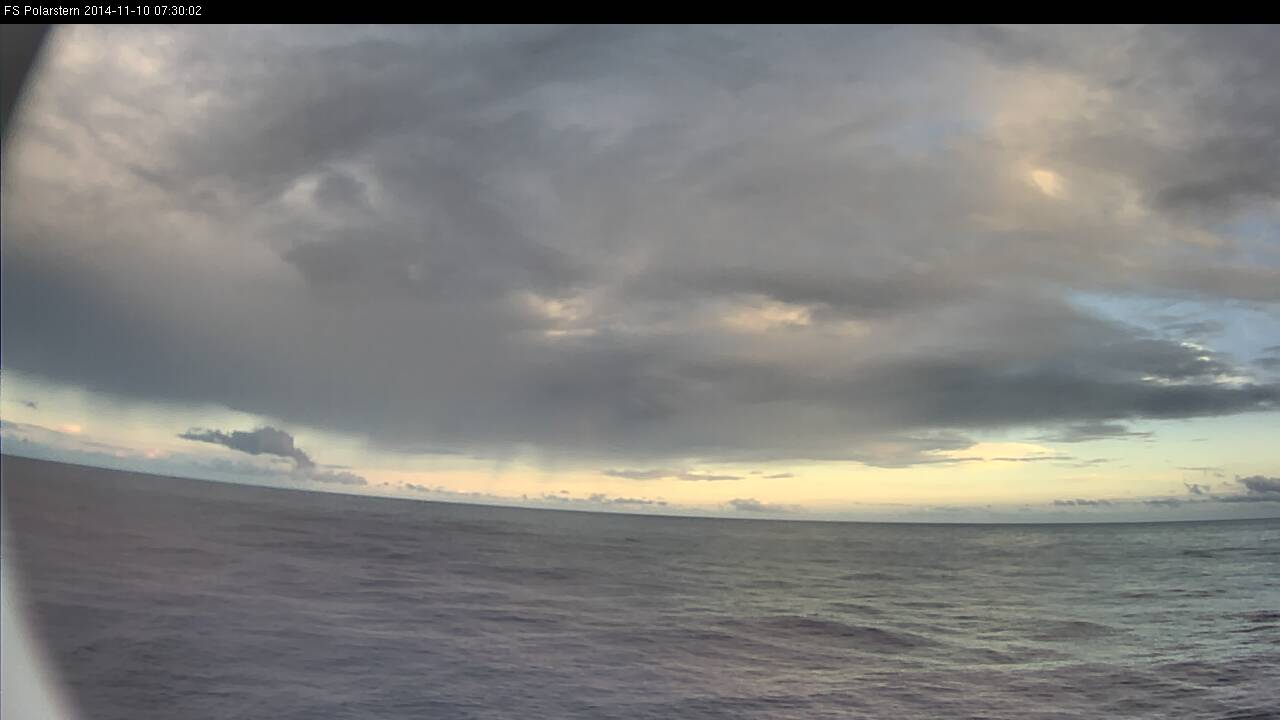
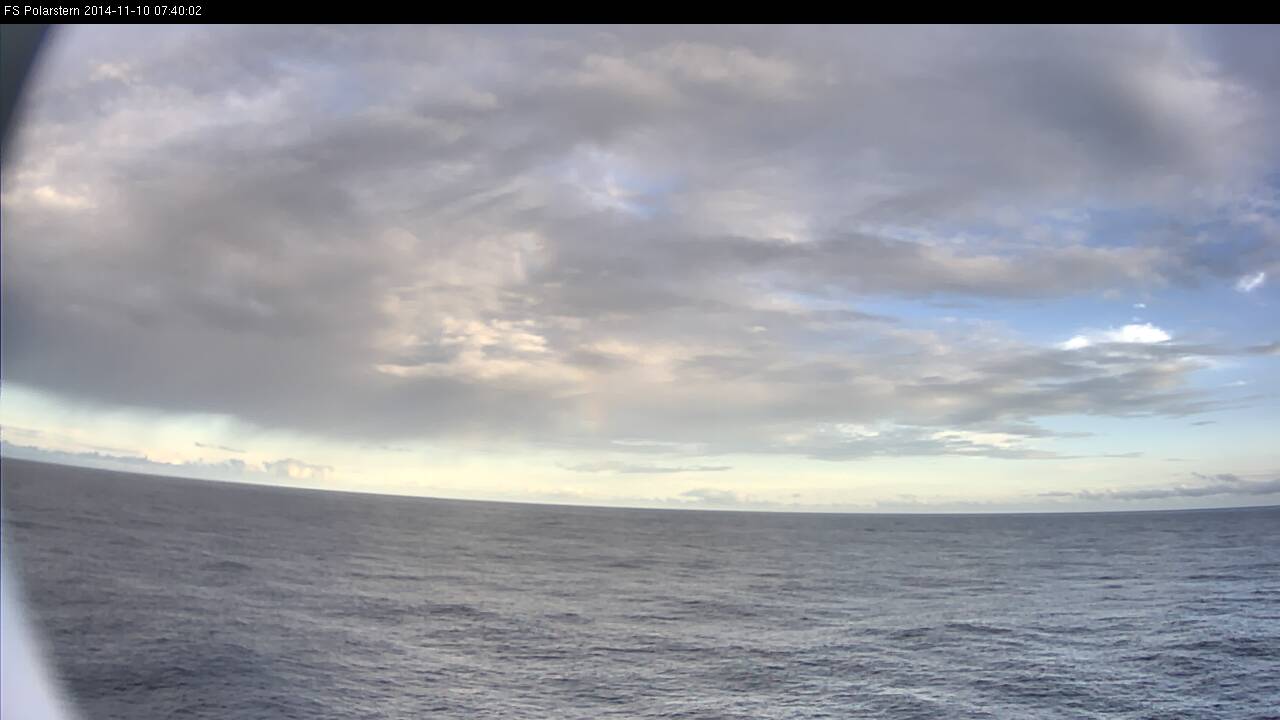
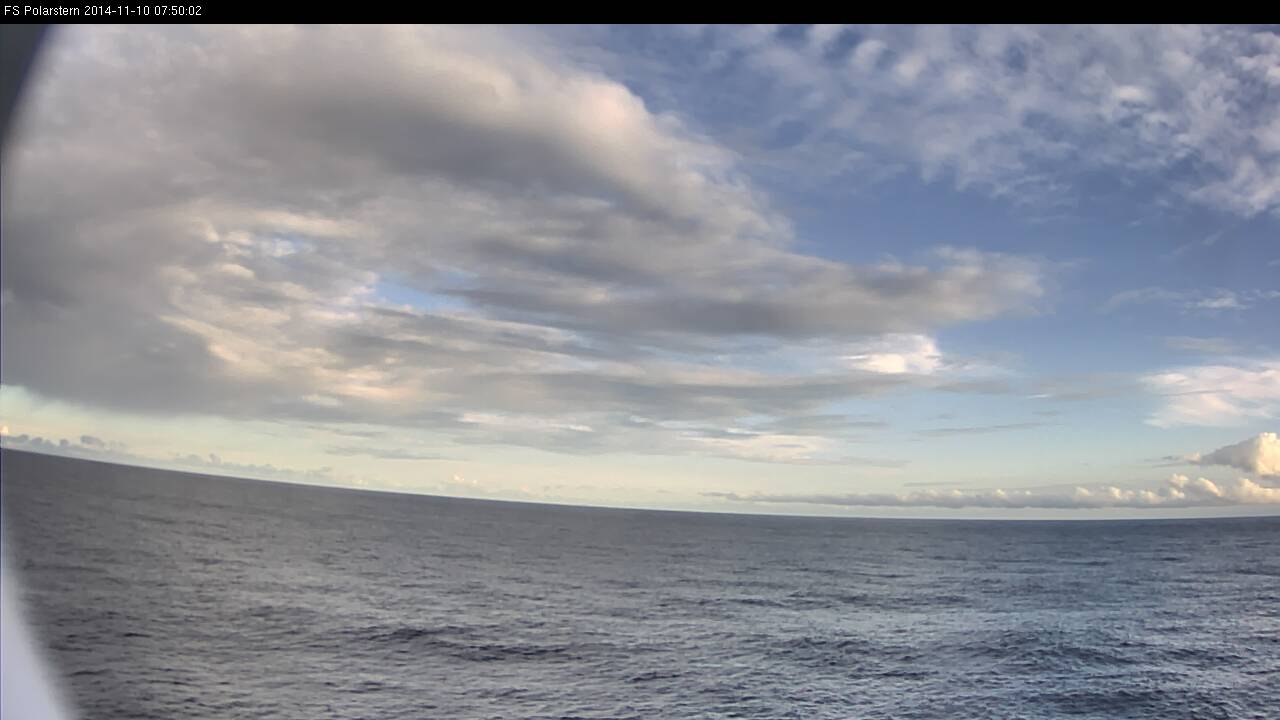
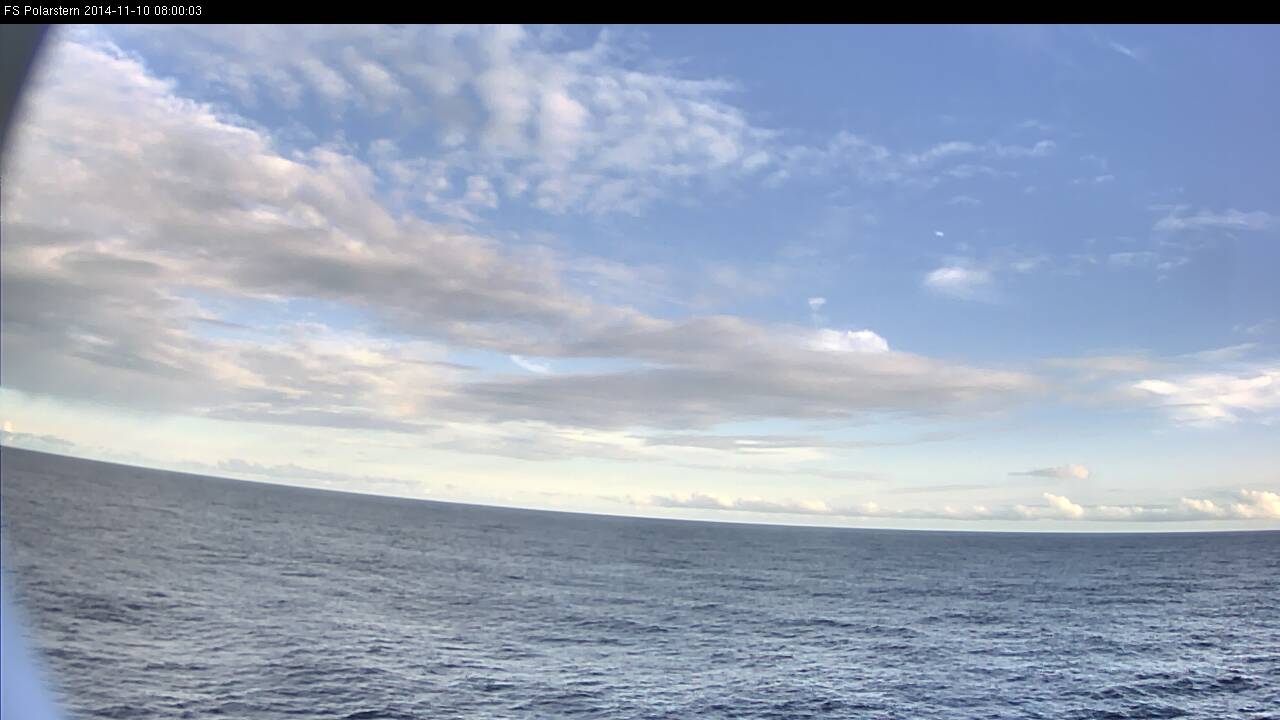
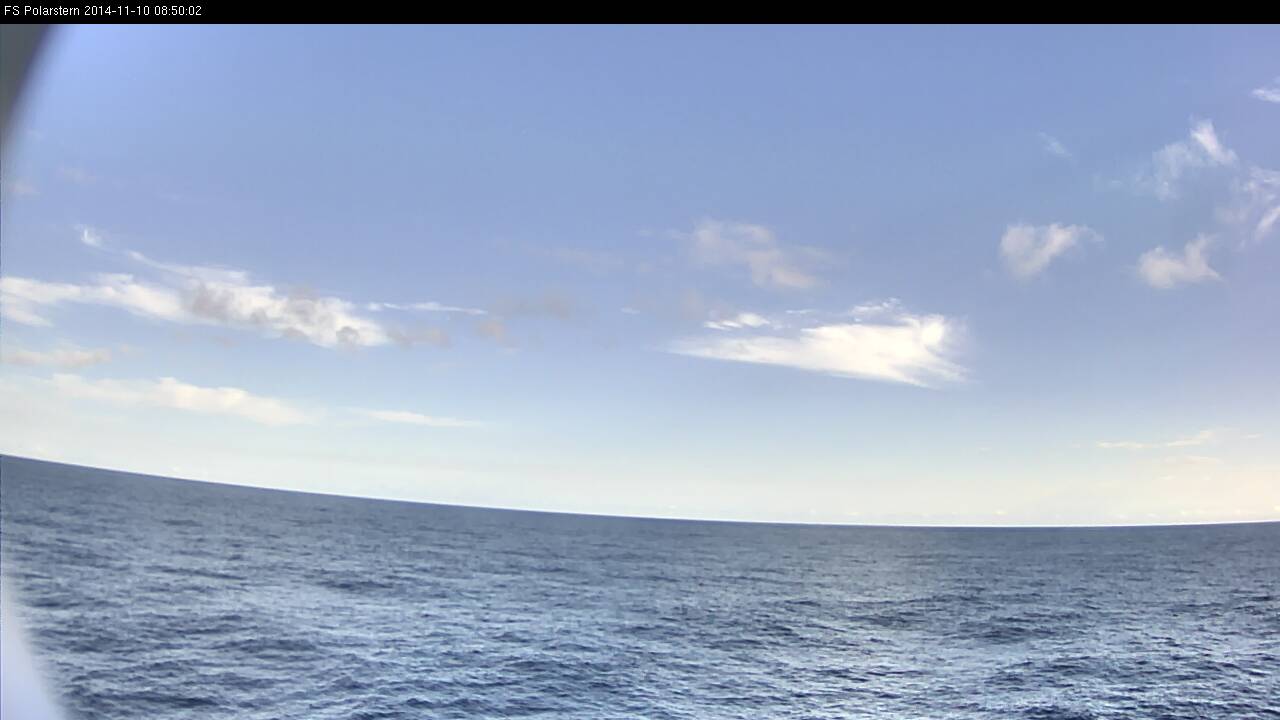
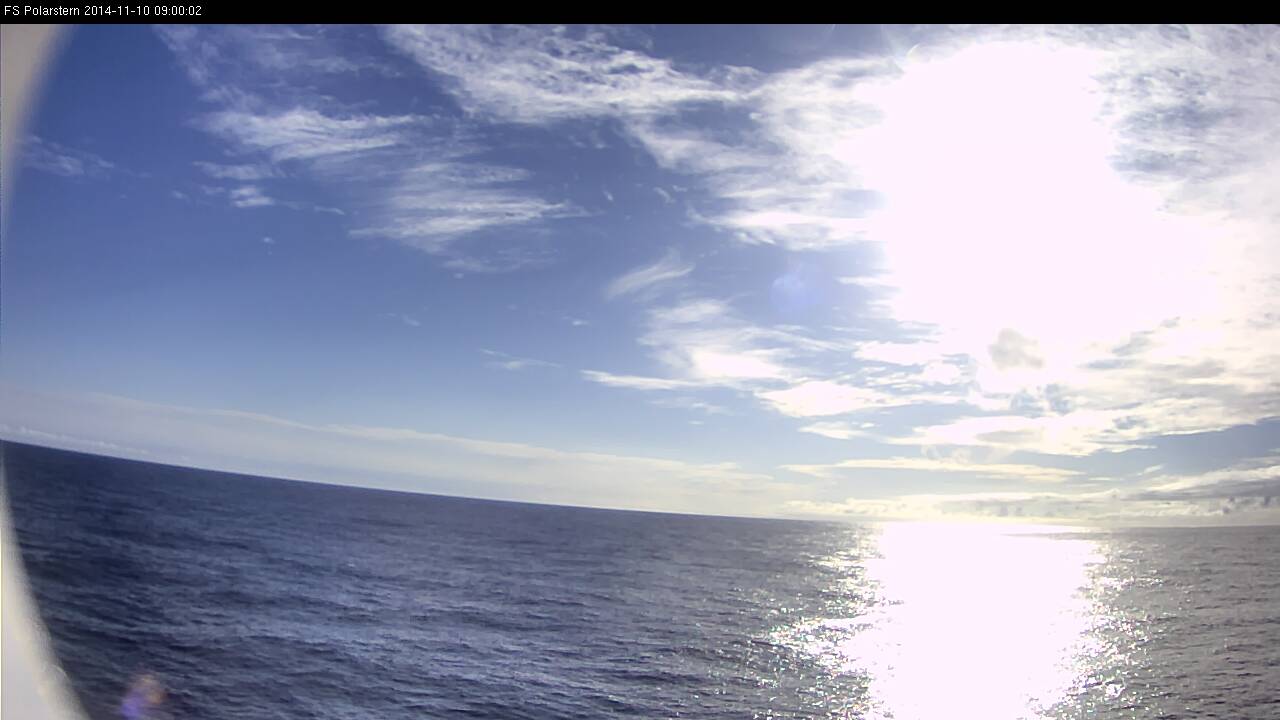
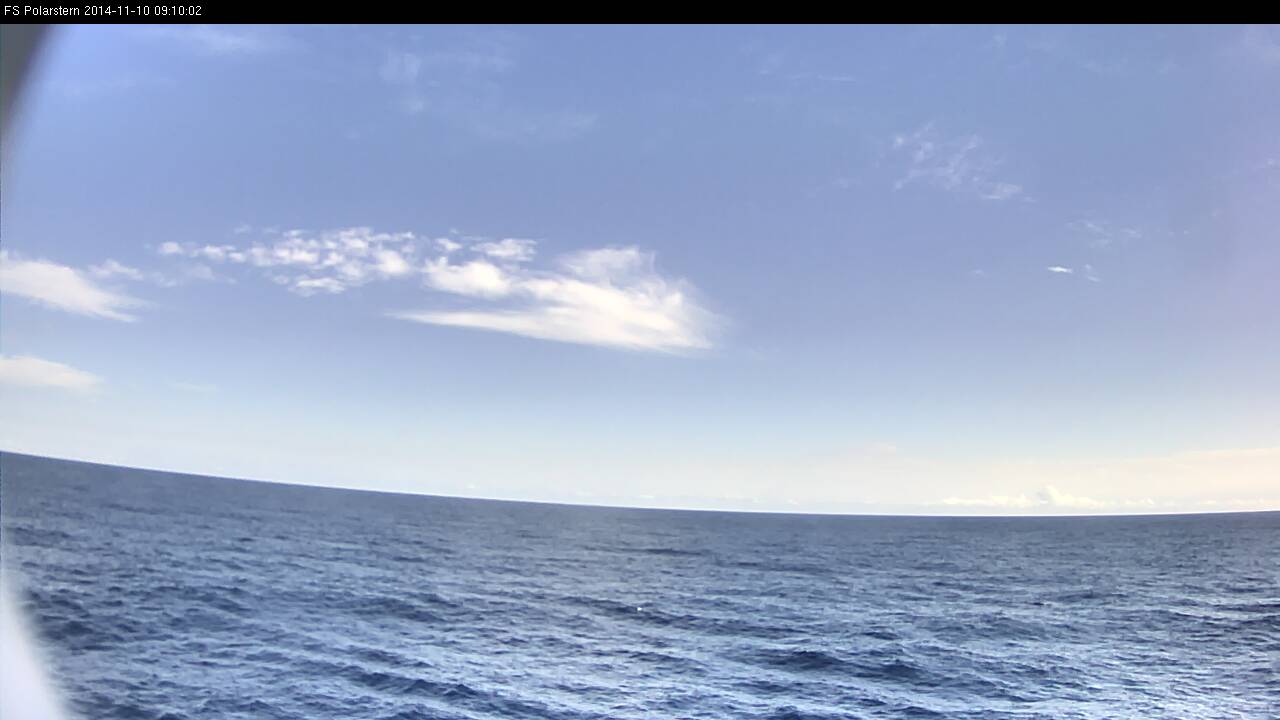
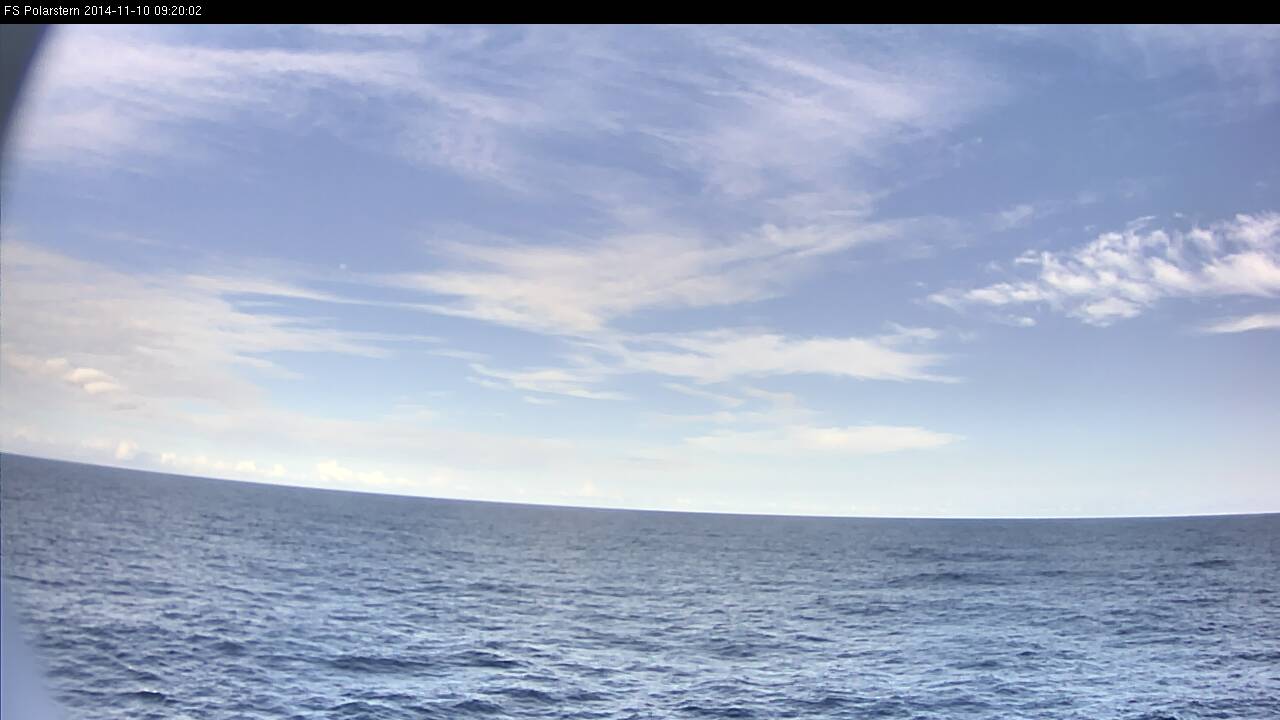
The Polarstern was sailing in the Inter Tropical Convergence Zone. On that day the weather was fair, but shower activity increased during the afternoon.
The small, strong yellow area south of the Polarstern's position (orange dot and white arrow) marks strong thunderstorms in the Severe Storms RGB. This is the biggest advantage of this RGB.
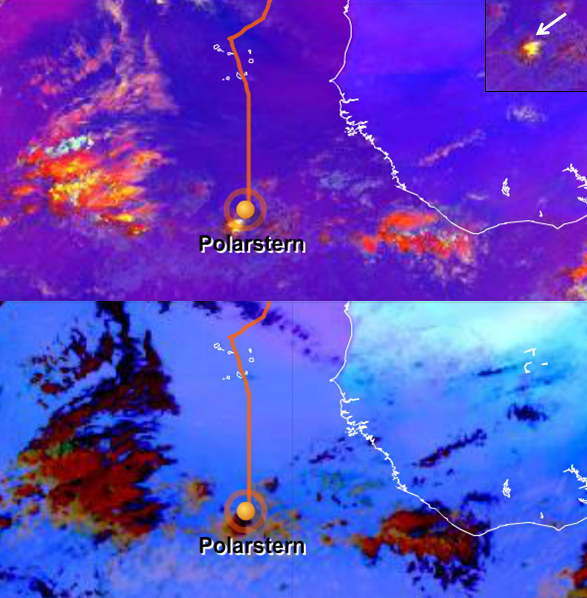
Figure L2-12: 10 Nov 2014, 12:00 UTC. Above: Severe Storms RGB.
Below: Dust RGB. Source: EUMeTrain.
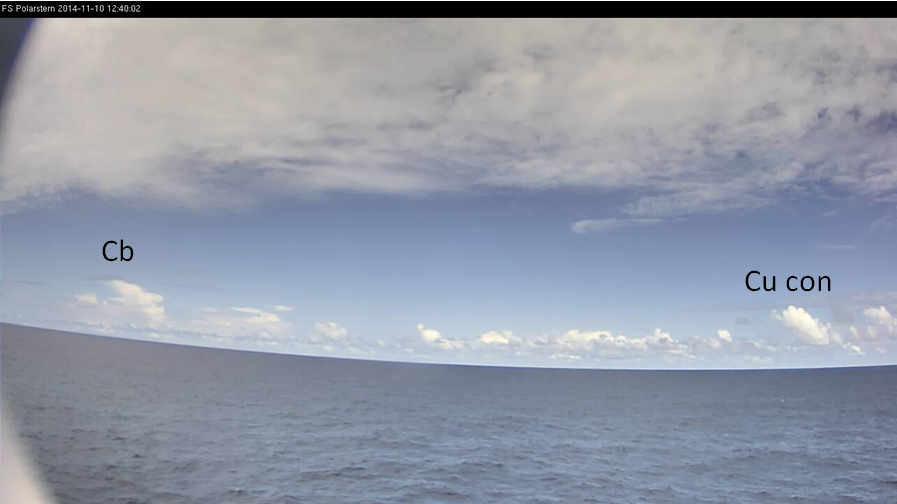
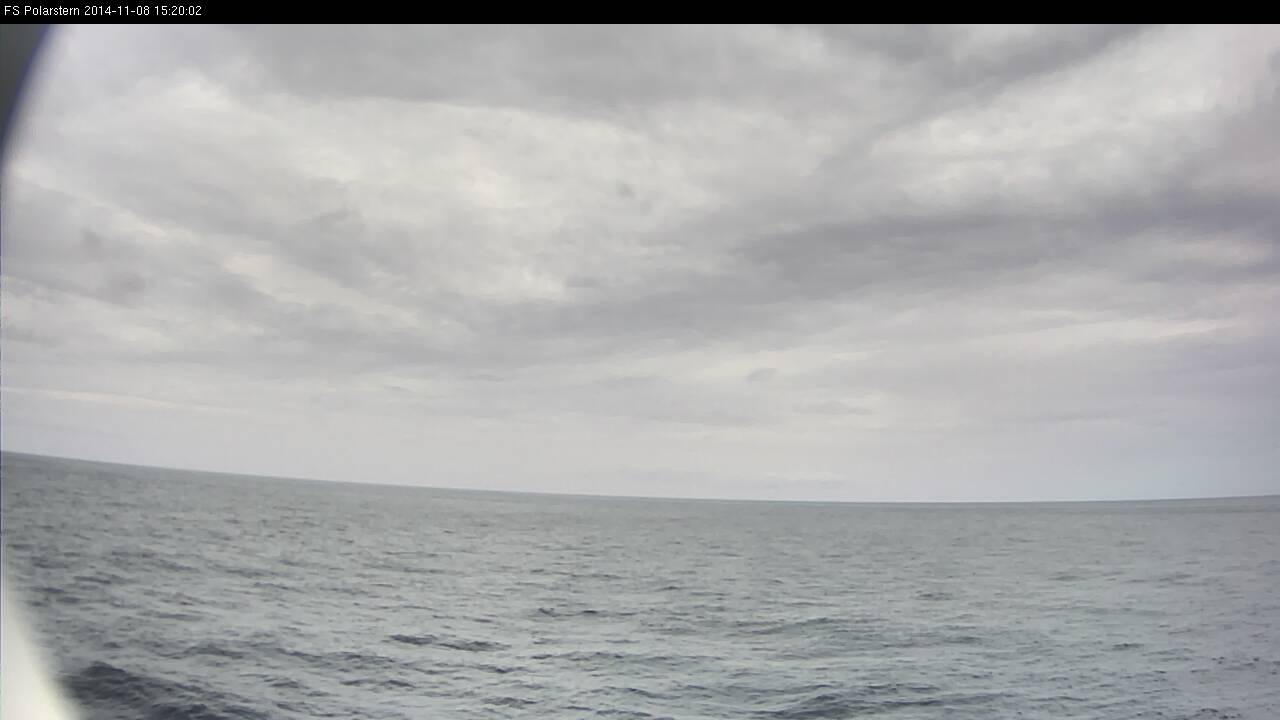
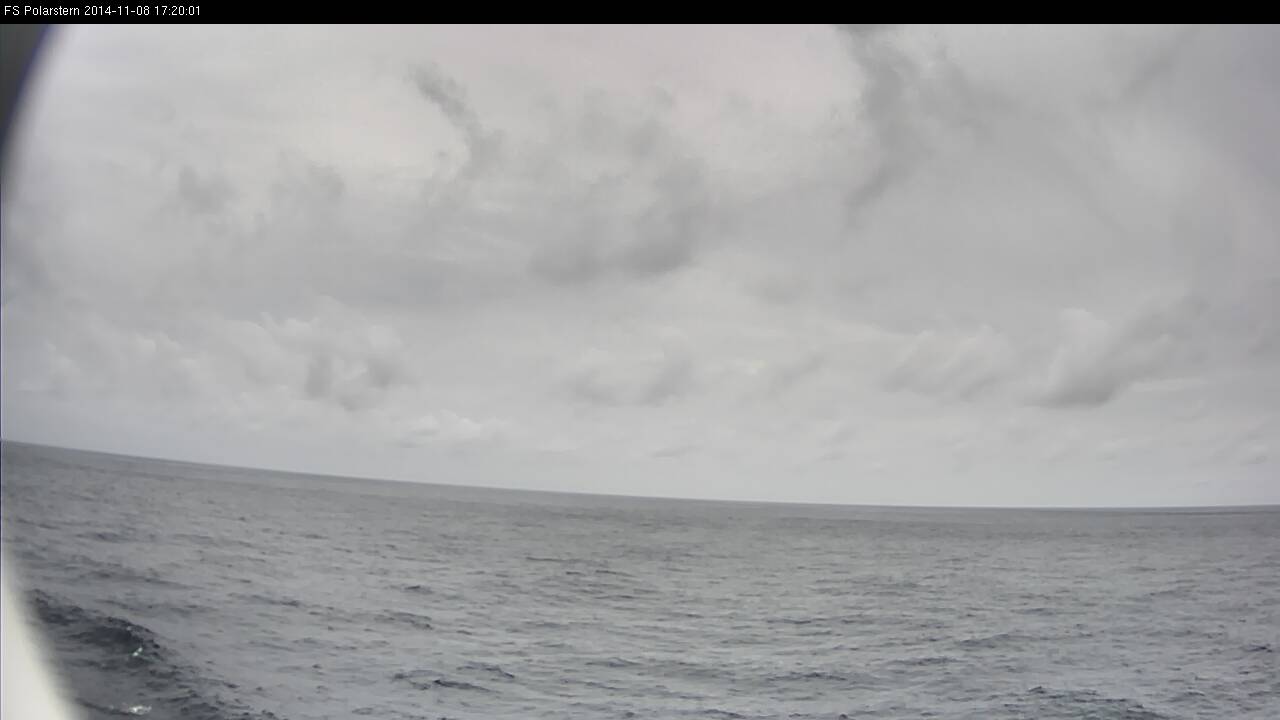
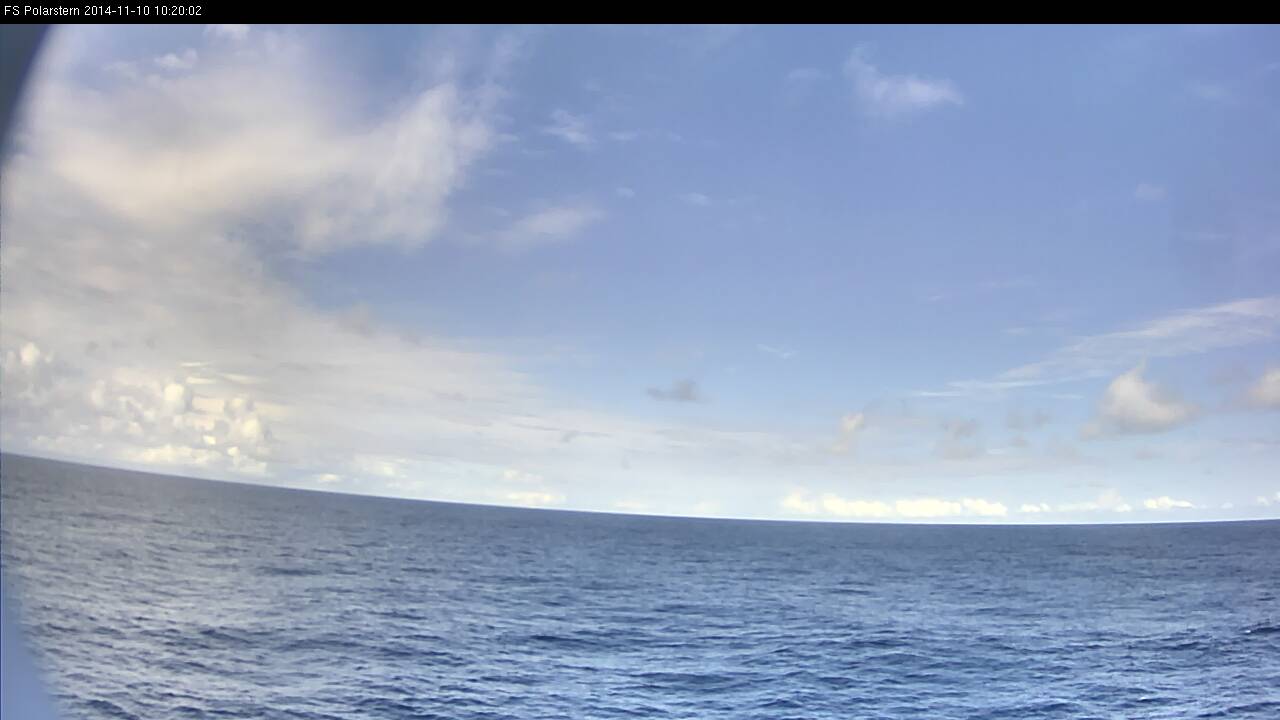
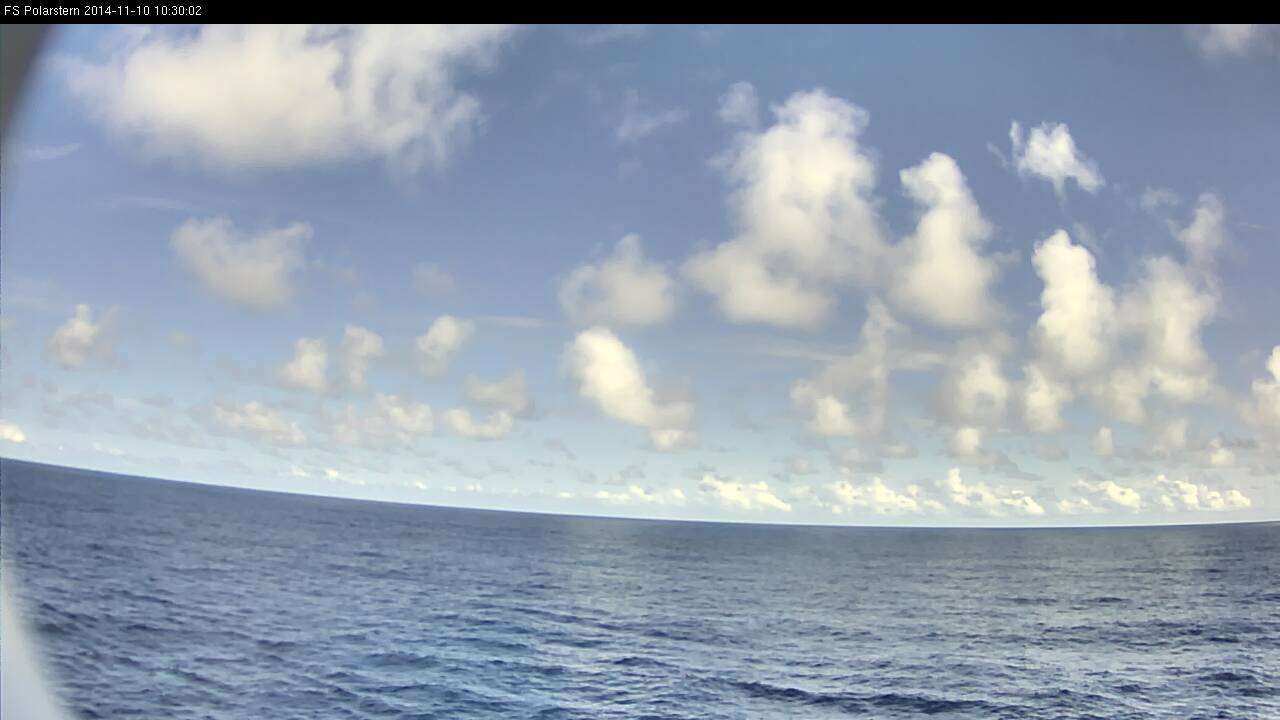
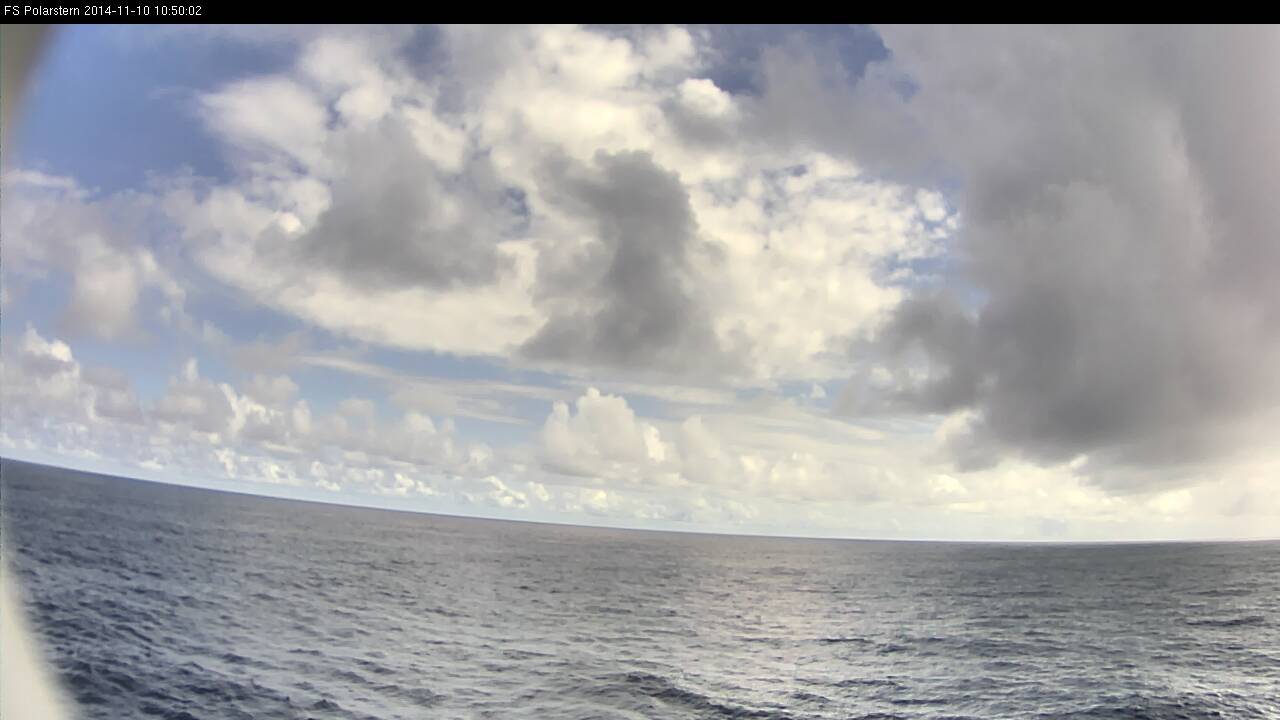
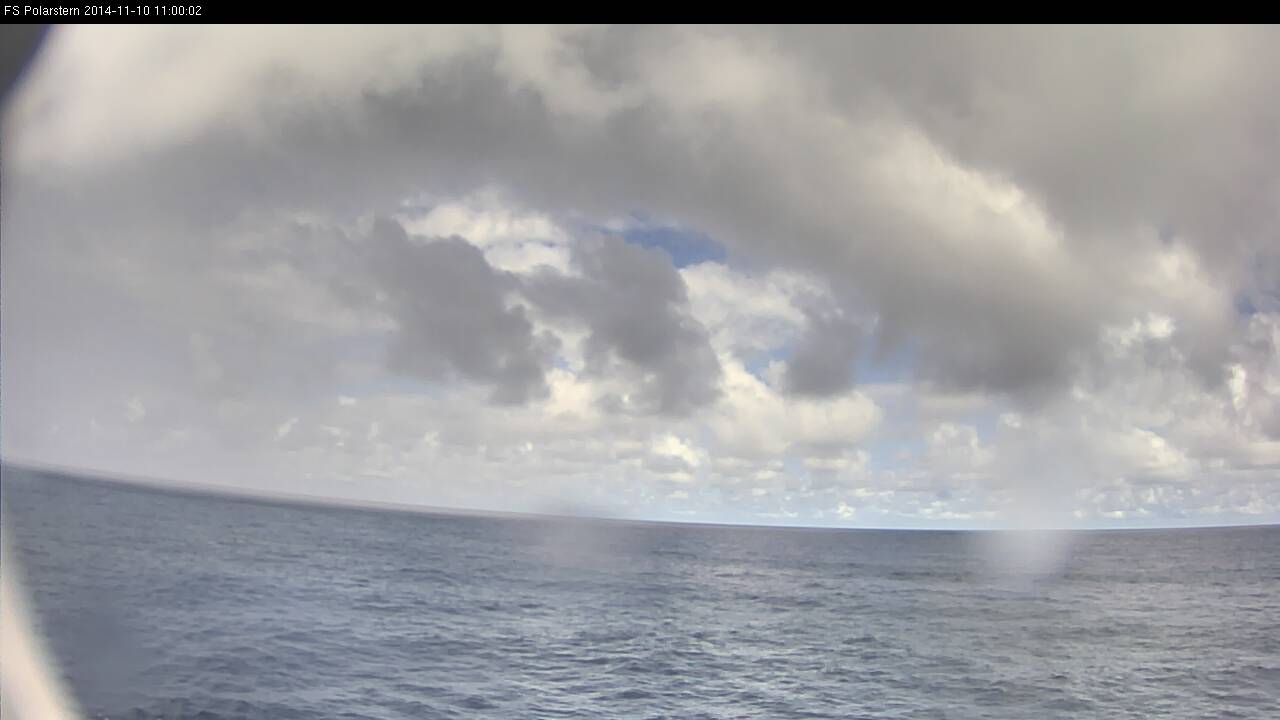
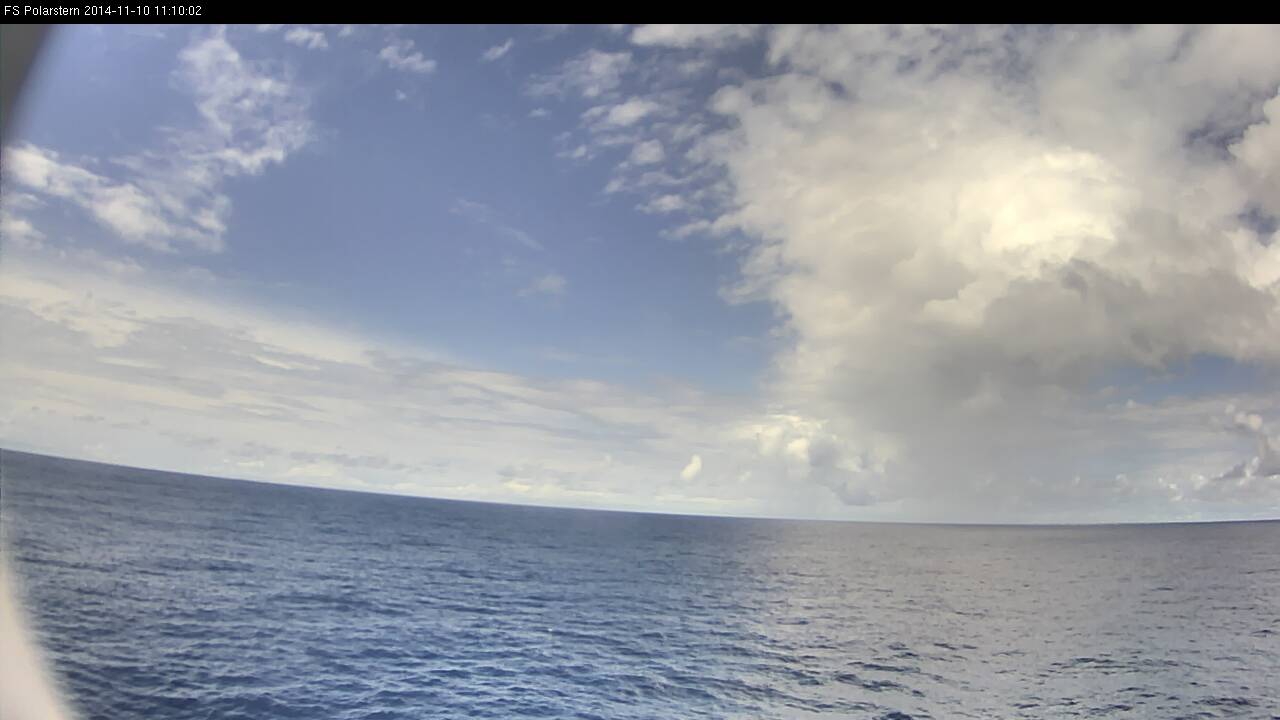
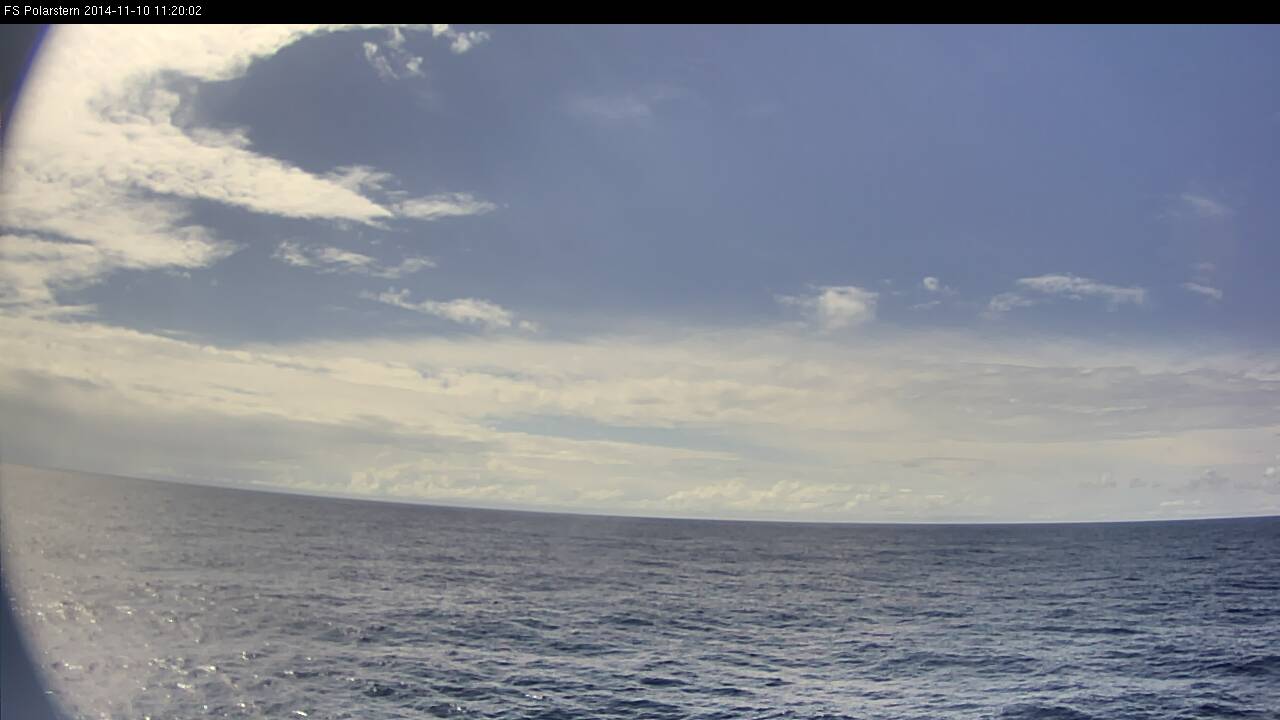
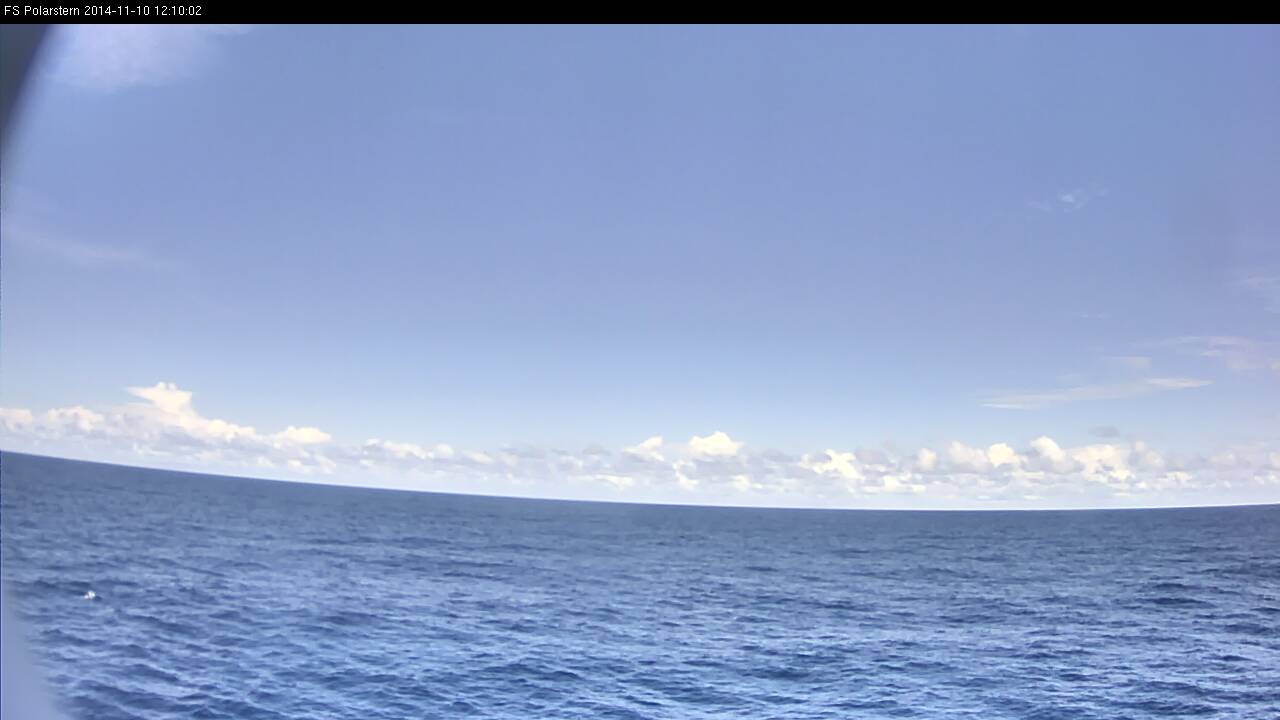
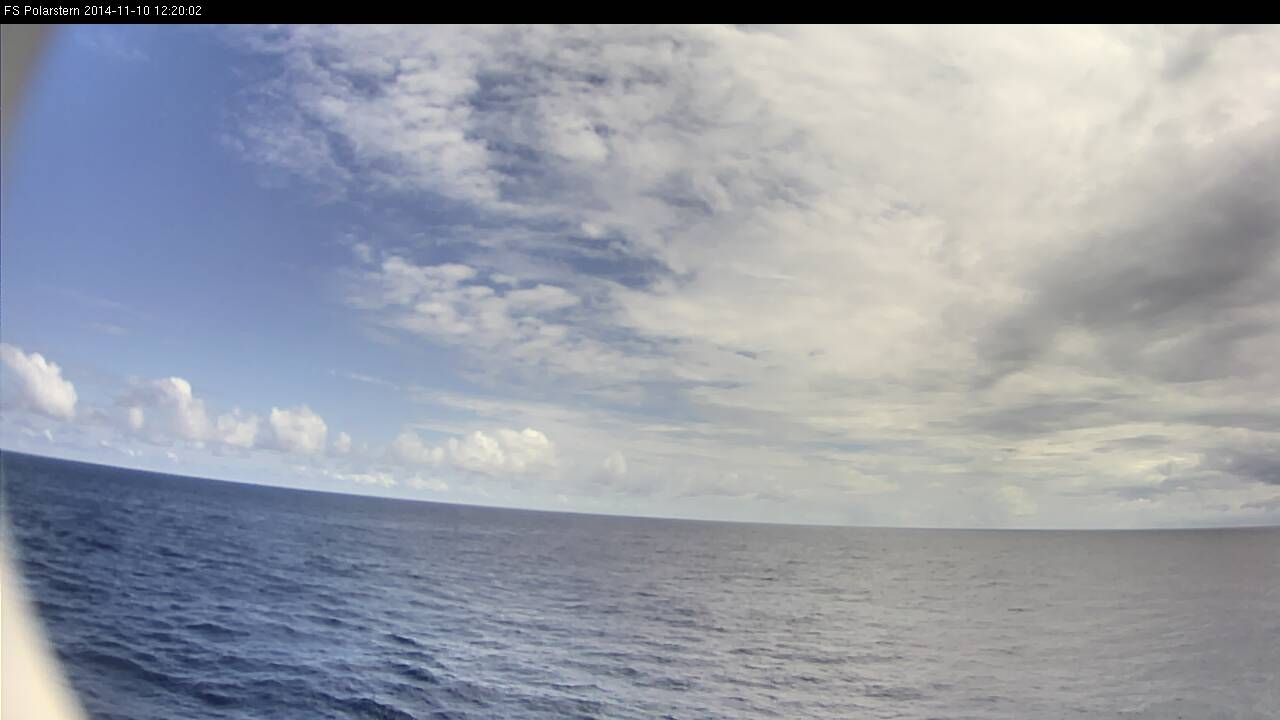
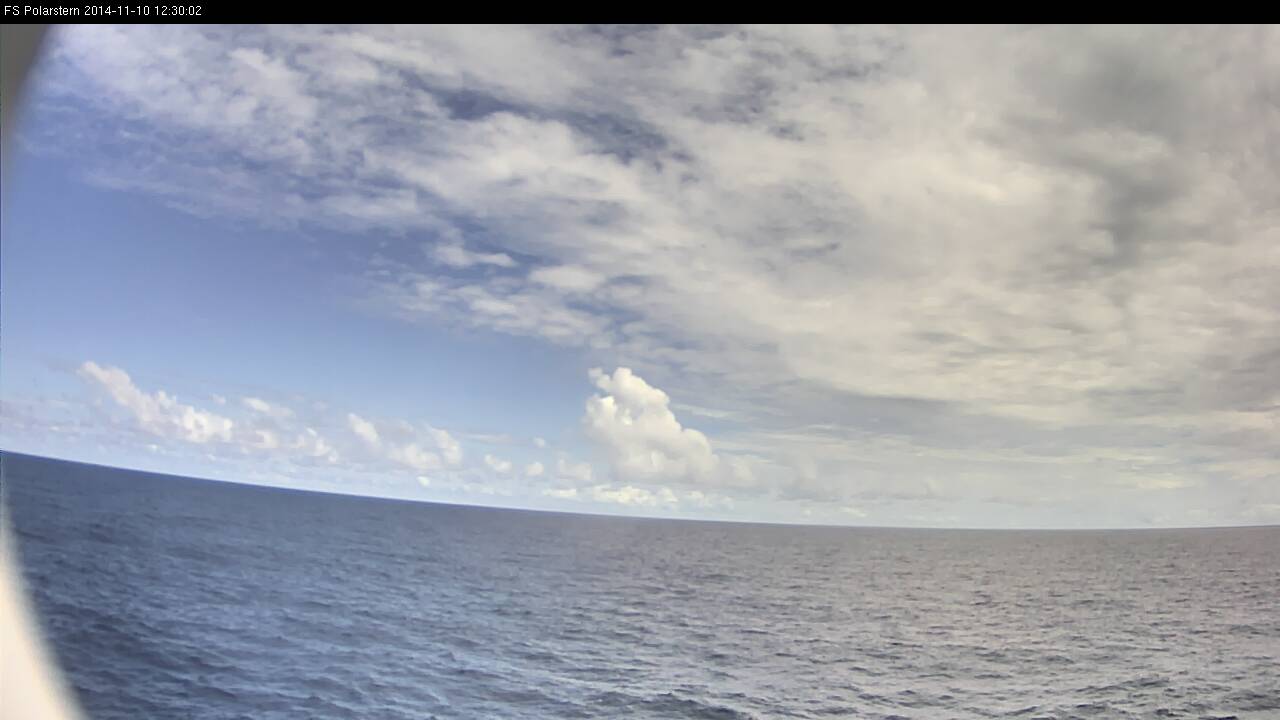
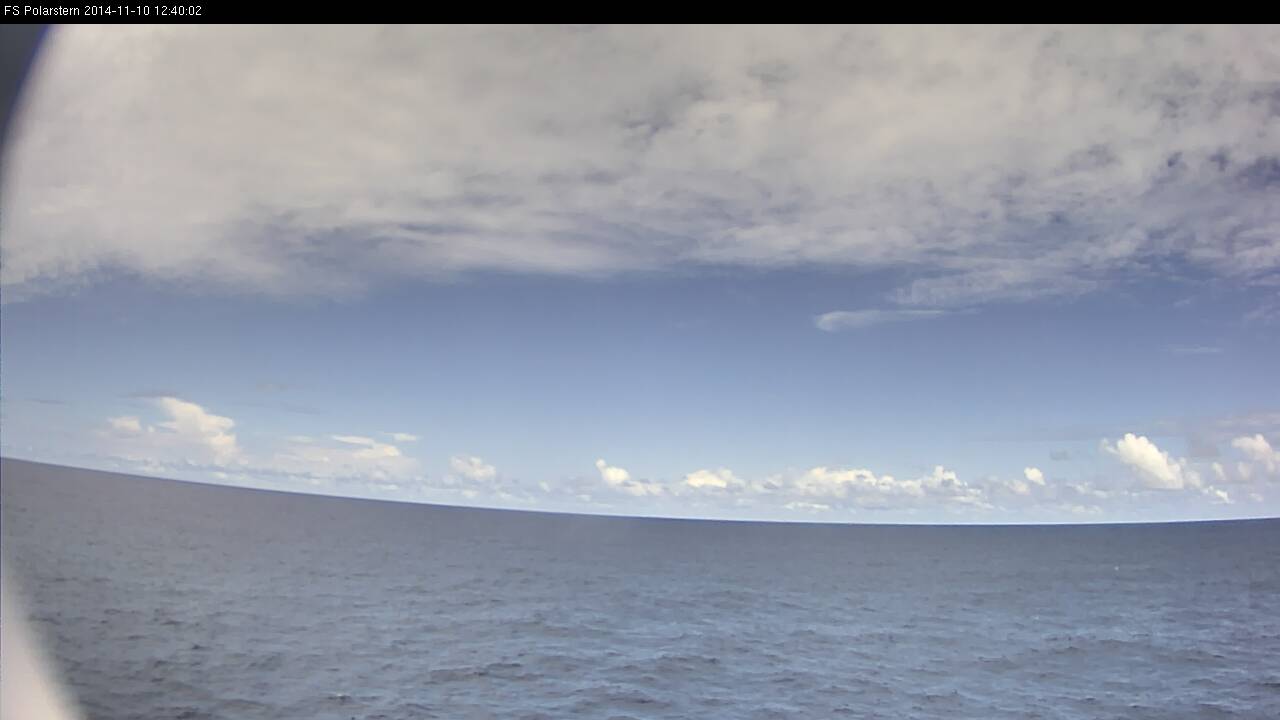
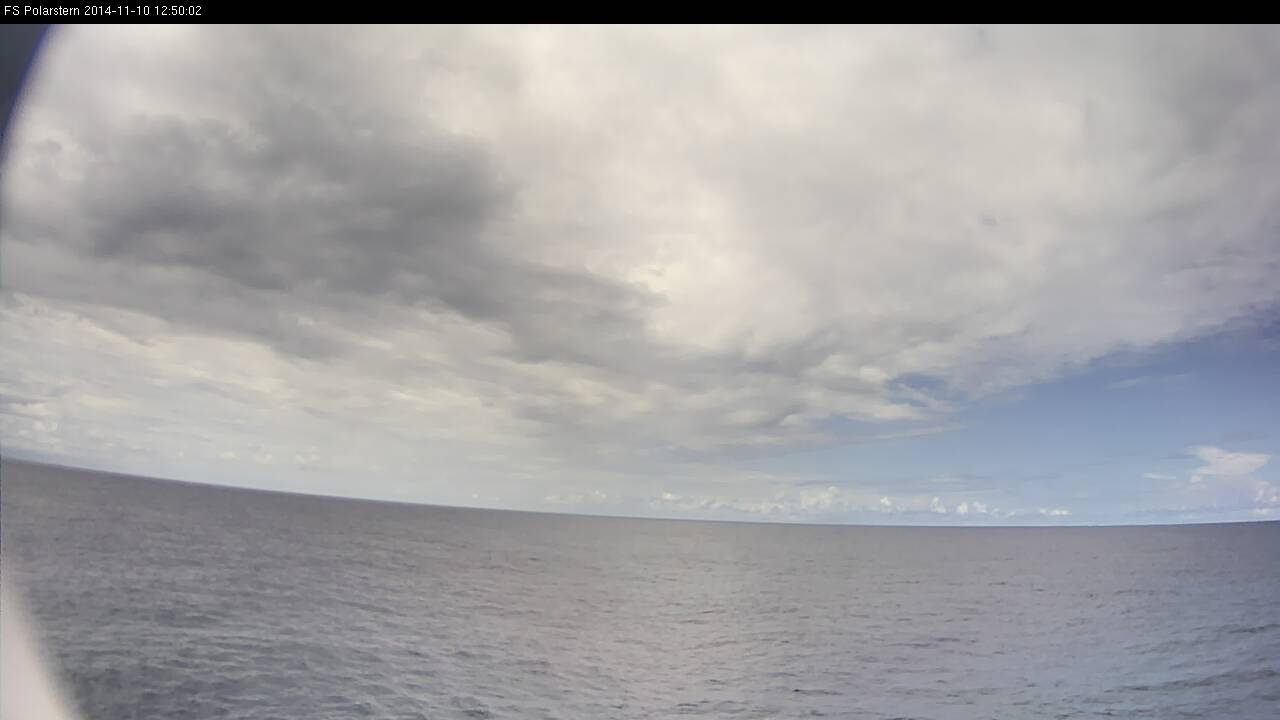
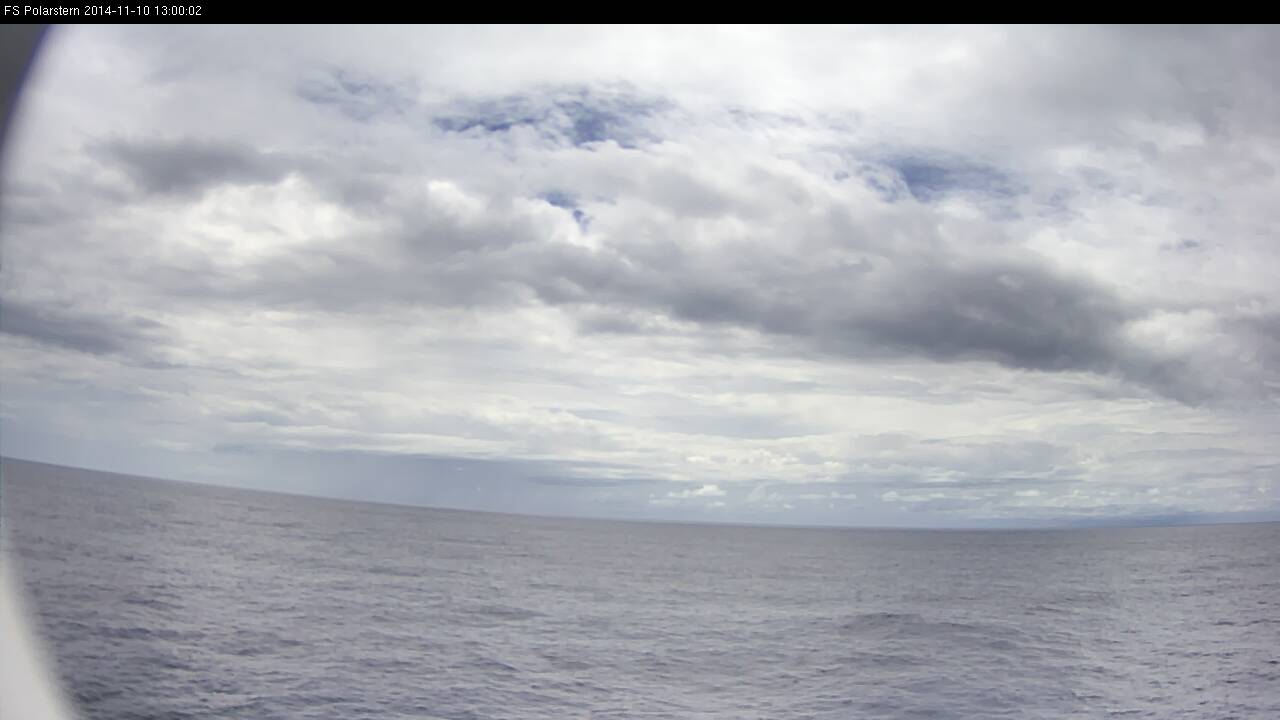
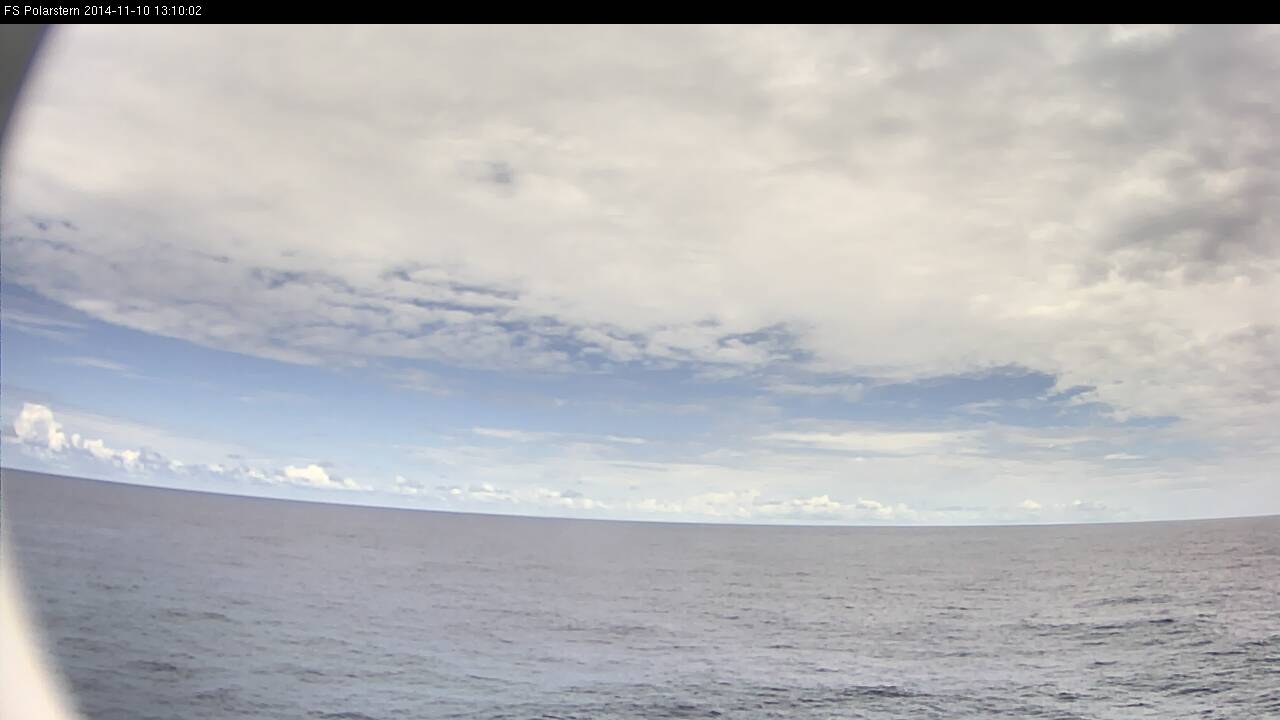
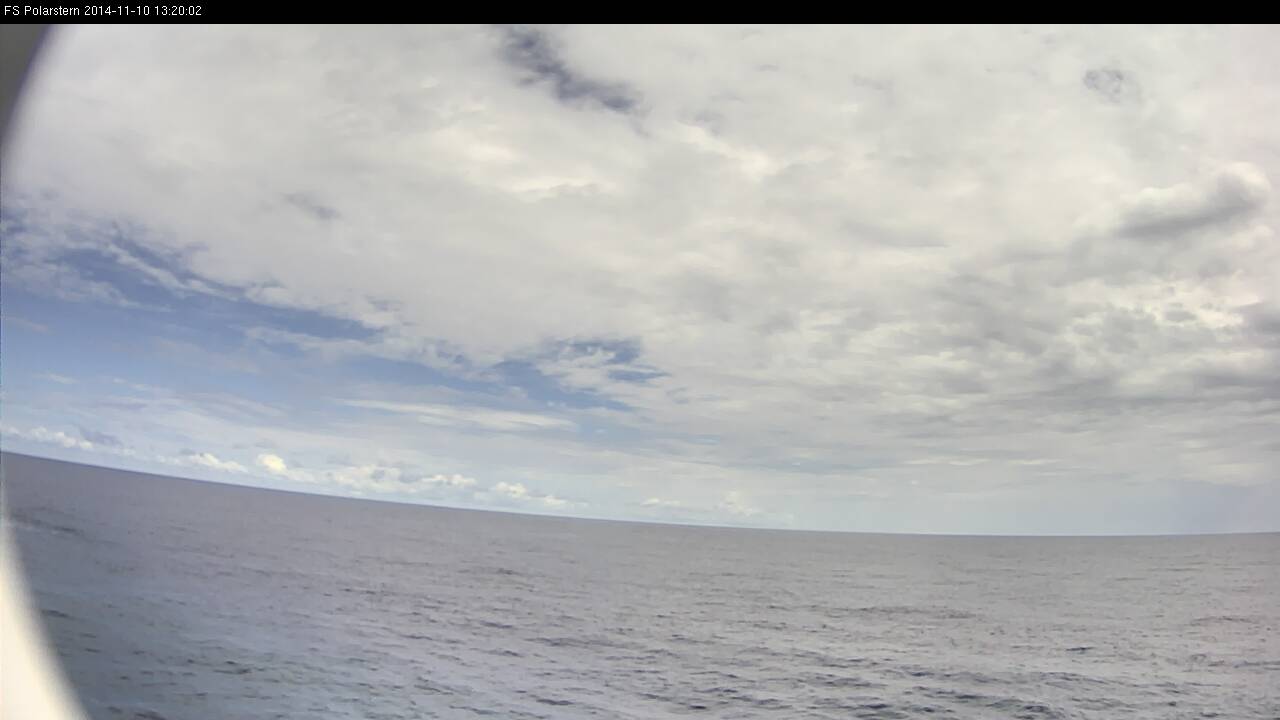
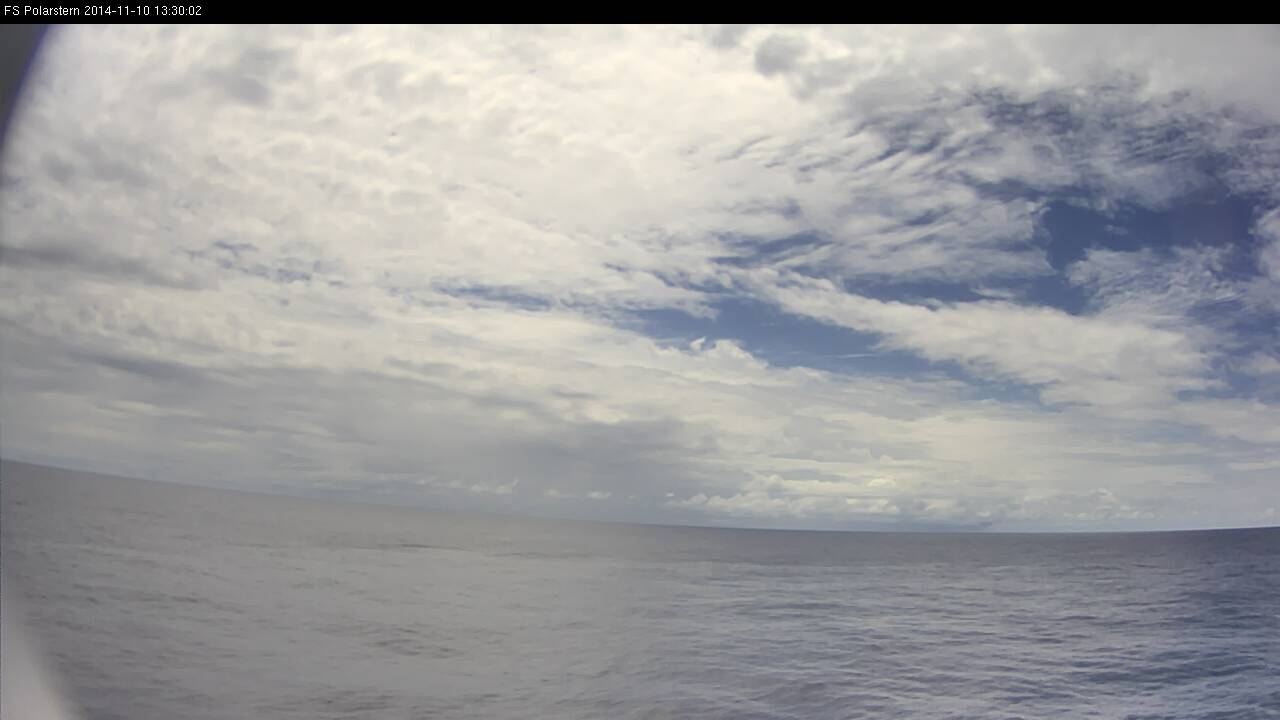
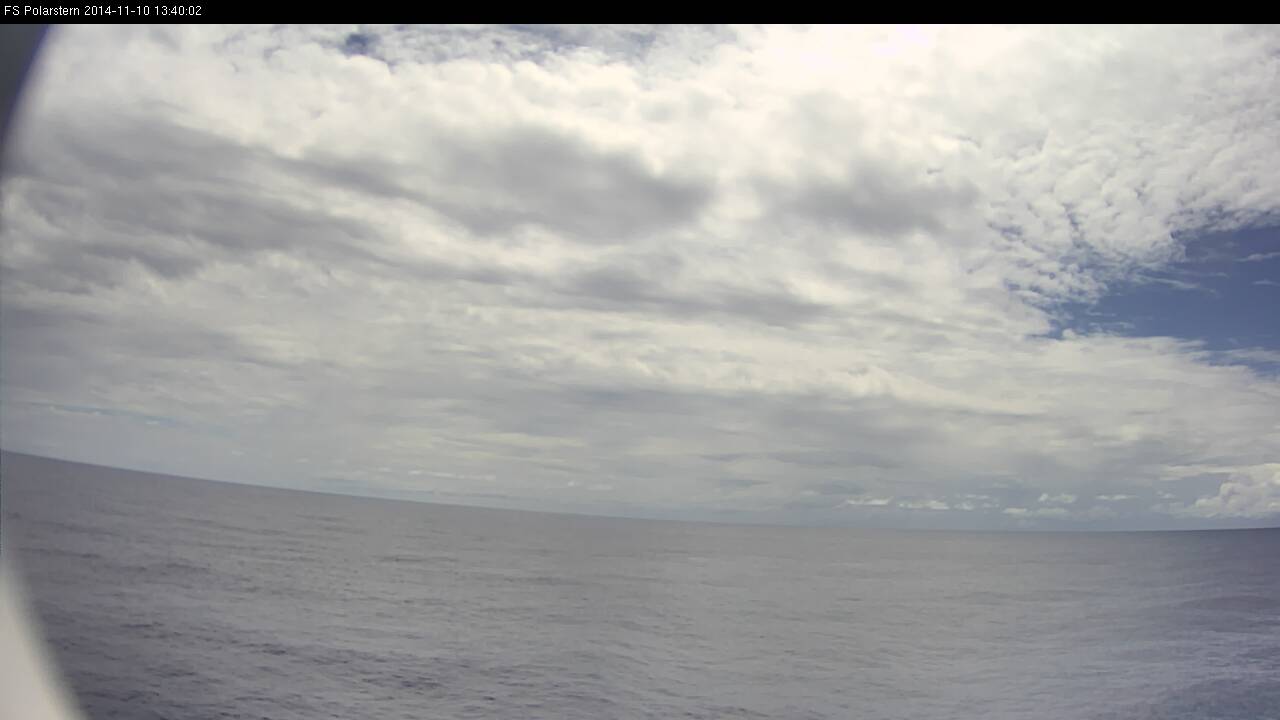
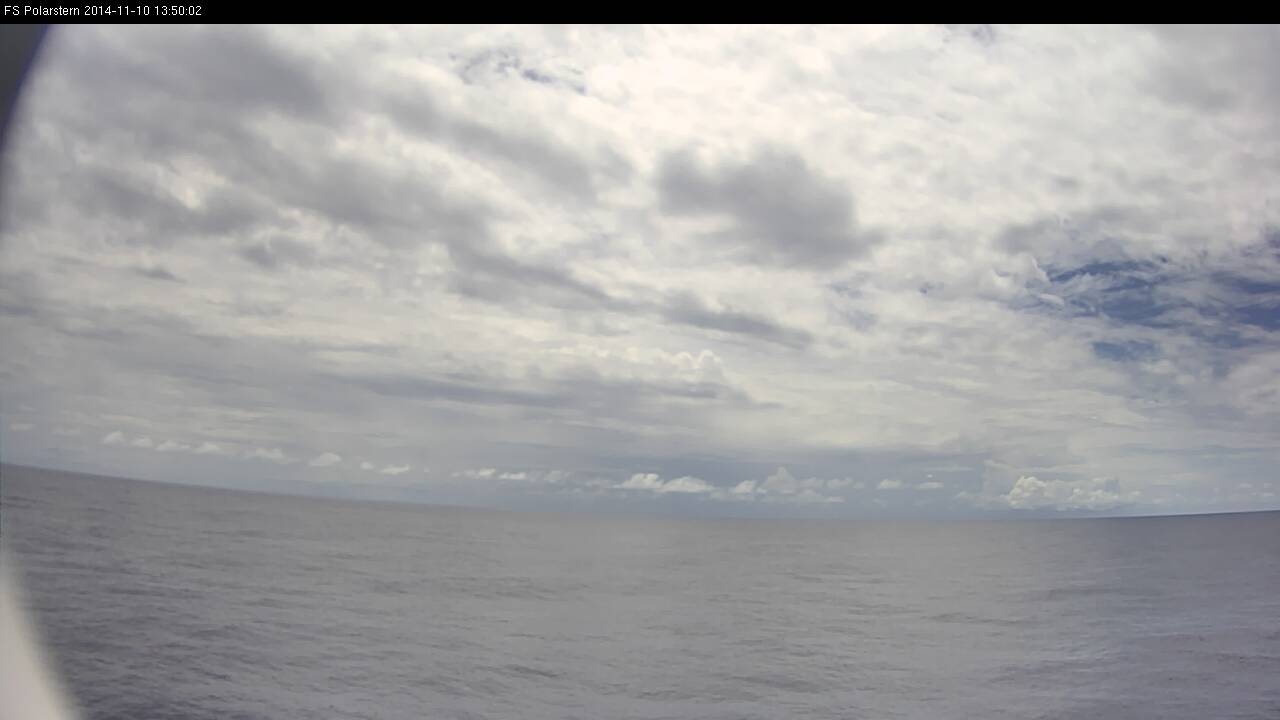
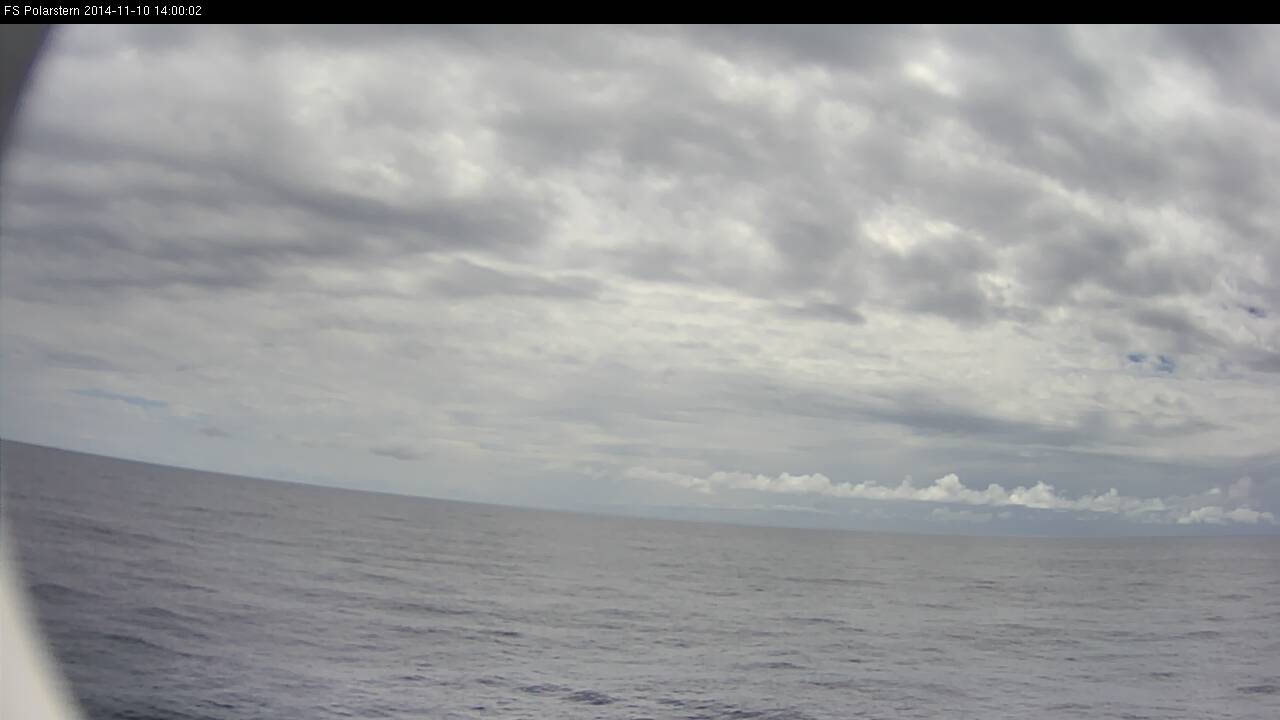
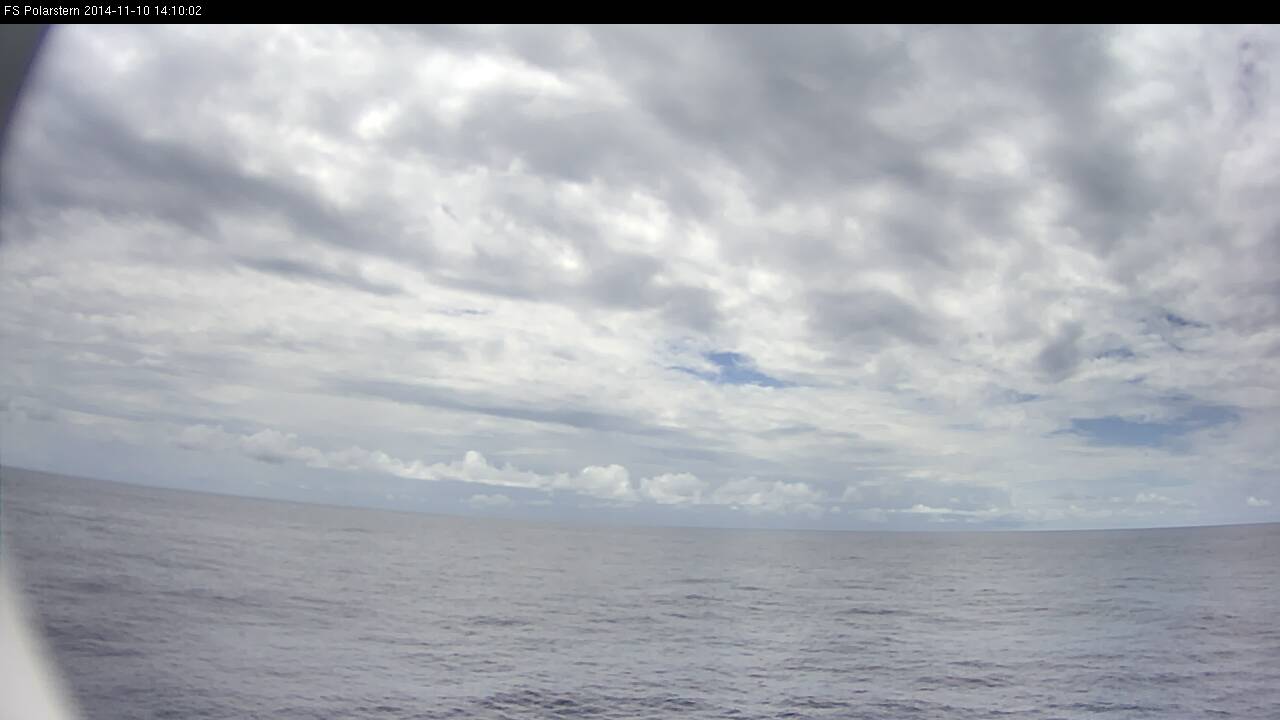
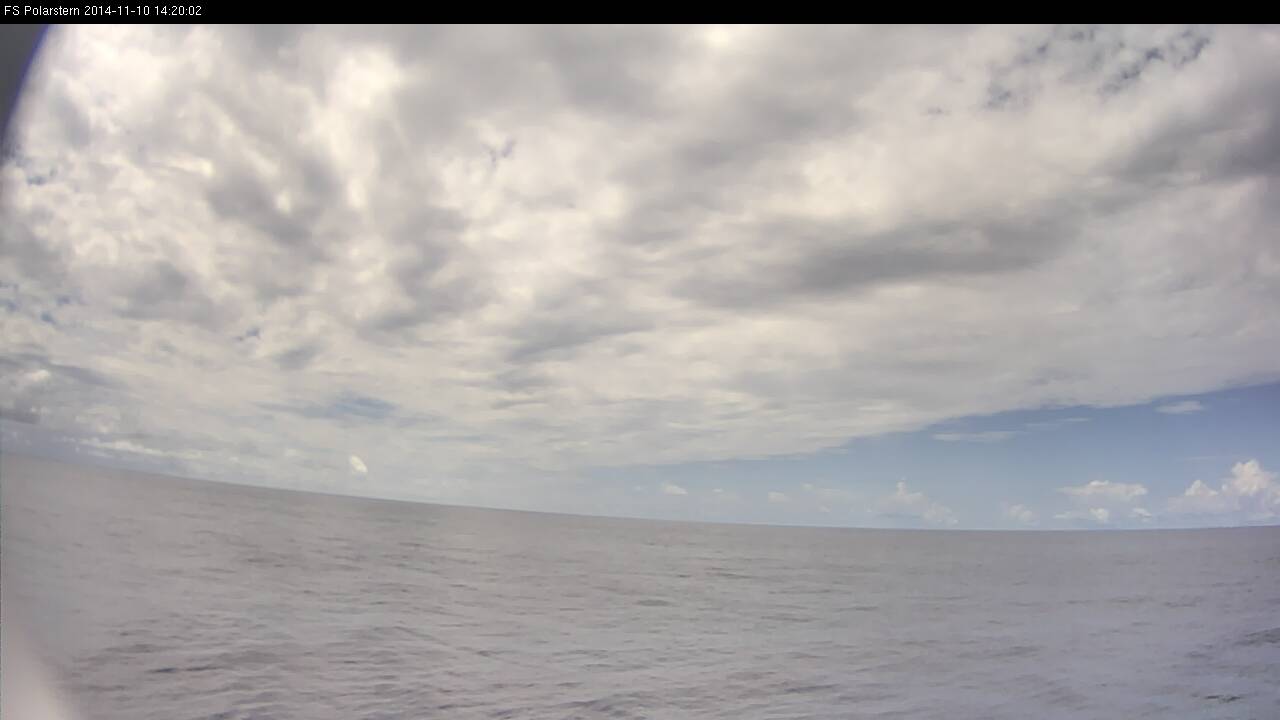
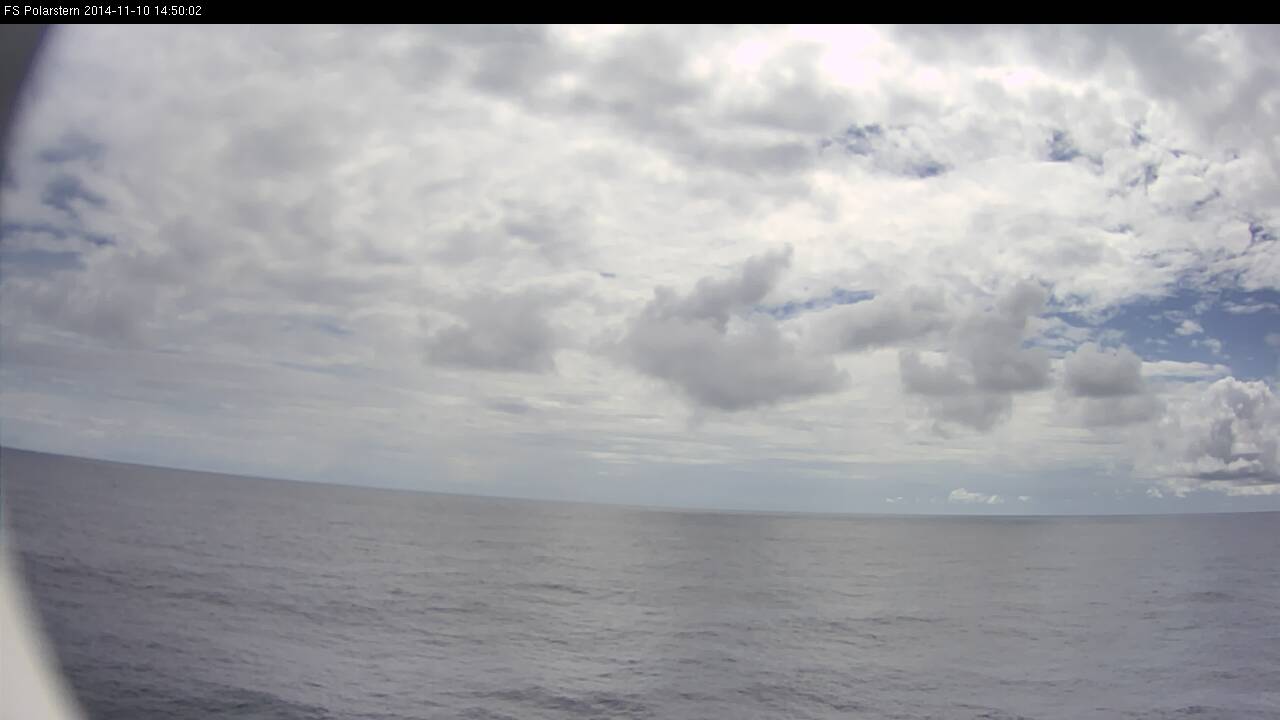
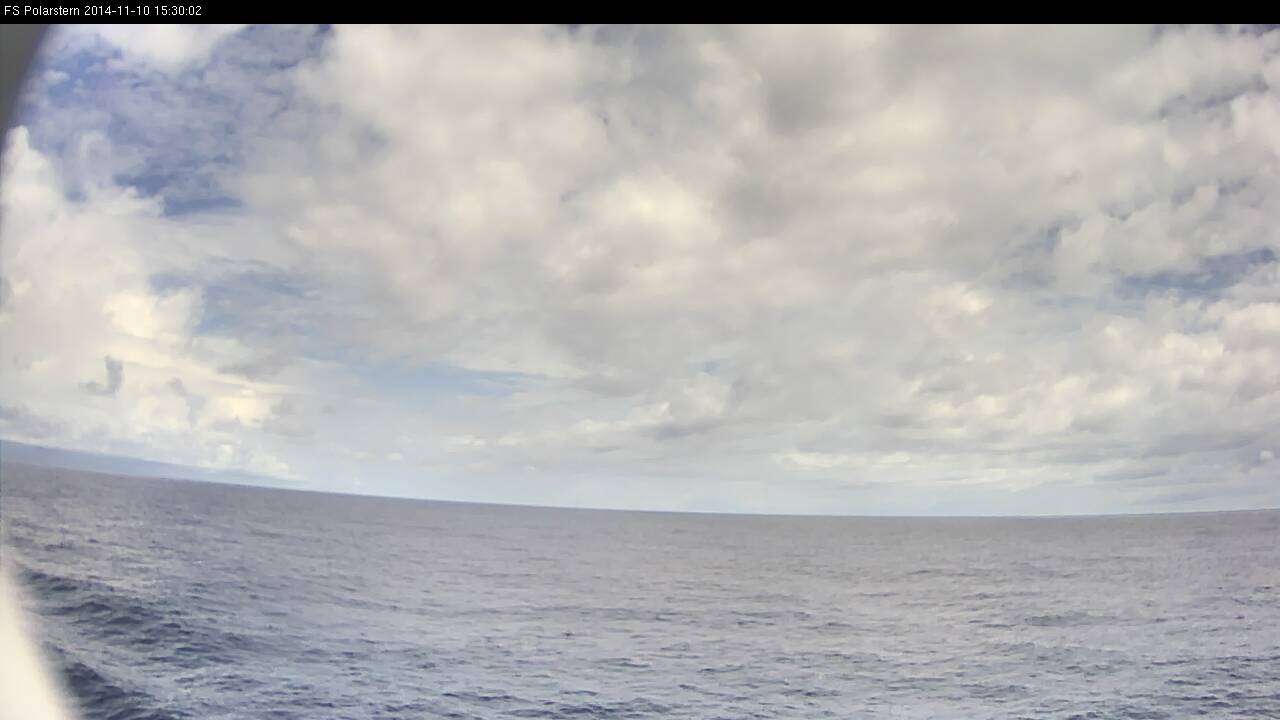
Figure L2-13: 10 Nov 2014,12:40 UTC. Cumulus congestus and cumulonimbus on the horizon, as seen from the webcam in the direction of travel on the left side (here eastward). Source: DWD.
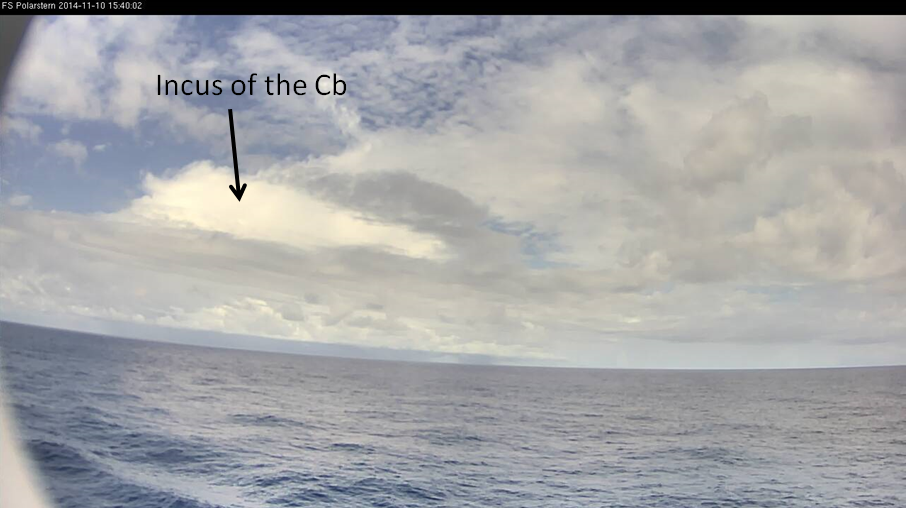
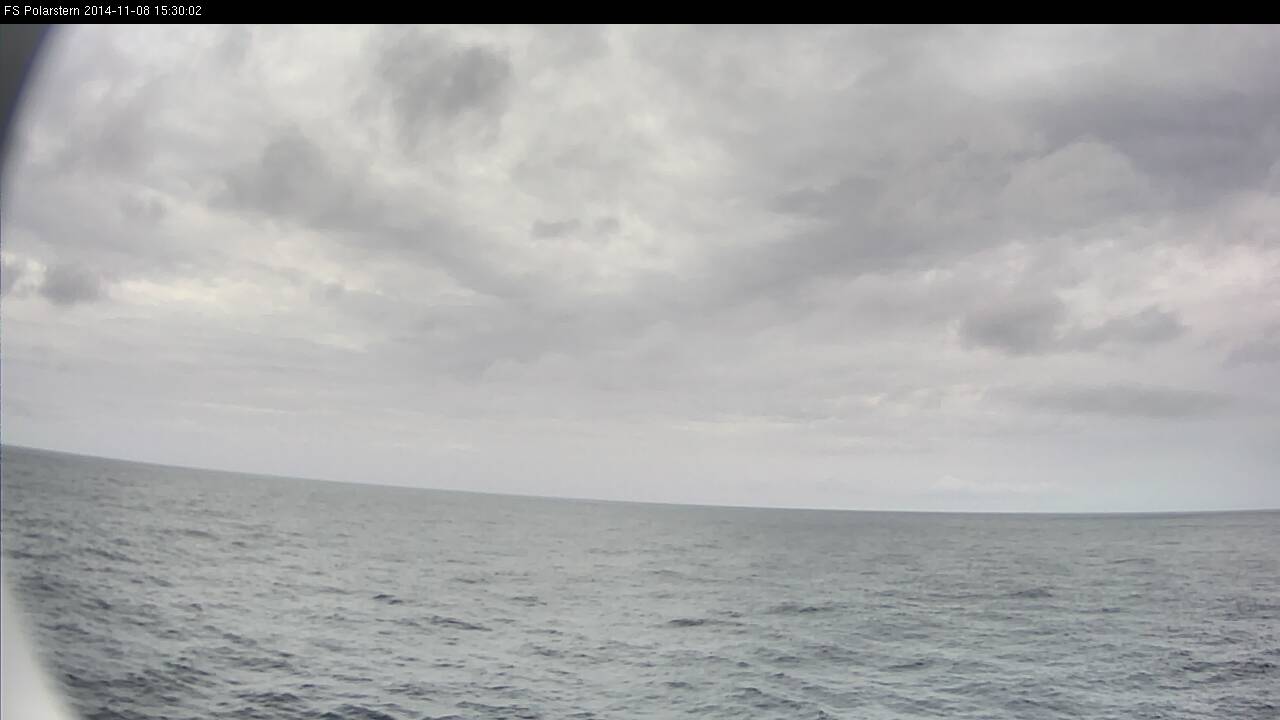
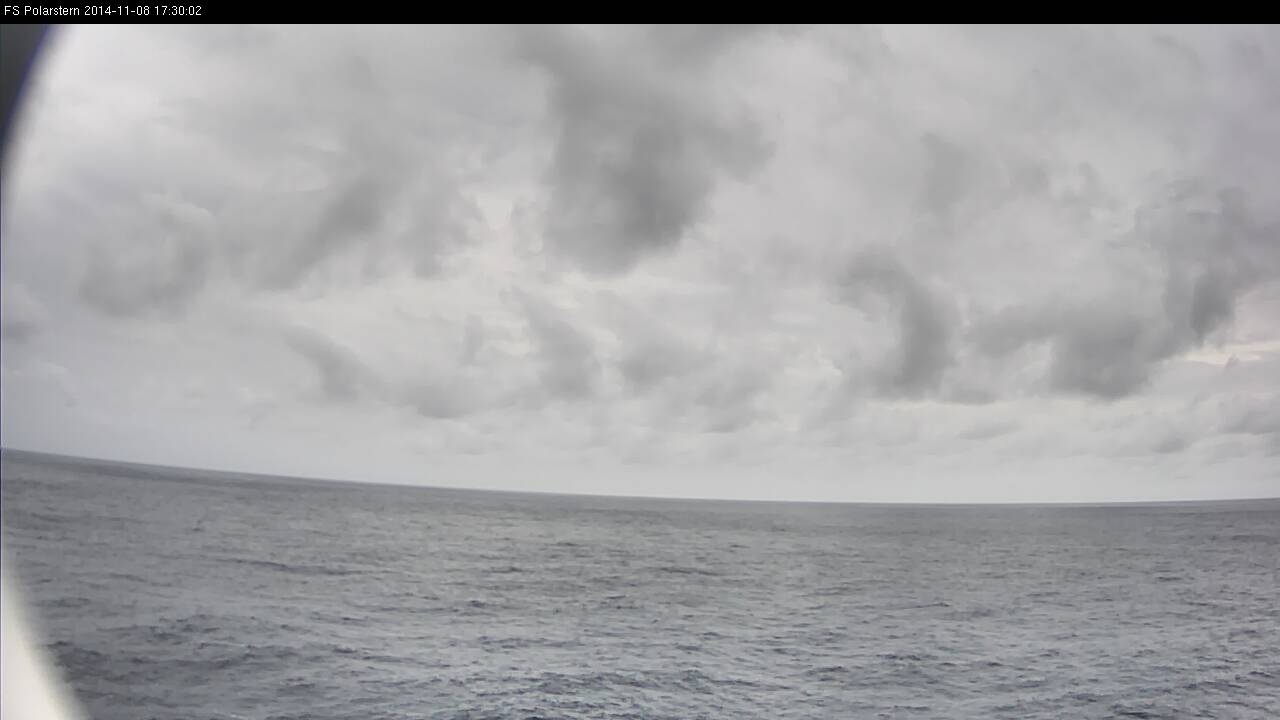
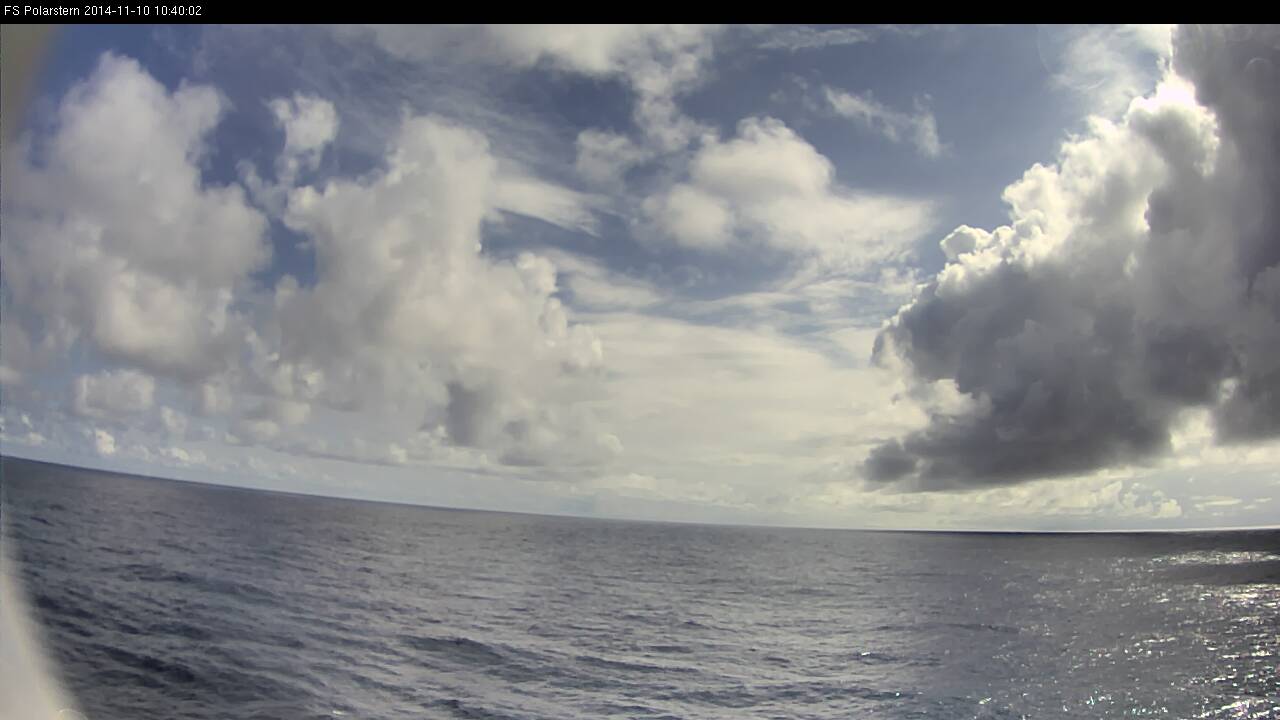
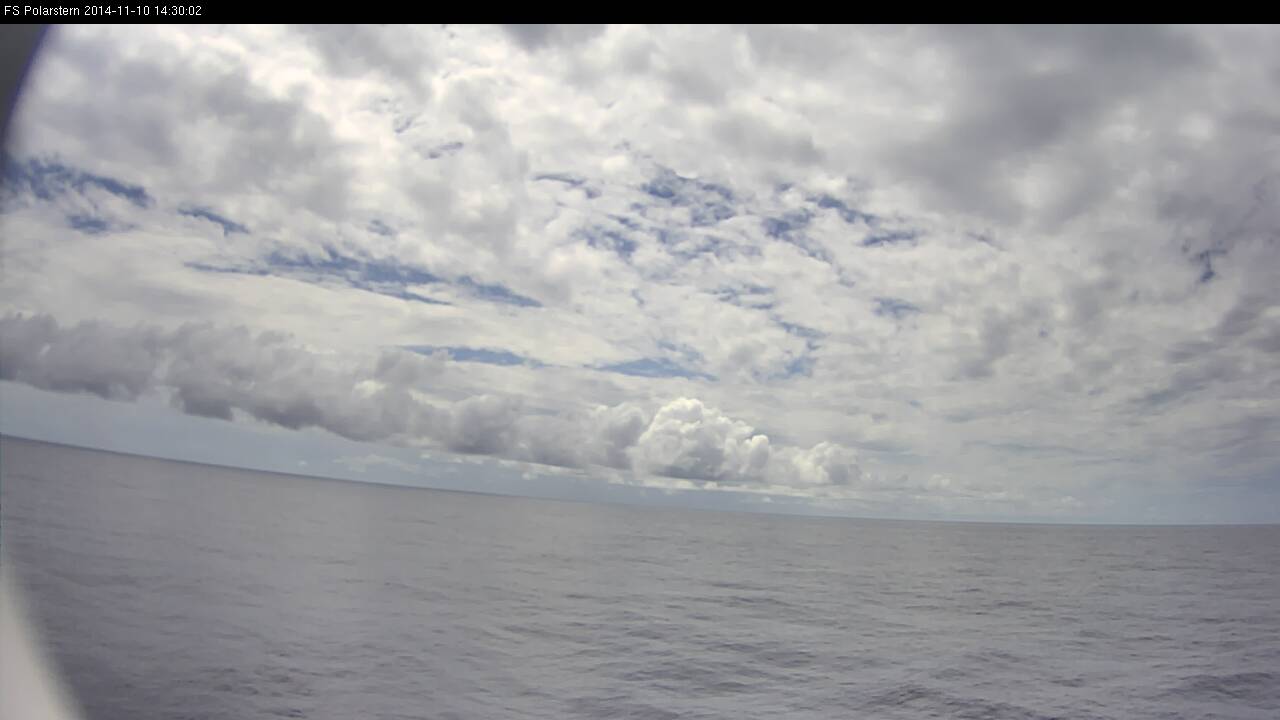
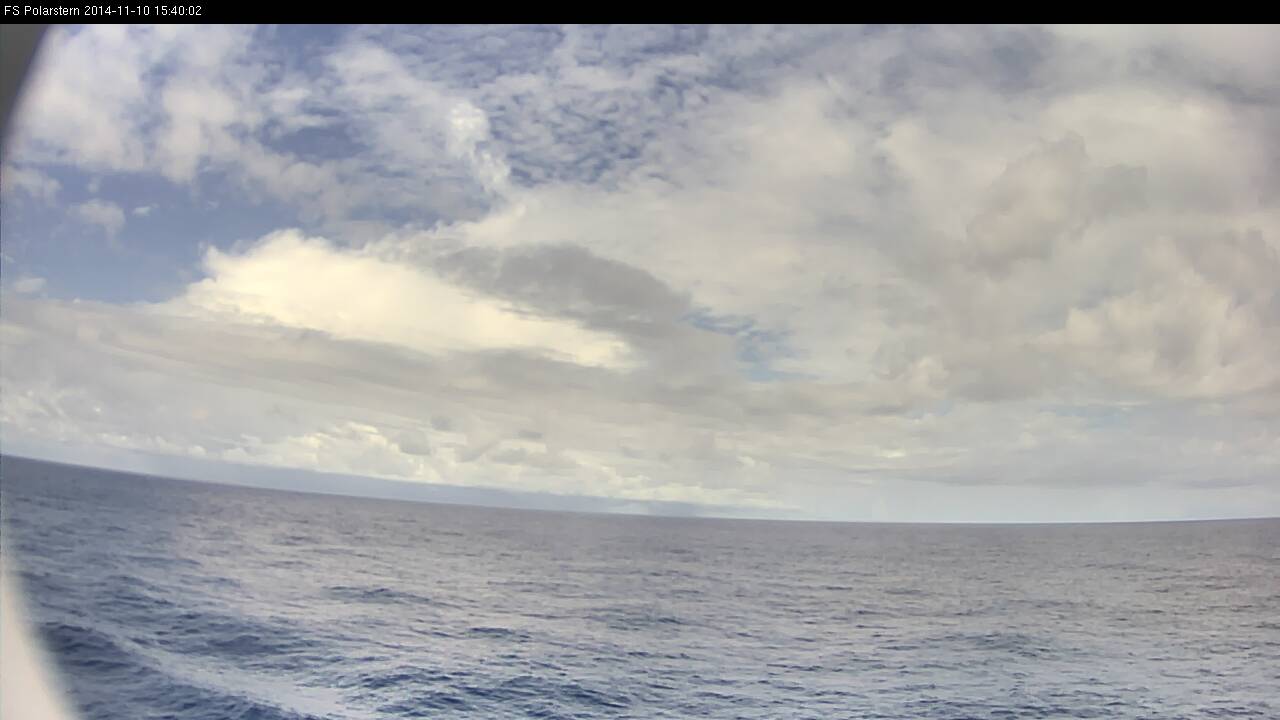
Figure L2-14: 10 Nov 2014, 15:40 UTC. Pronounced cumulonimbus with an incus, which is seen in the satellite images. Source: DWD.
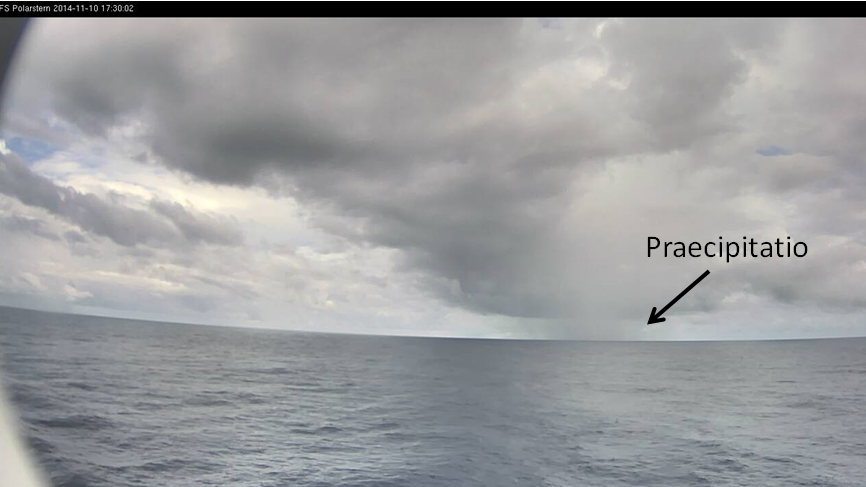
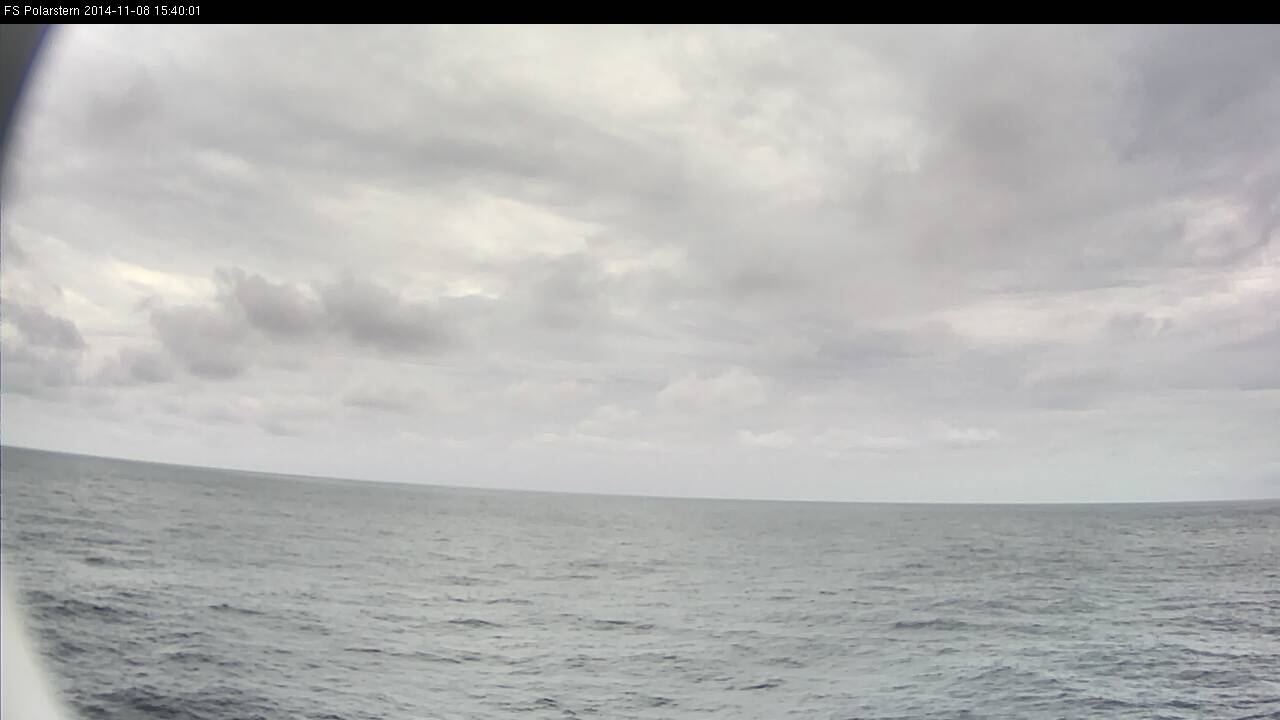
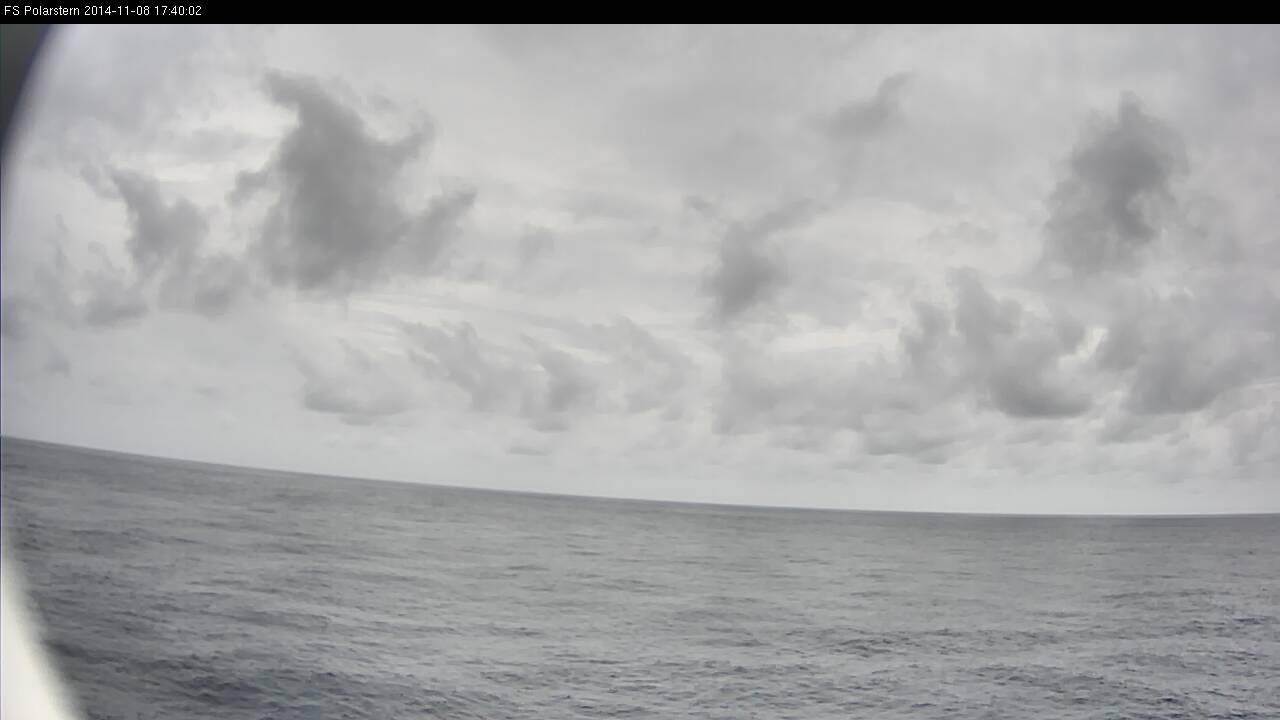
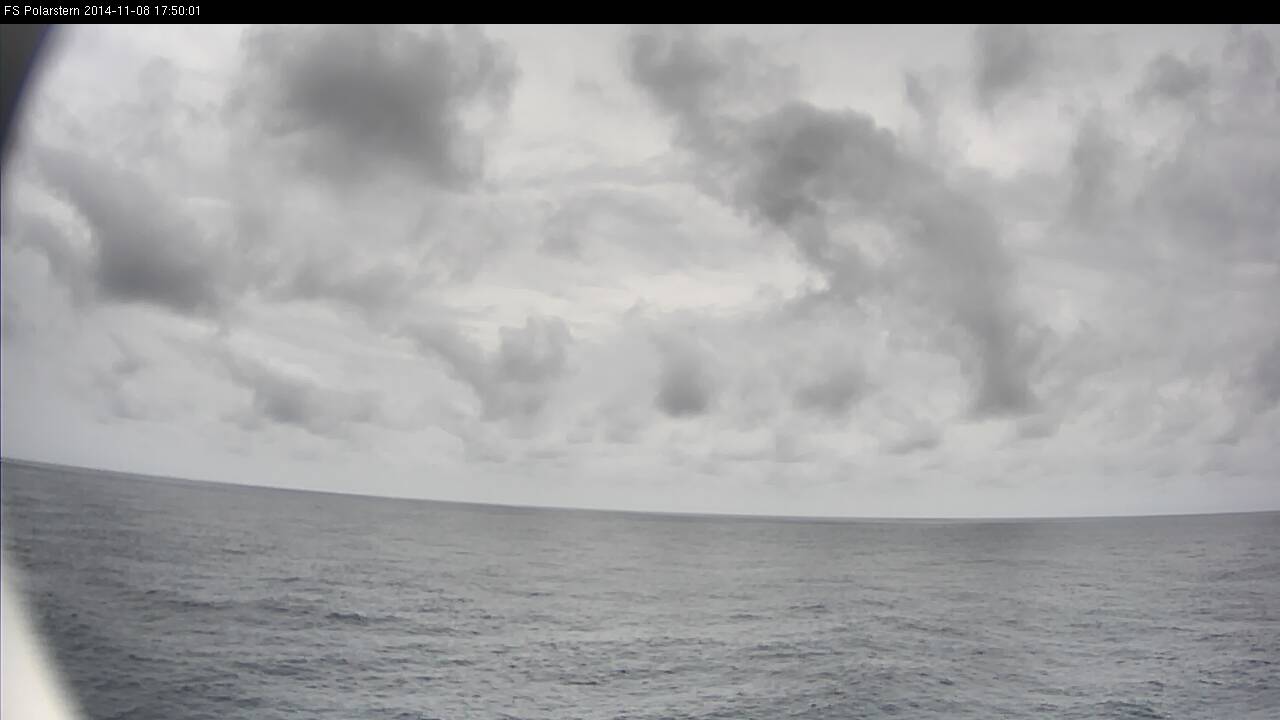
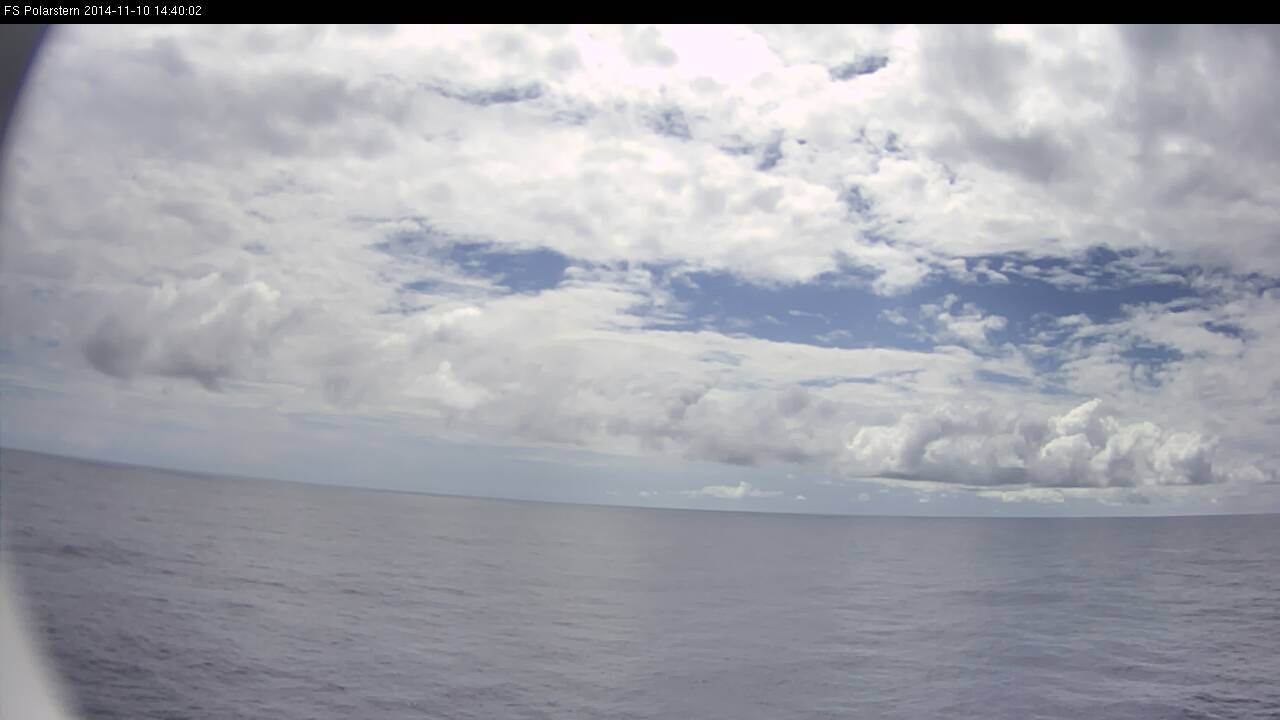
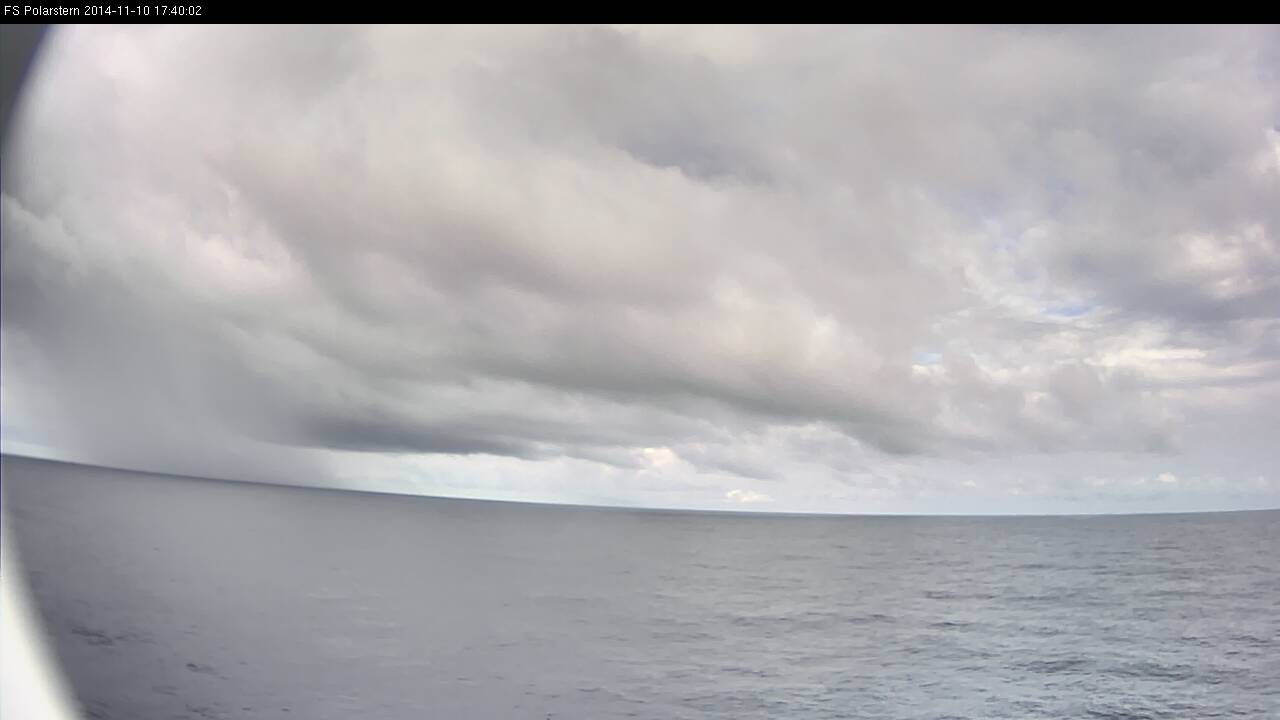
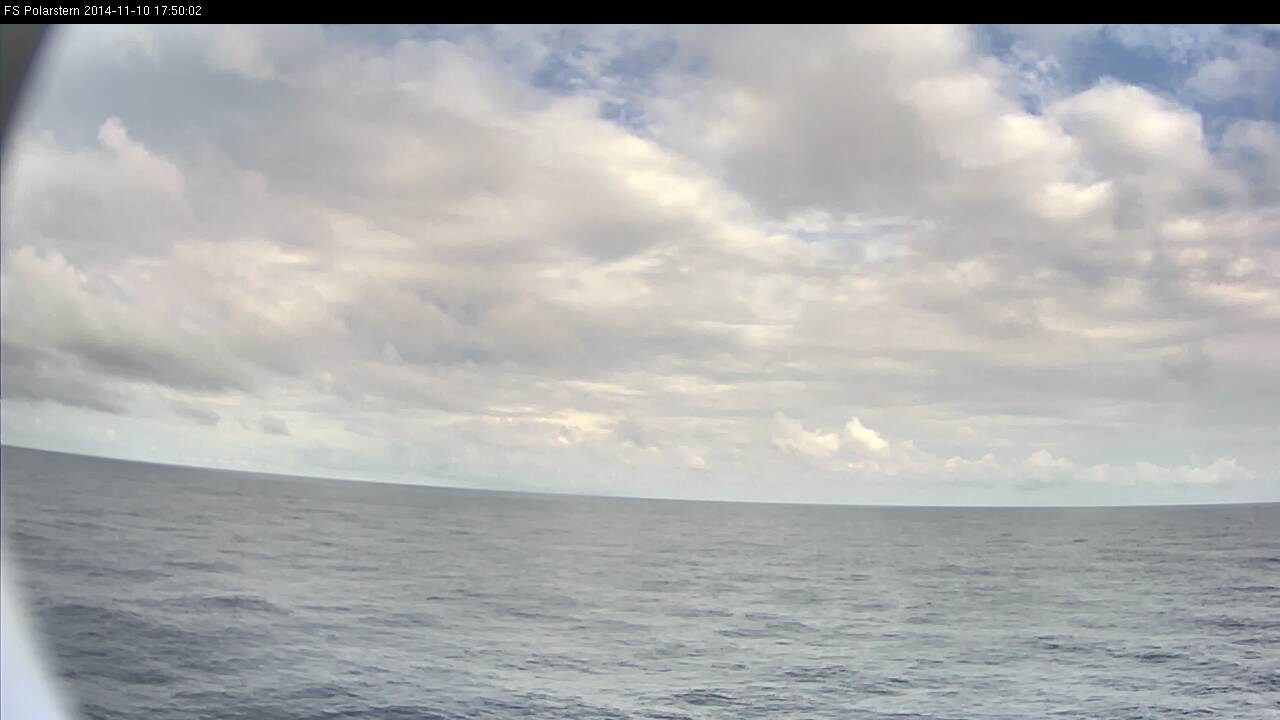
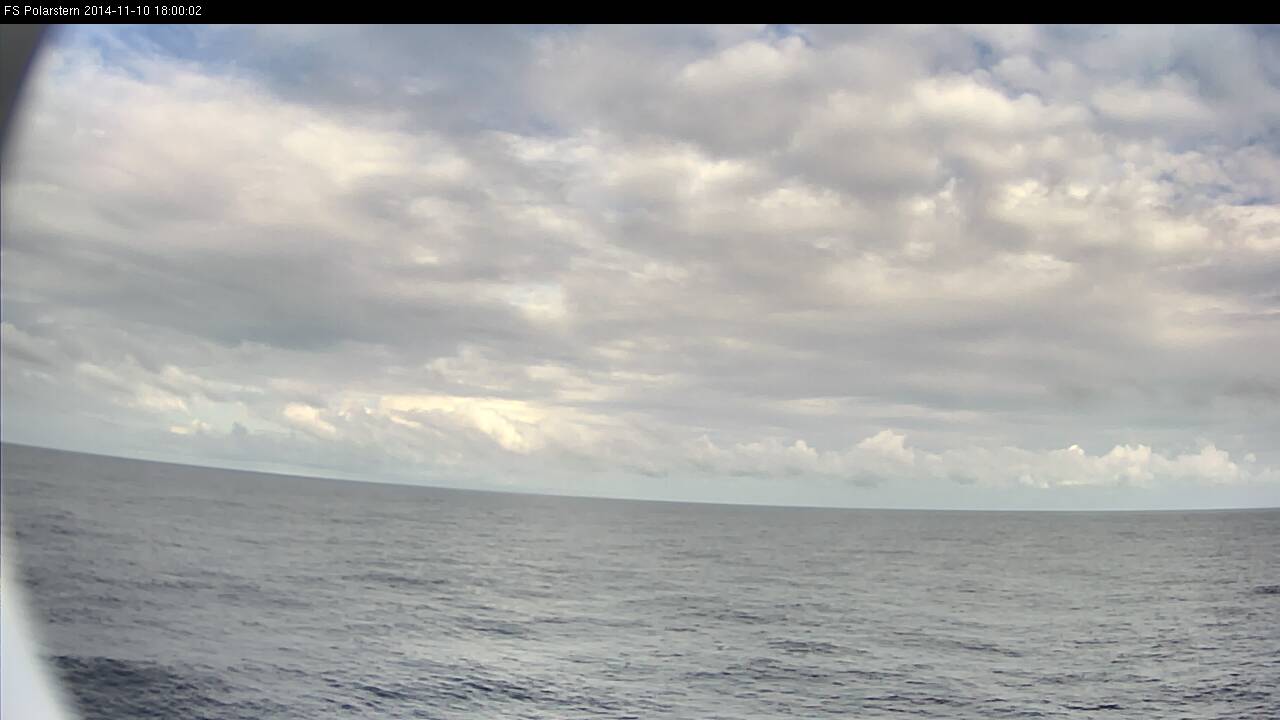
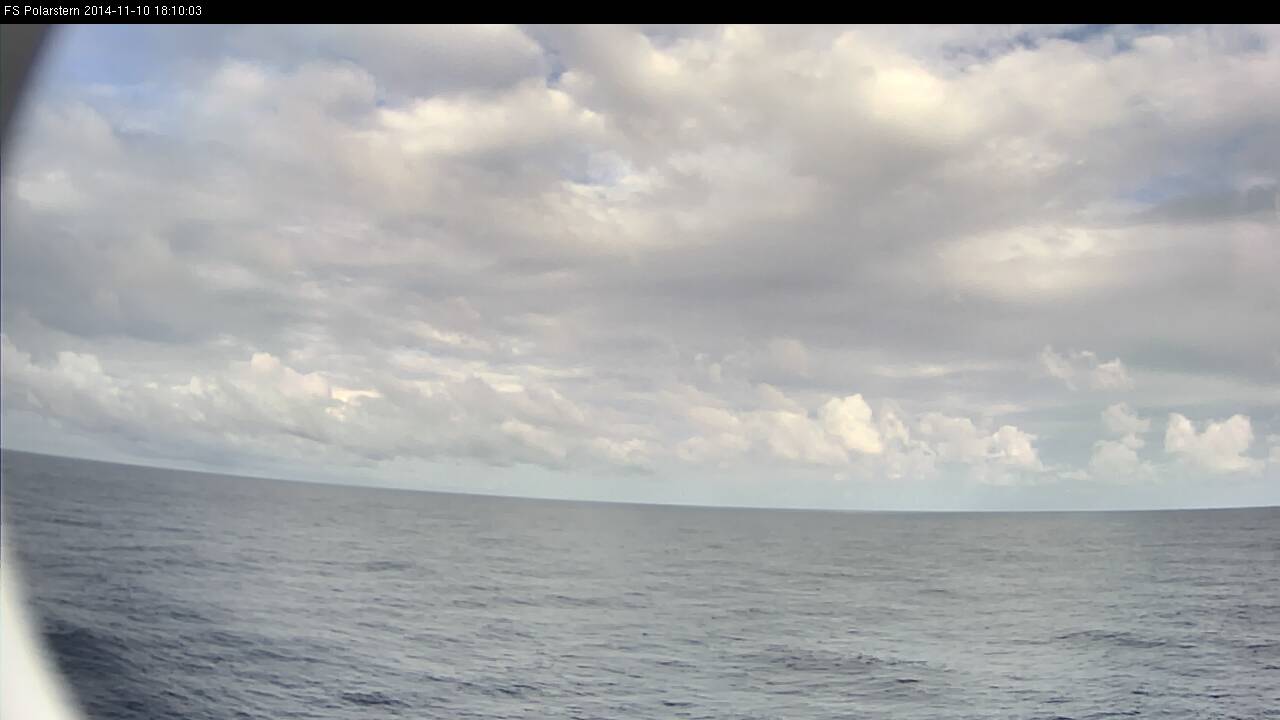
Figure L2-15: 10 Nov 2014, 17:30 UTC. Rain shower with precipitation that reaches the ocean surface (Praecipitatio). Source: DWD.
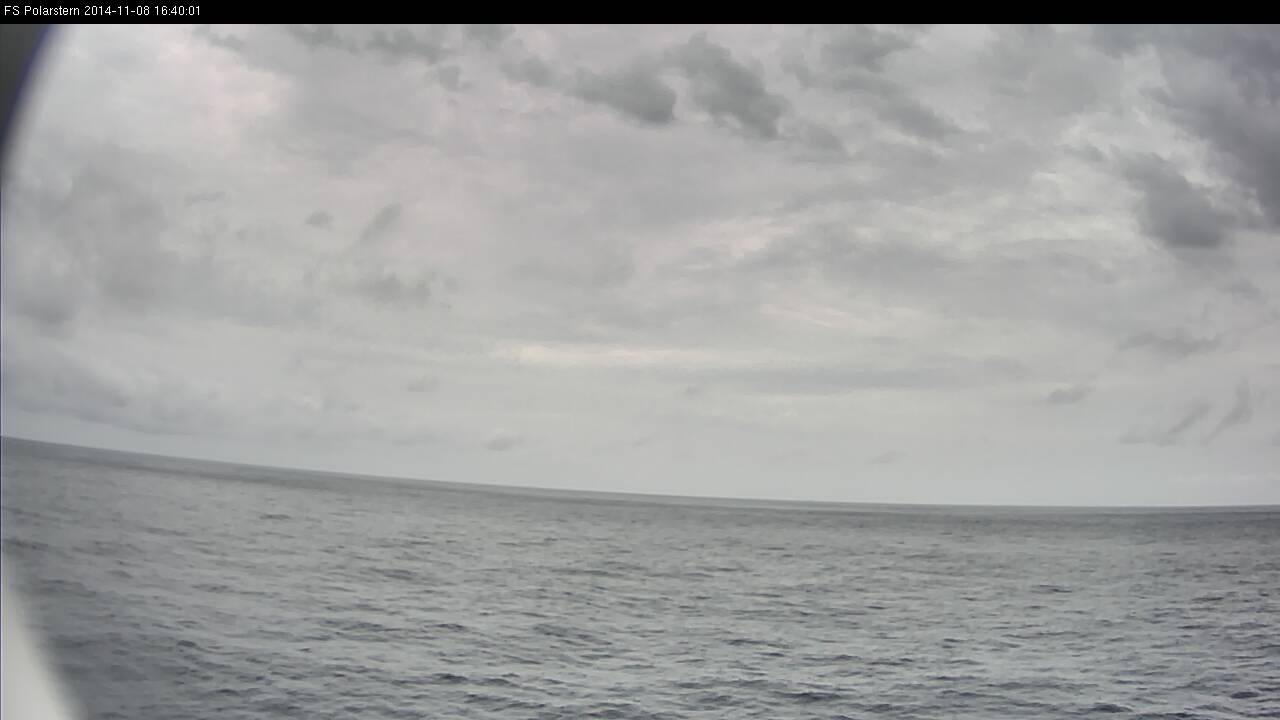
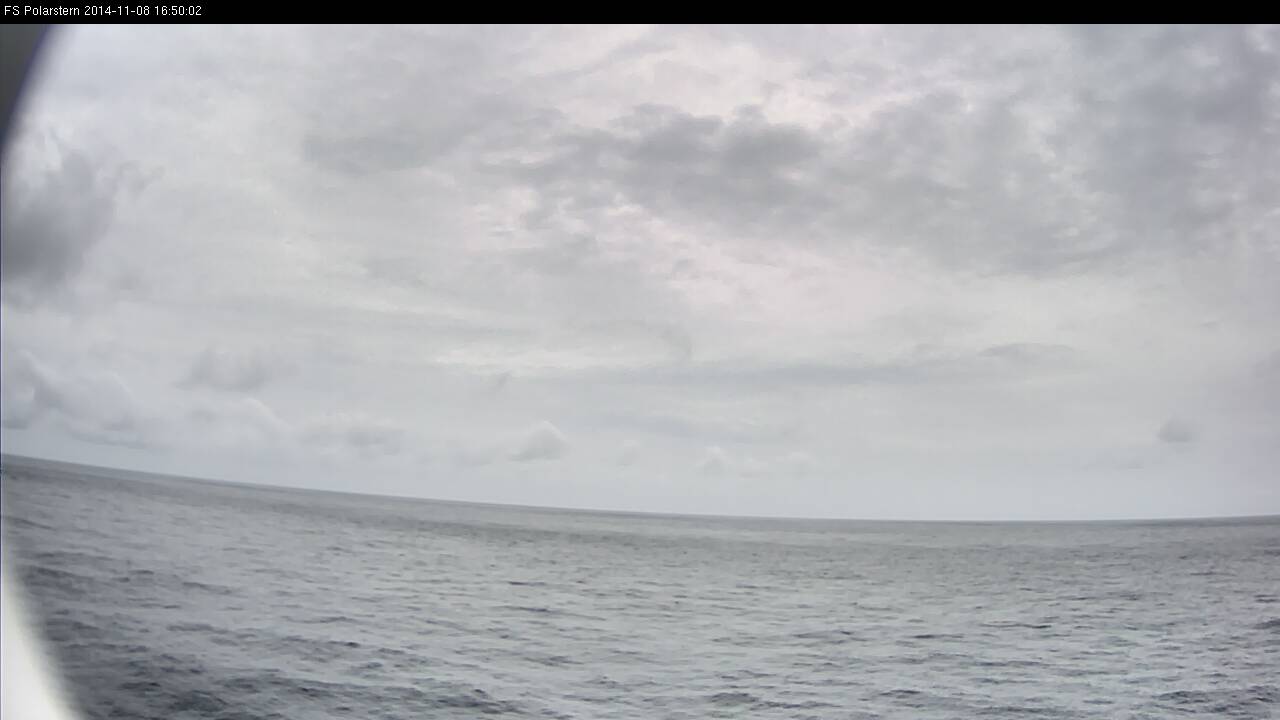
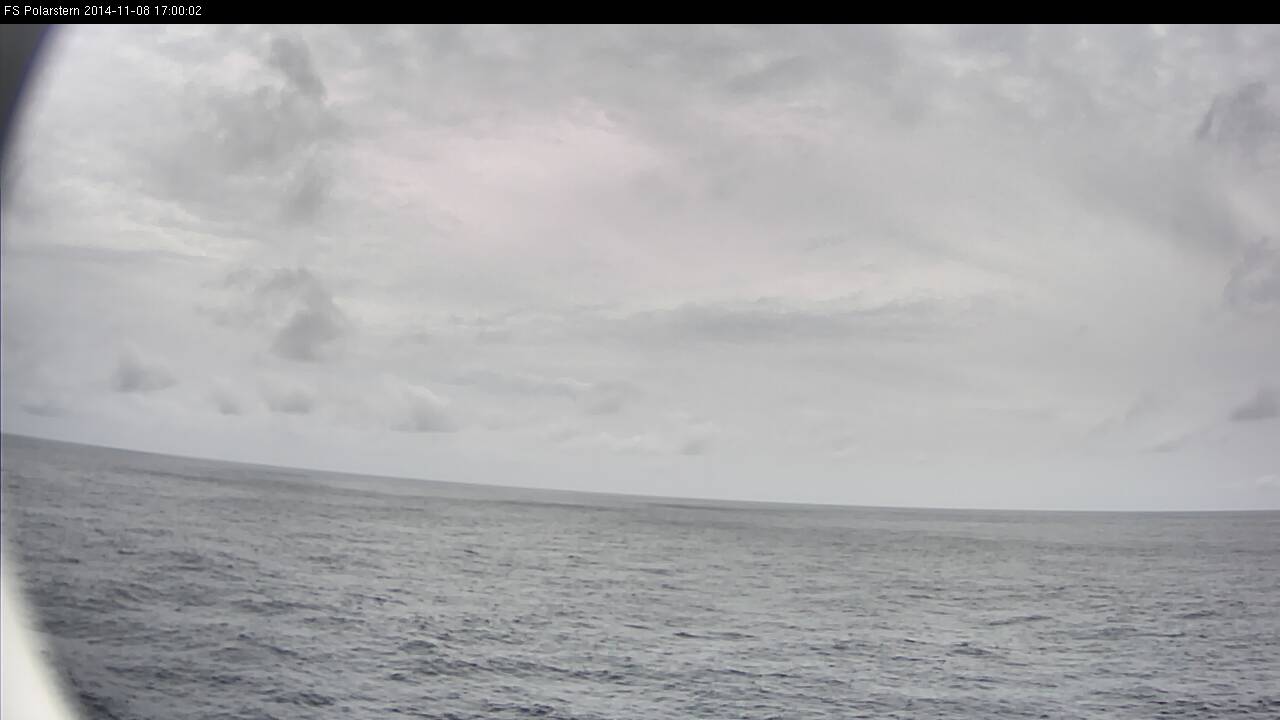
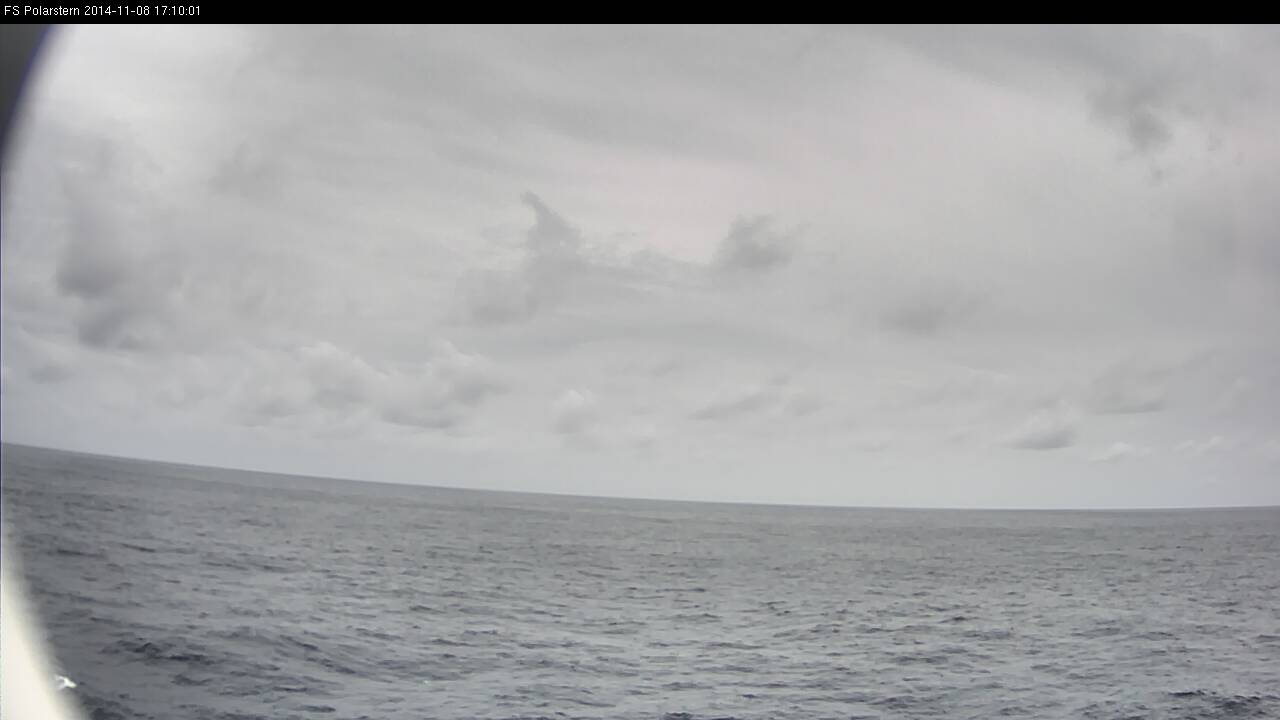
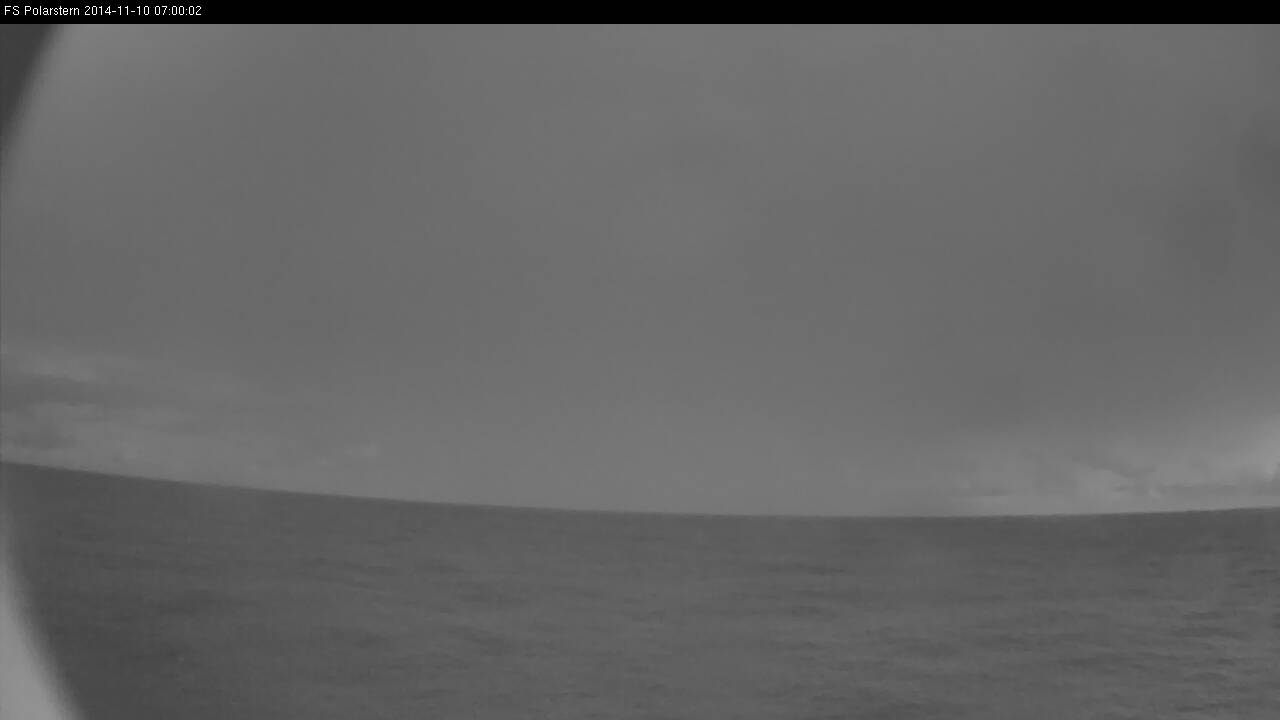
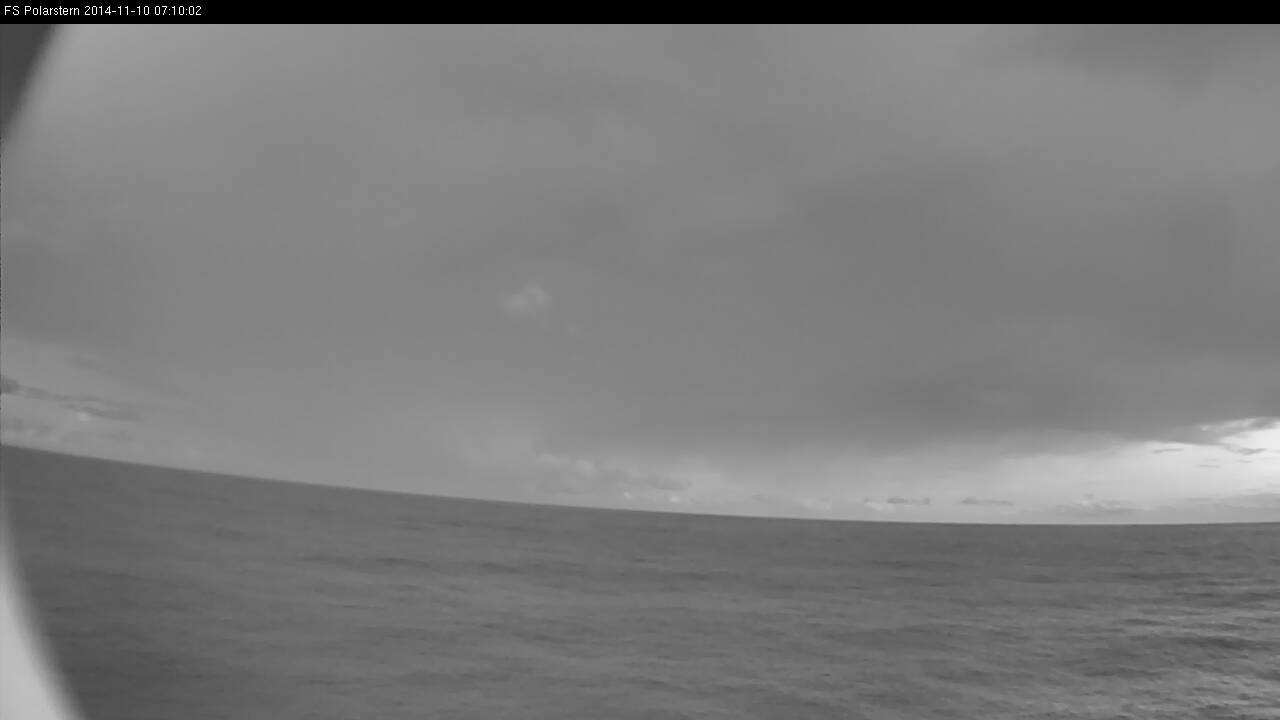
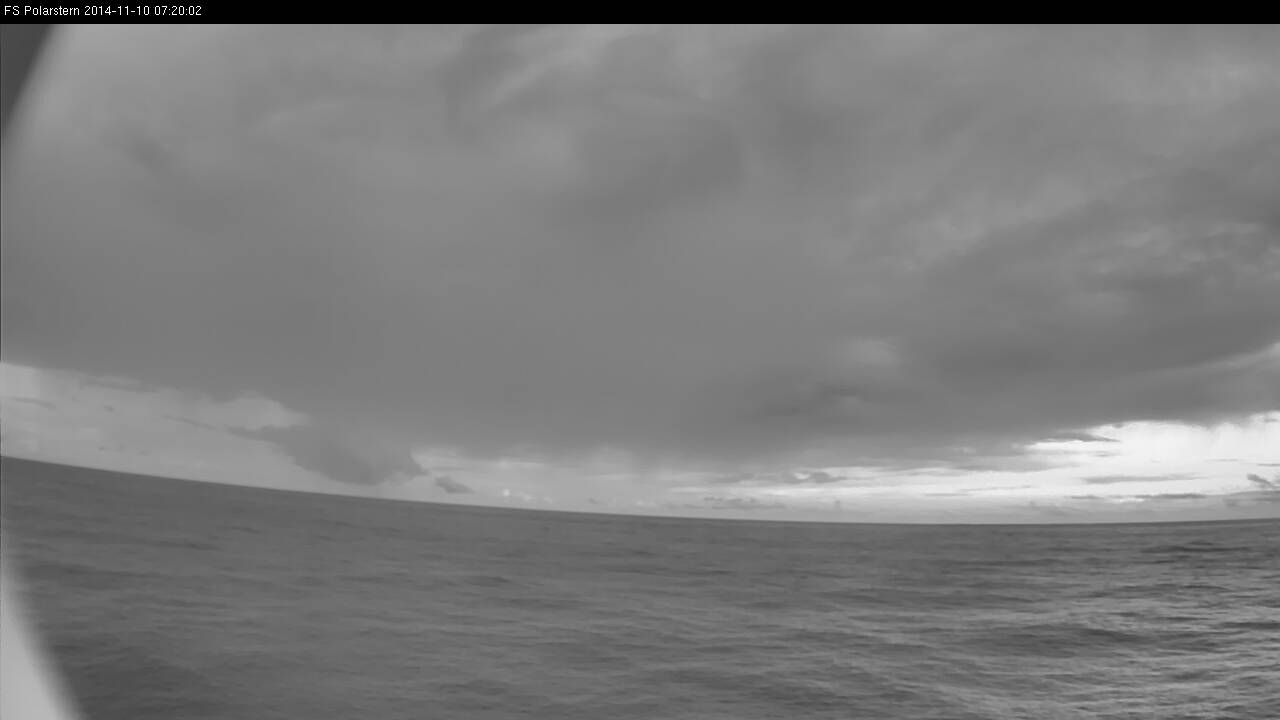
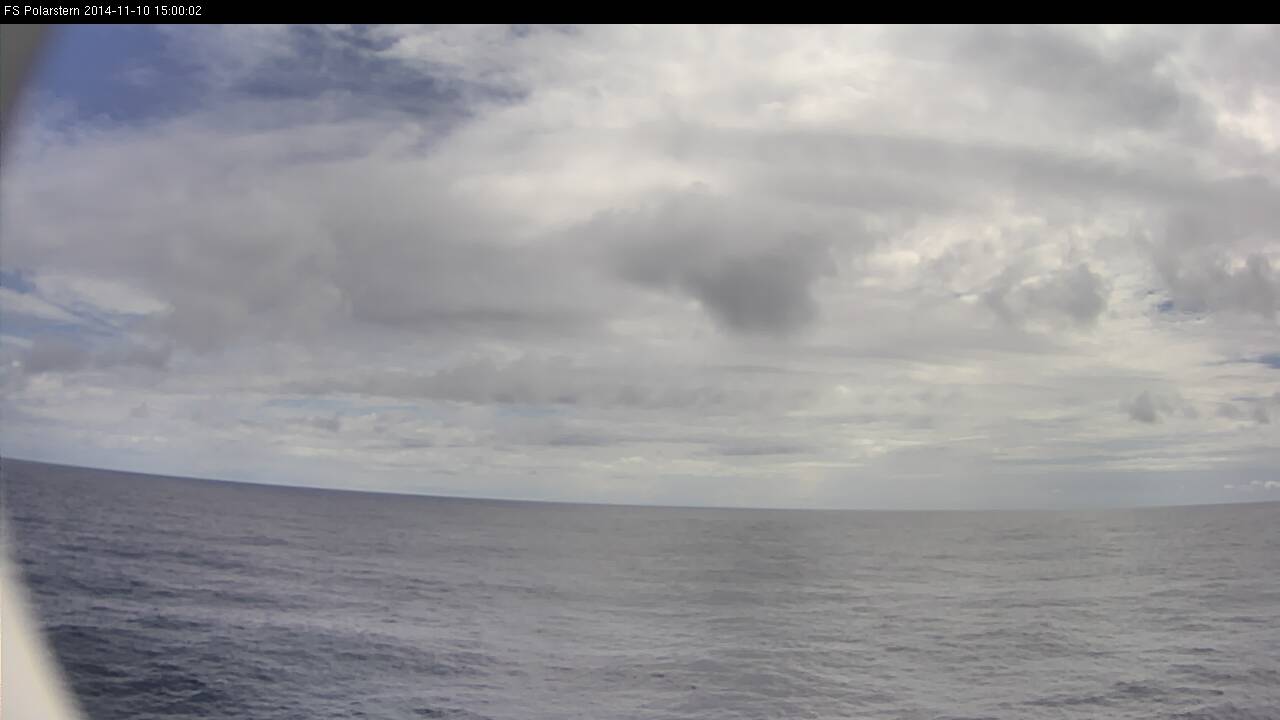
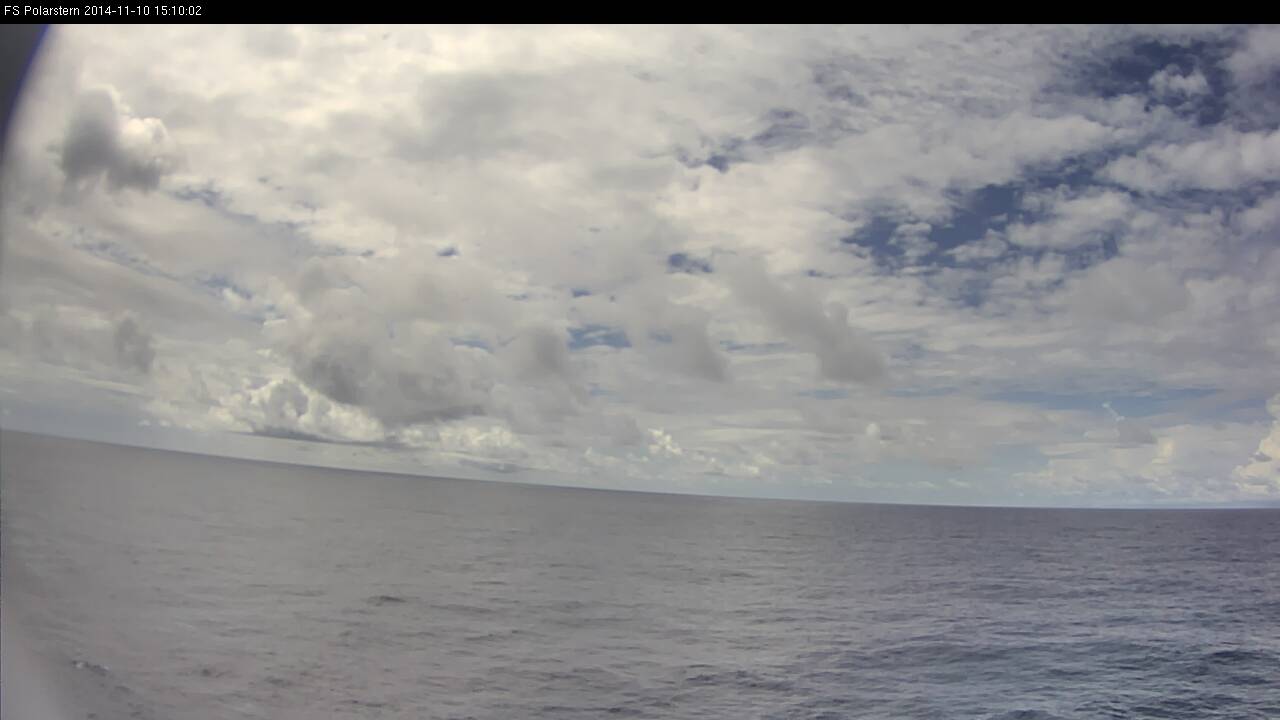
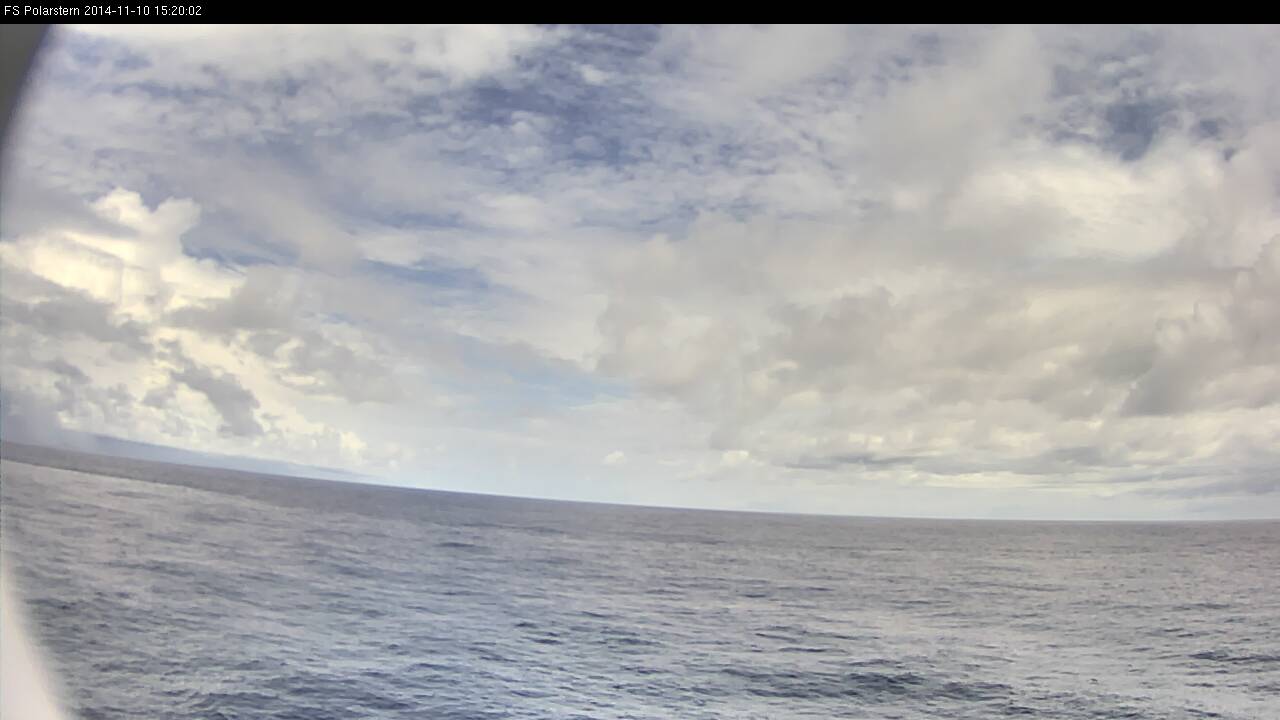
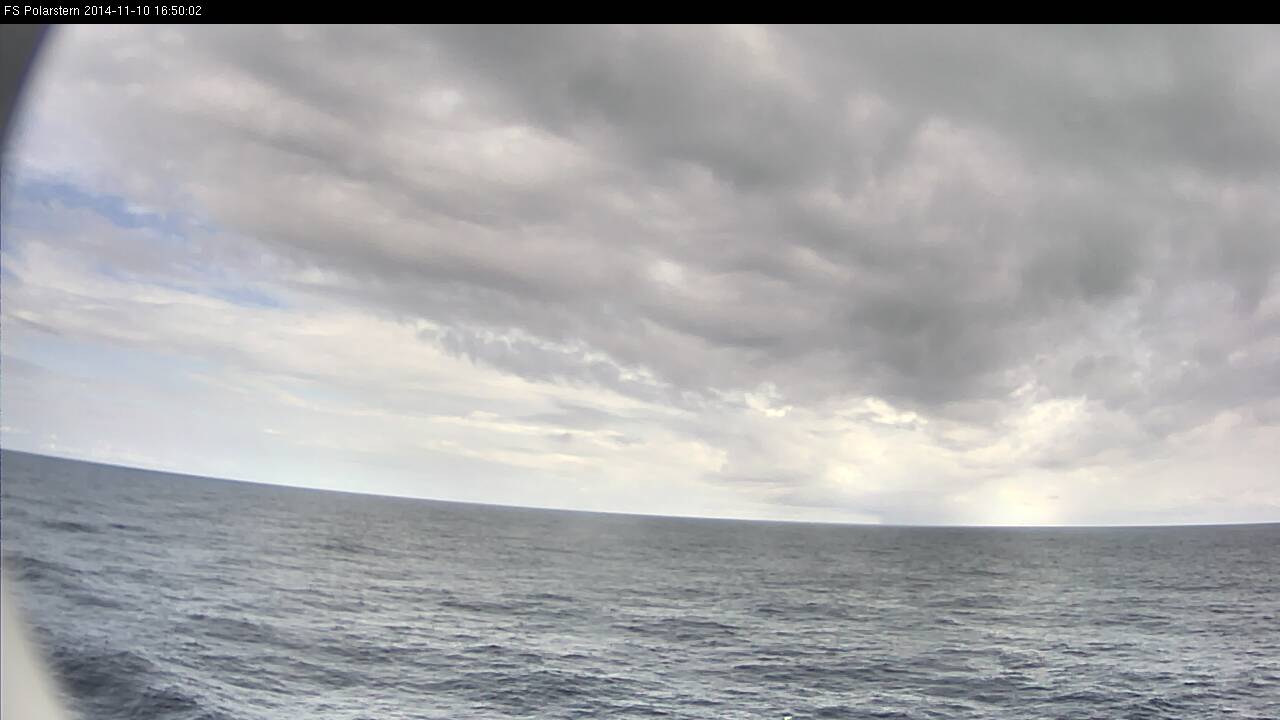
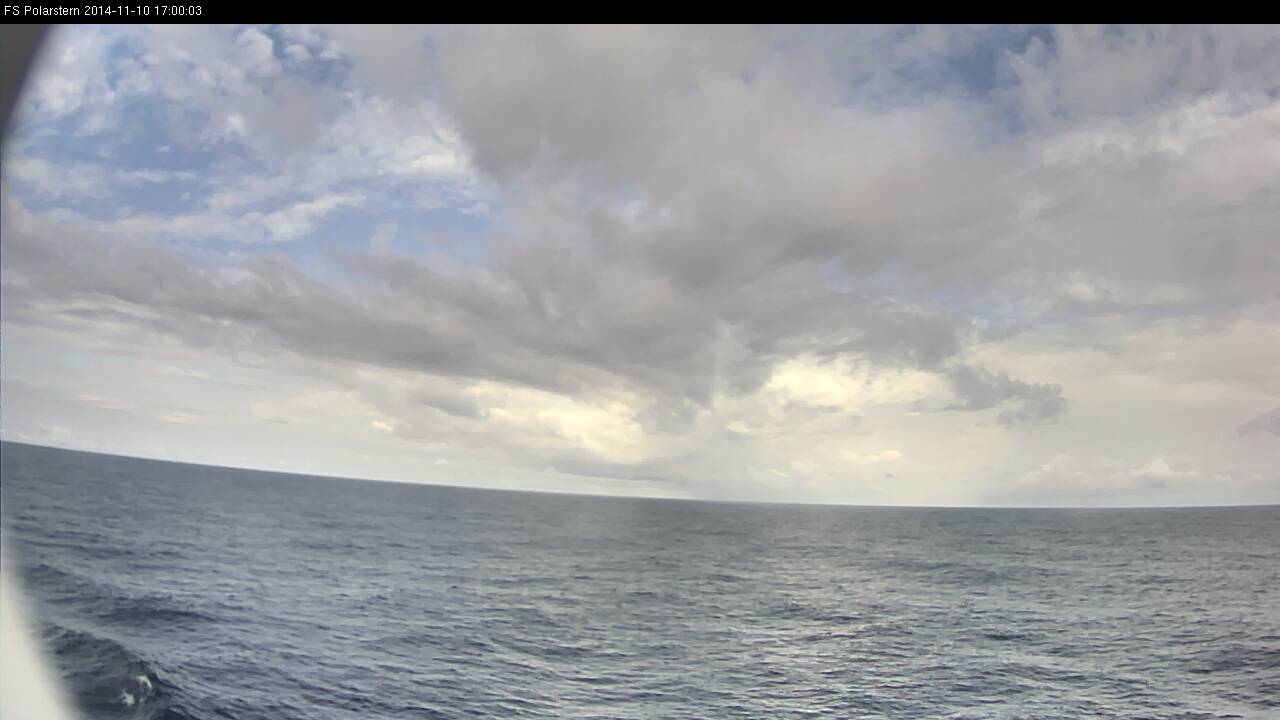
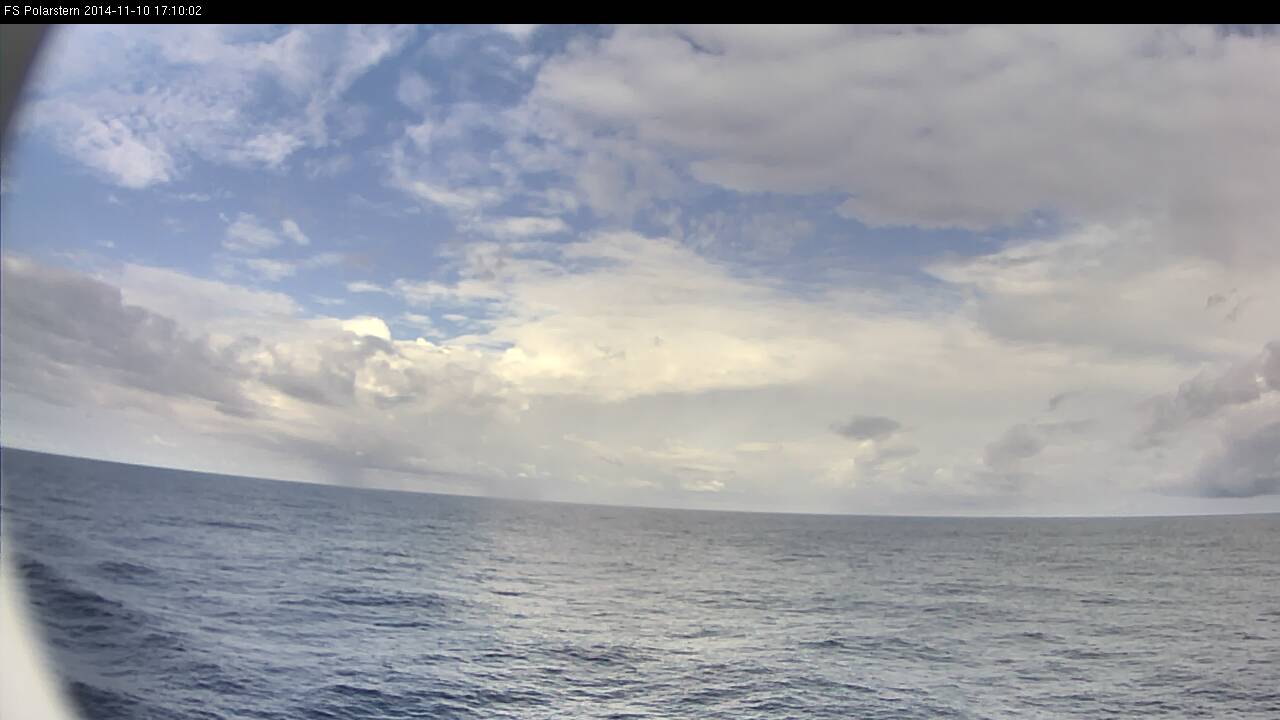
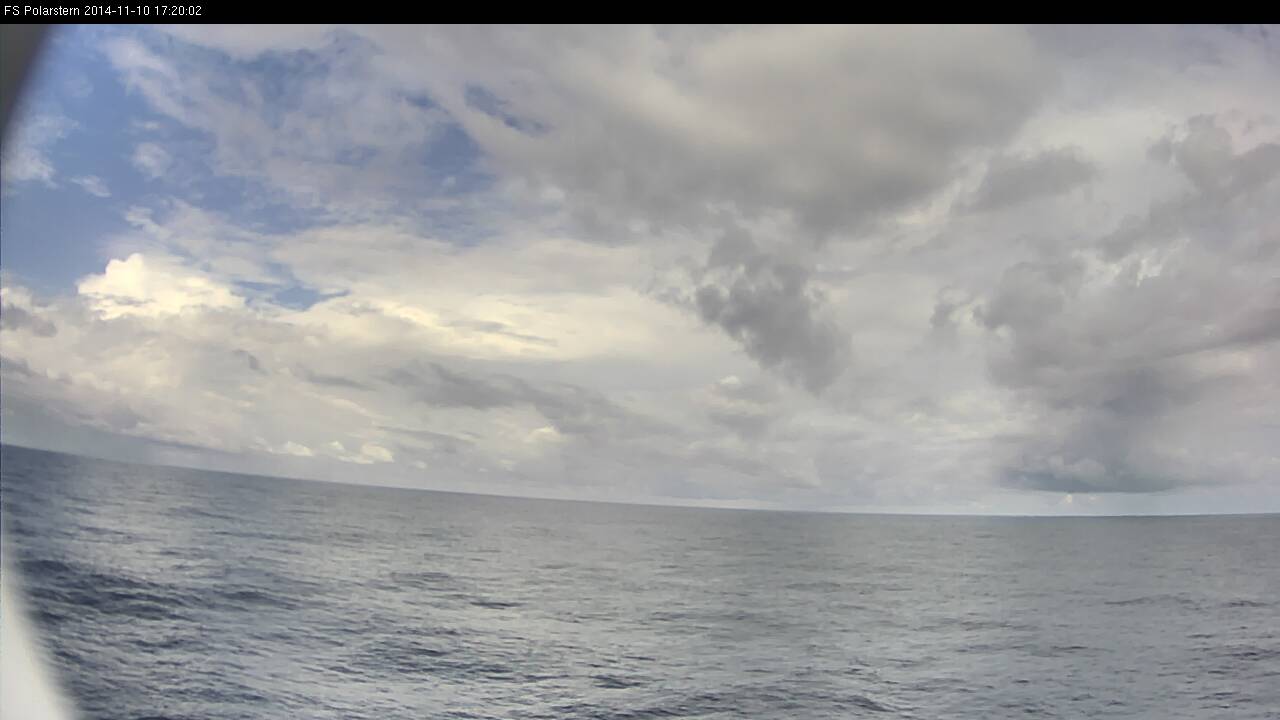
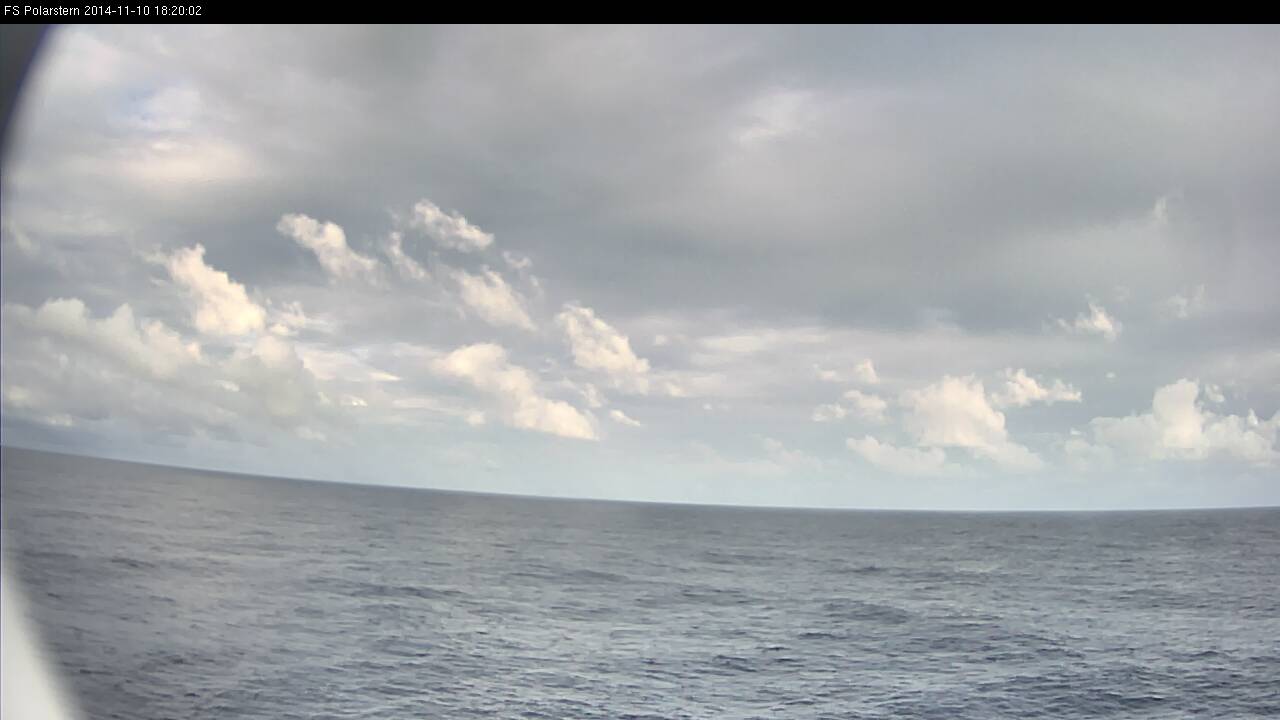
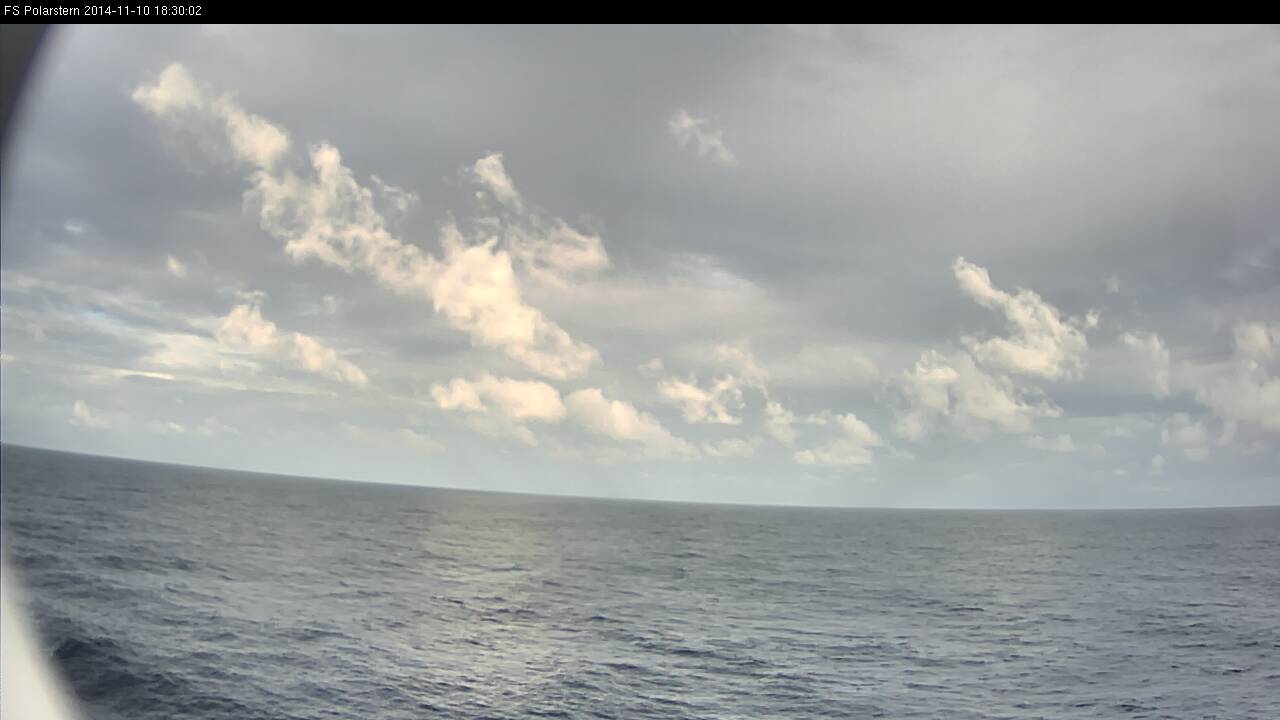
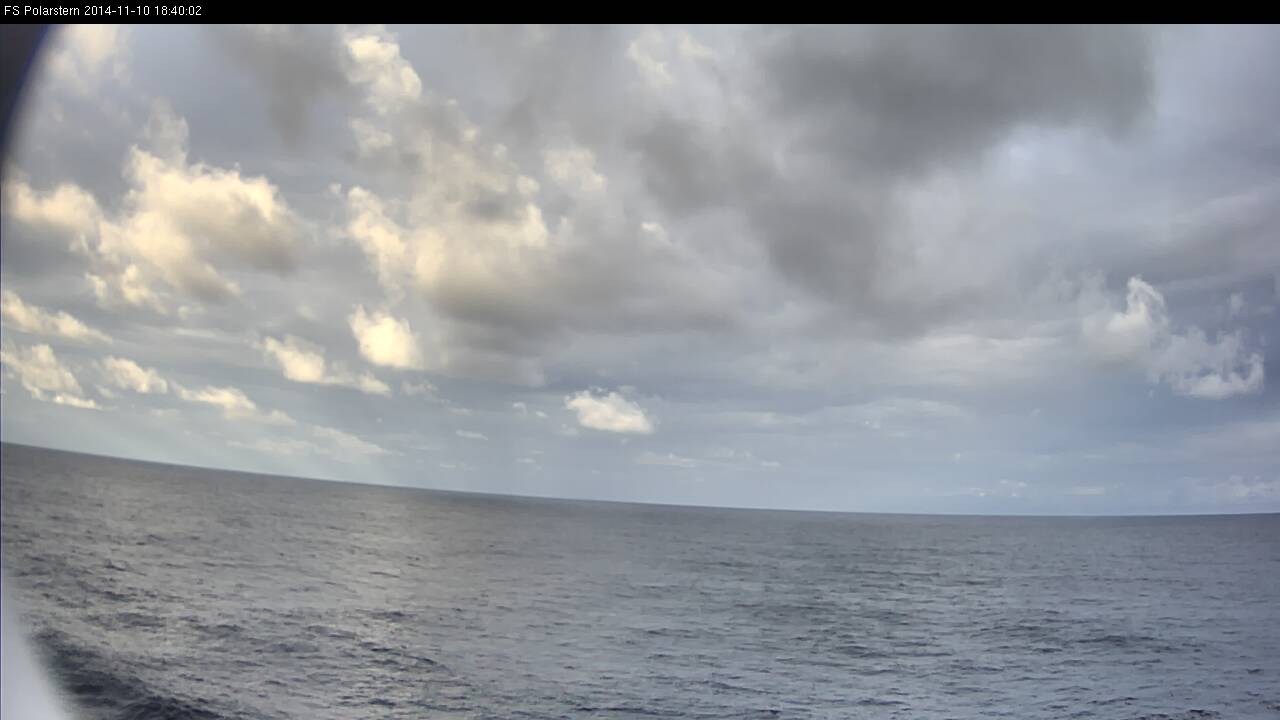
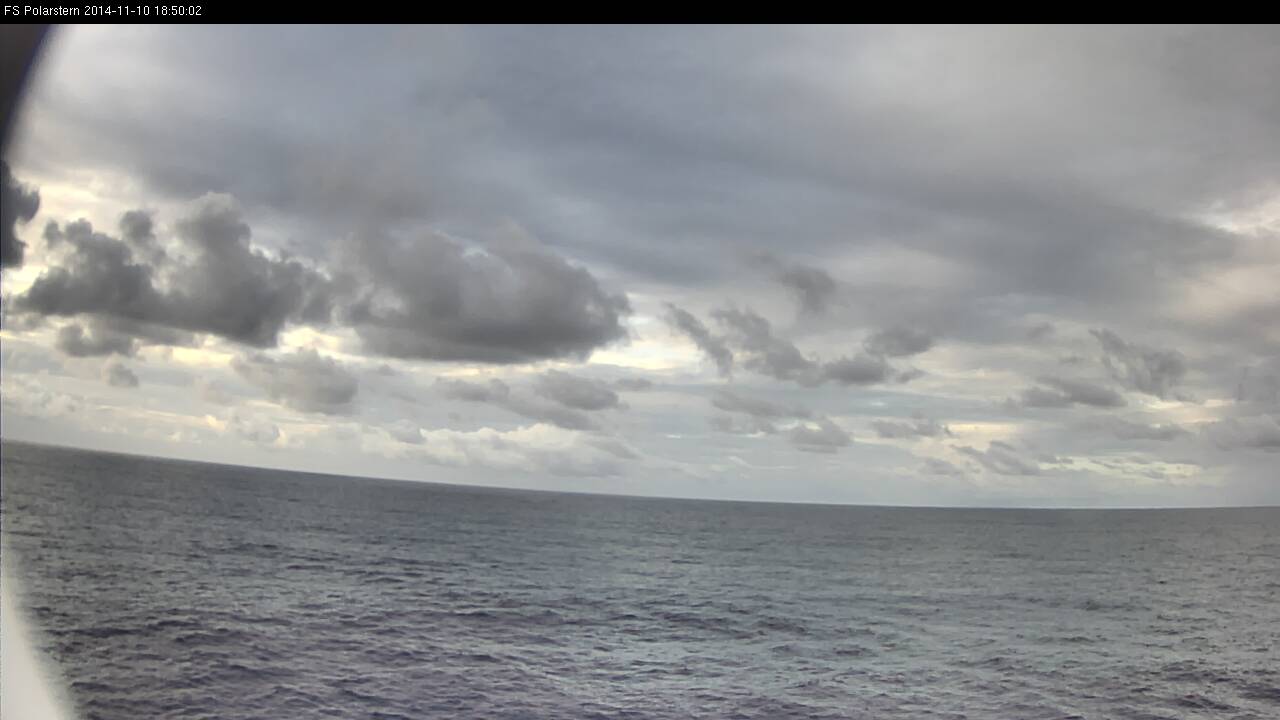
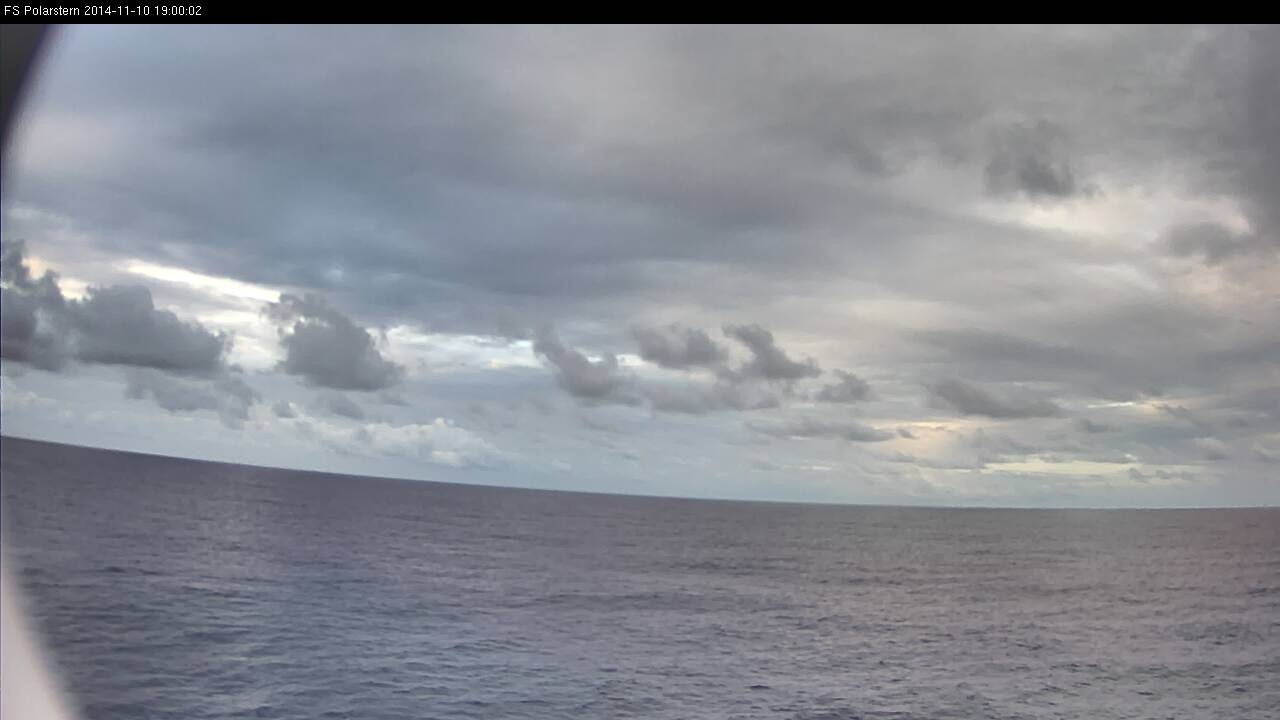
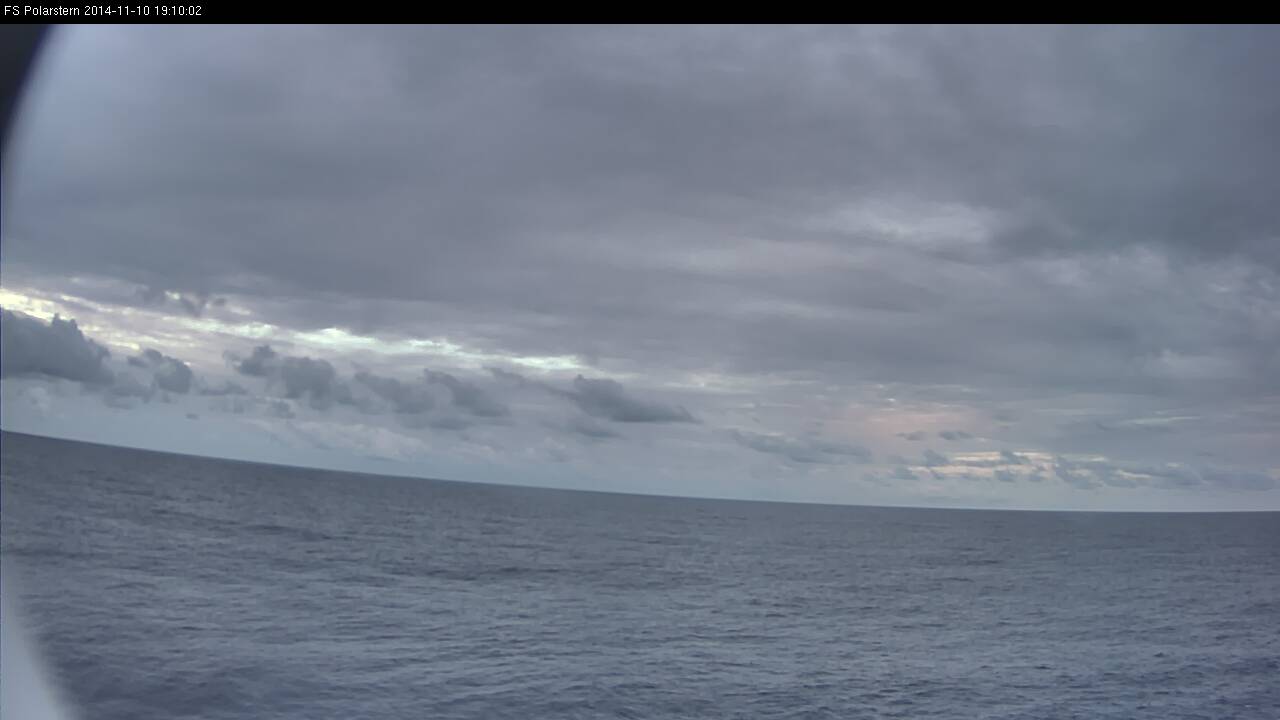
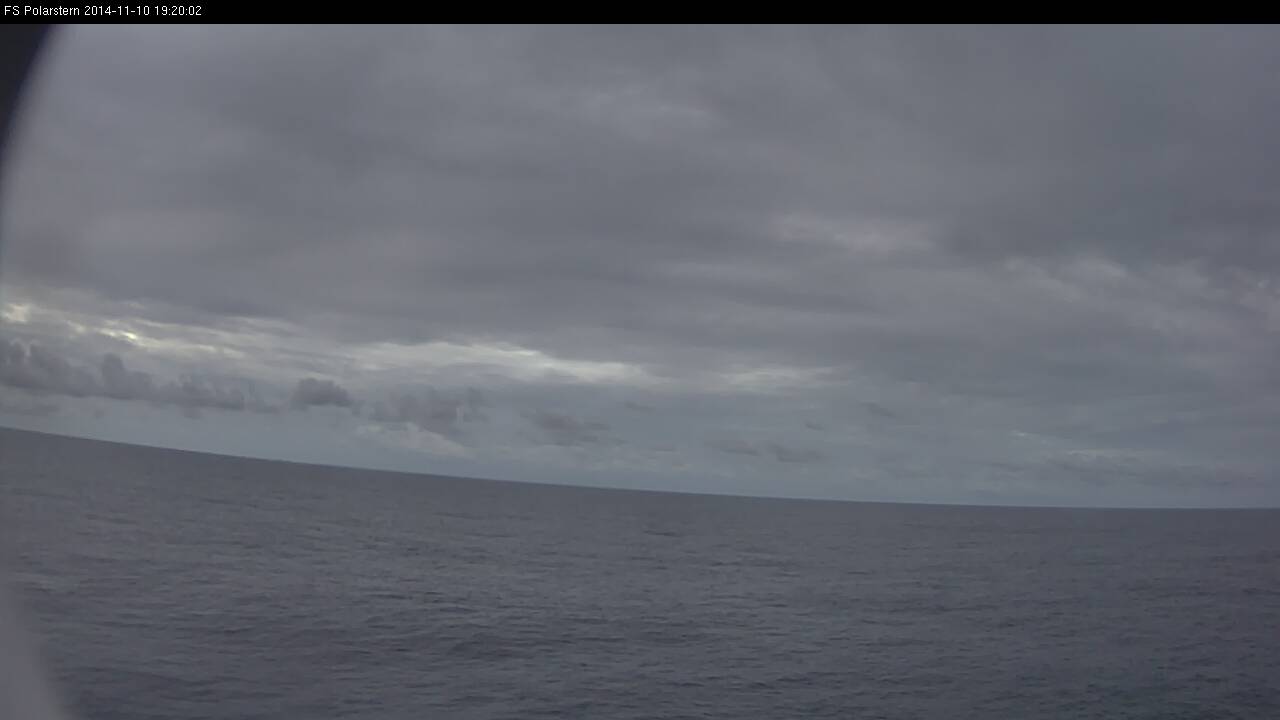
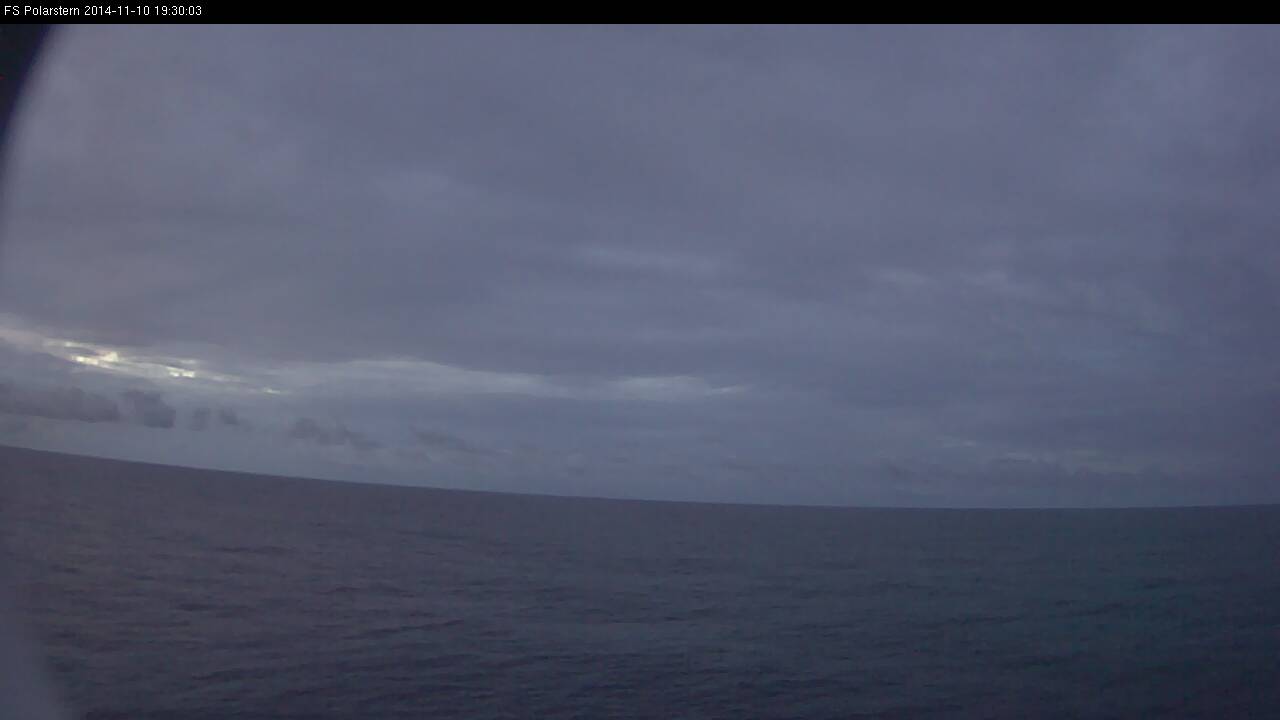
In this loop you will see all daytime webcam images taken every 10 minutes on 10 Nov 2014 between 07:00 UTC and 19:30 UTC.
Loop 5: Note - click on the loop to go through individual images
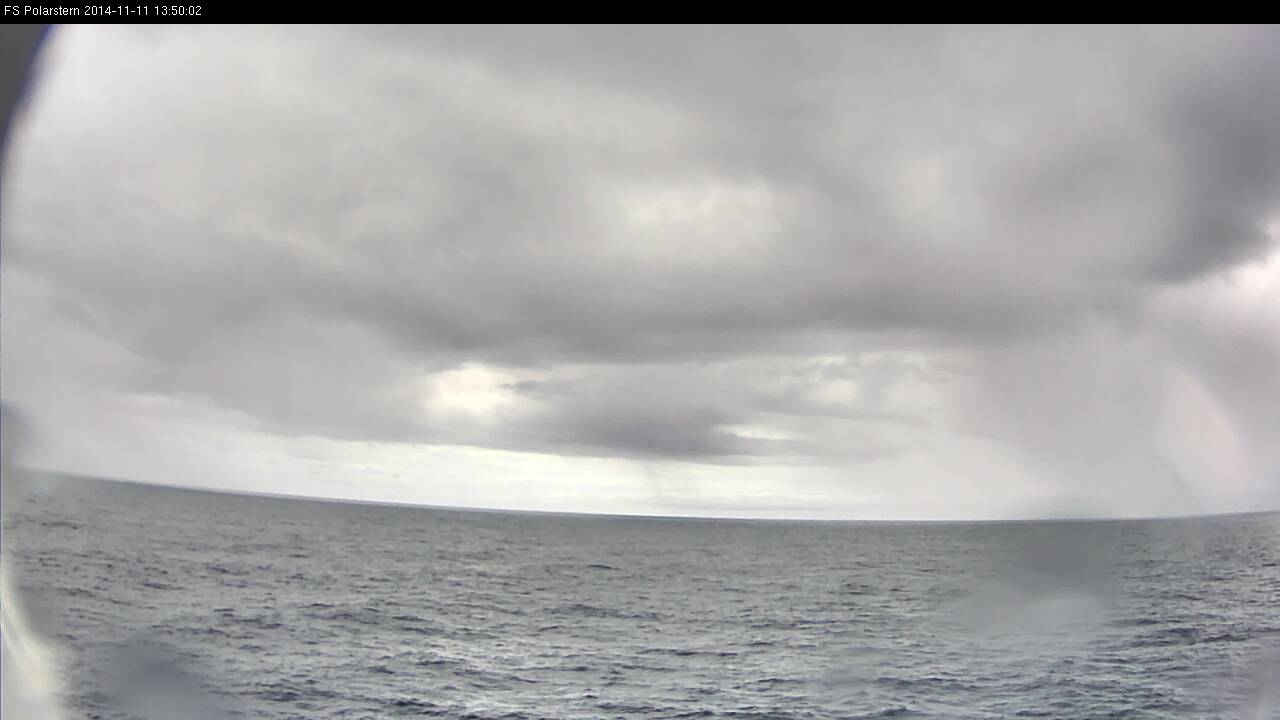
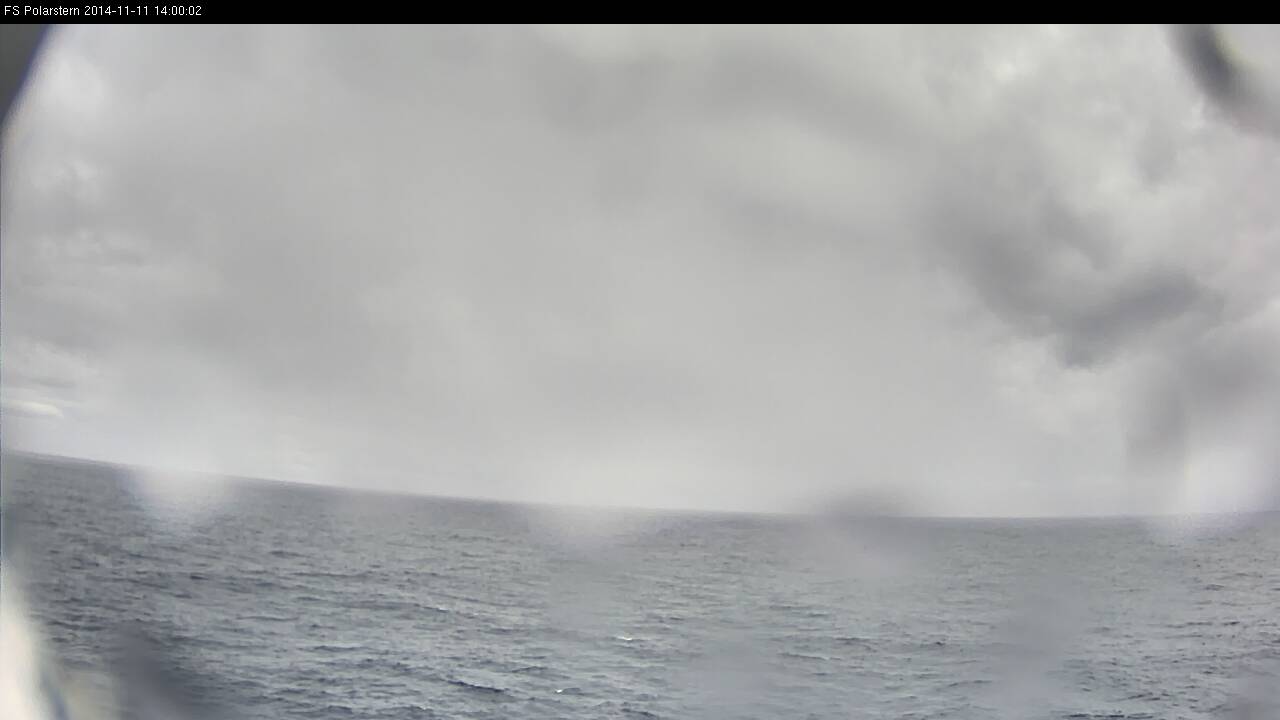
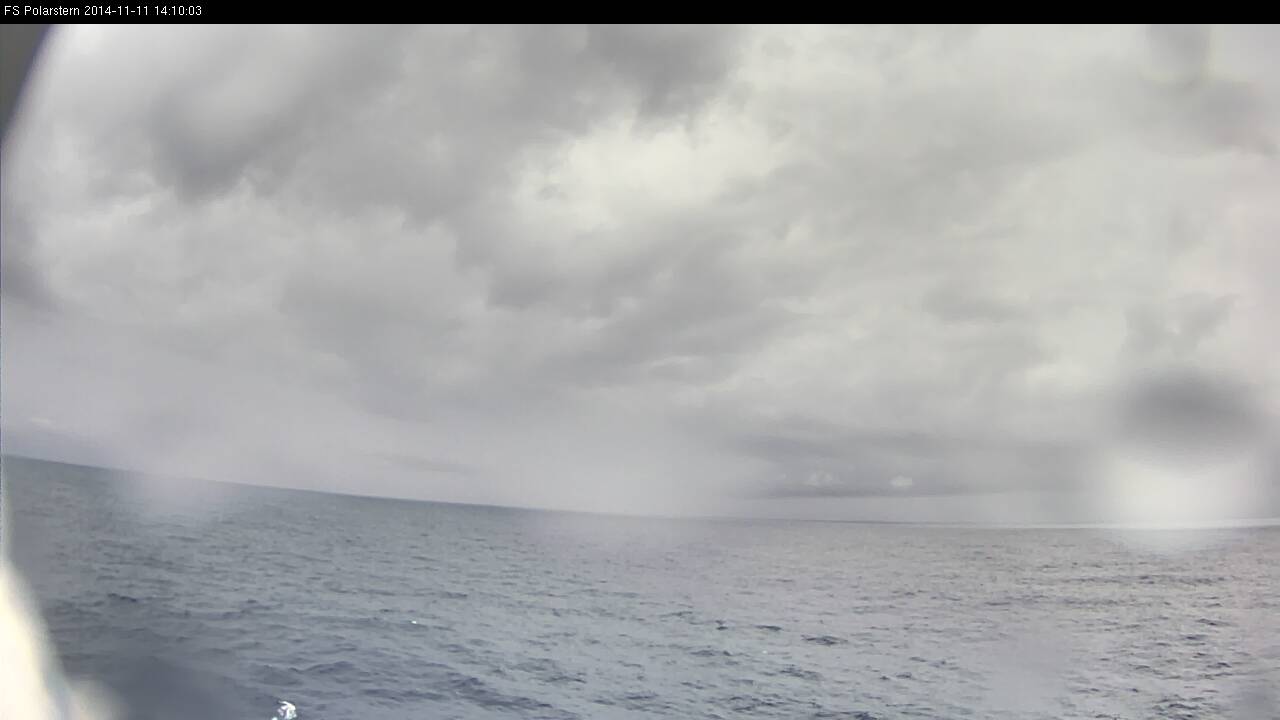
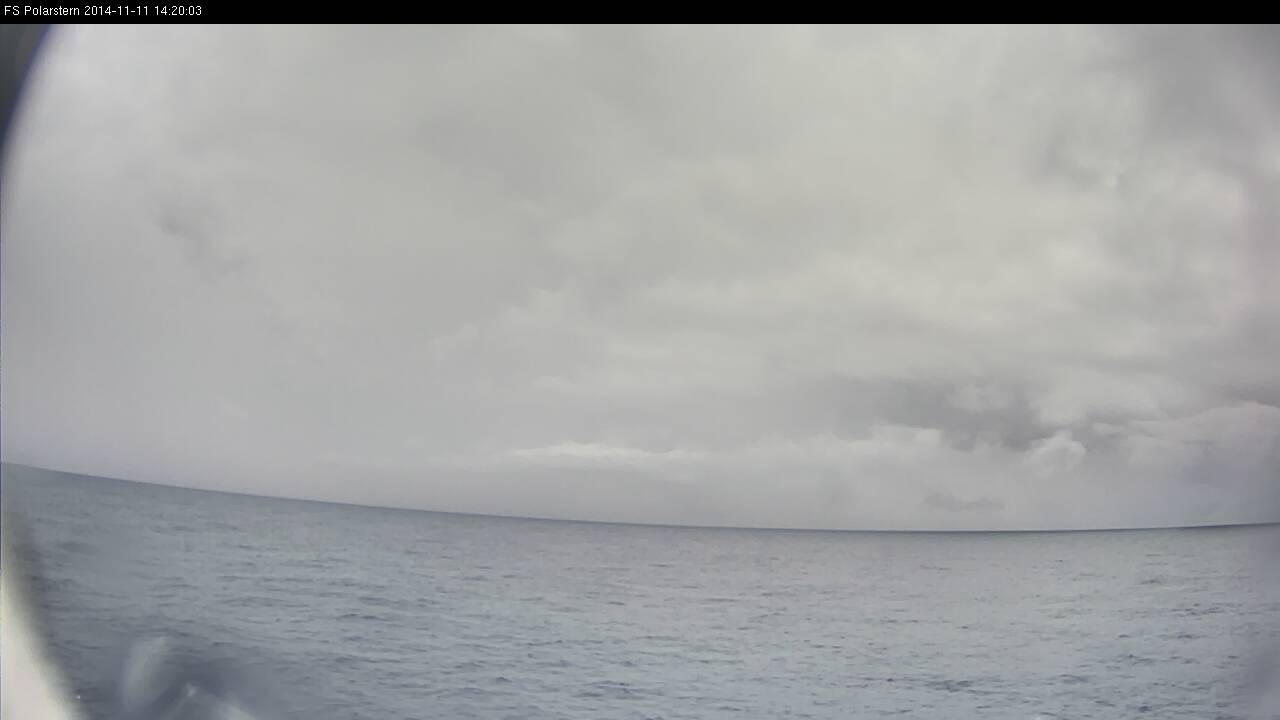
Weather situation on 11 Nov 2014
The Polarstern is sailing in the center of the ITCZ. In the Severe Storms RGB there are small cells with strong convection.
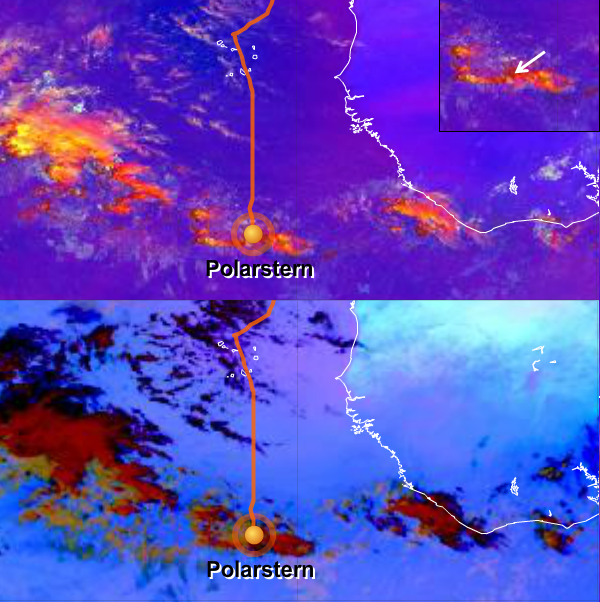
Figure L2-16: 11 Nov 2014, 12:00 UTC. Above: Severe Storms RGB.
Below: Dust RGB. Source: EUMeTrain.
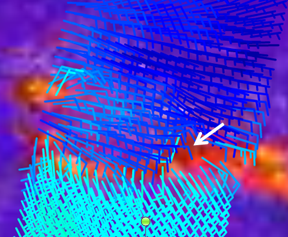
Figure L2-17: 11 Nov 2014, 12:00 UTC. Severe Storms RGB, ASCAT wind vector from Metop. Source: EUMeTrain.
The ASCAT image (Fig. L2-17) helps to define this zone as the center of the ITCZ. The convergence of easterly winds north of the ITCZ and southeasterly winds to the south of it is clearly visible.
Fig. L2-18 shows two important ingredients of strong thunderstorms: total precipitable water (TPW) from the ECMWF model with a maximum around the ITCZ, and the aforementioned wind convergence. The TPW is the depth of water in a column of the atmosphere, from the surface to the top of the atmosphere, if all the water in that column were precipitated as rain.
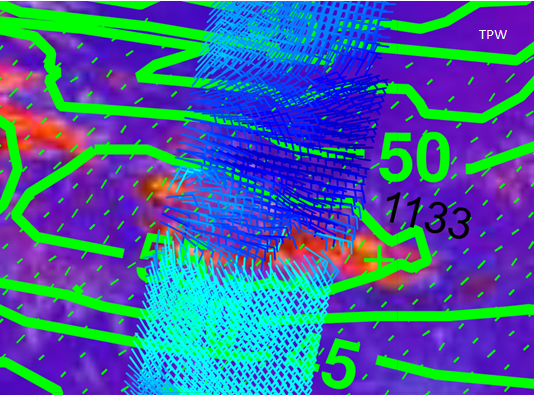
Figure L2-18: 11 Nov 2014, 12:00 UTC. Severe Storms RGB and TPW from ASCAT. Source: EUMeTrain.
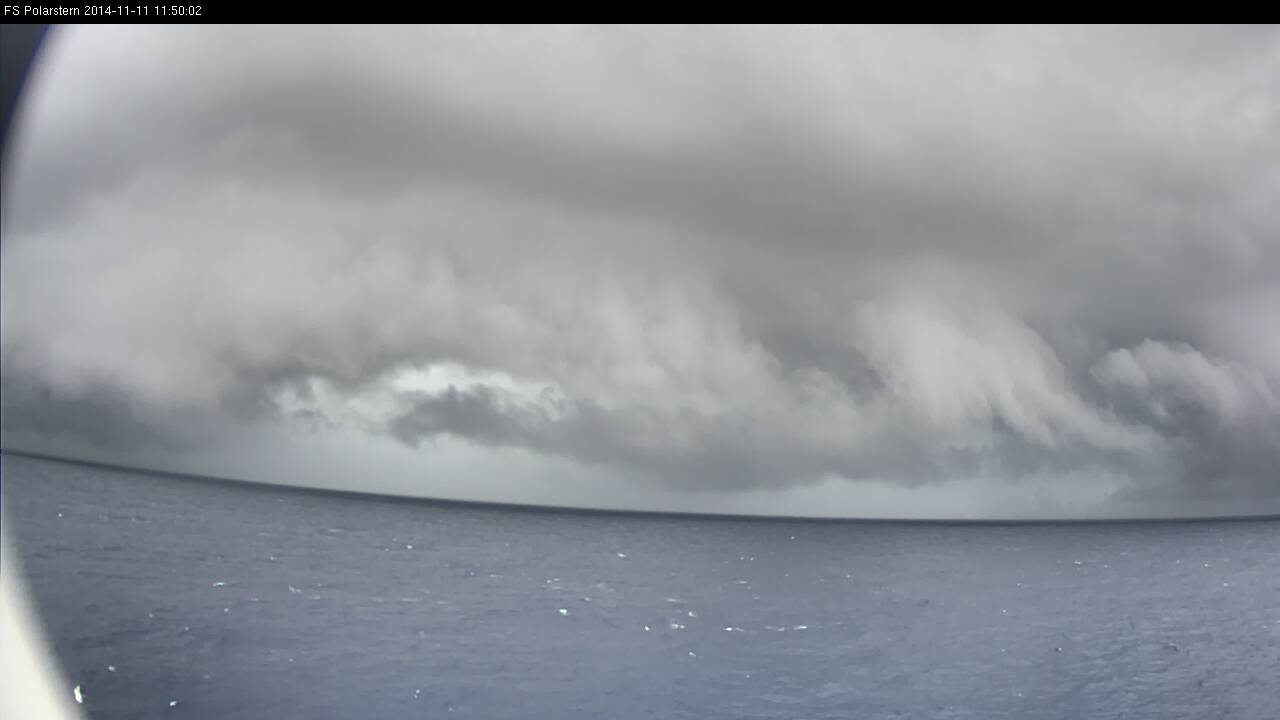
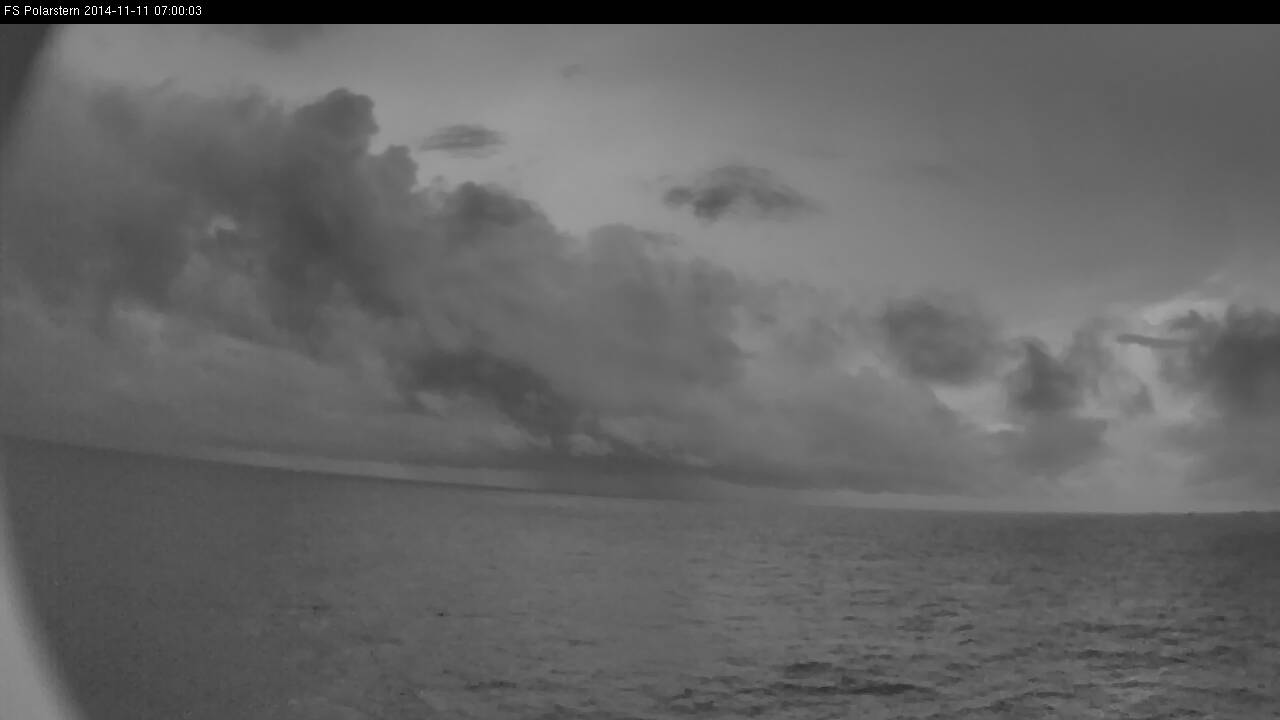
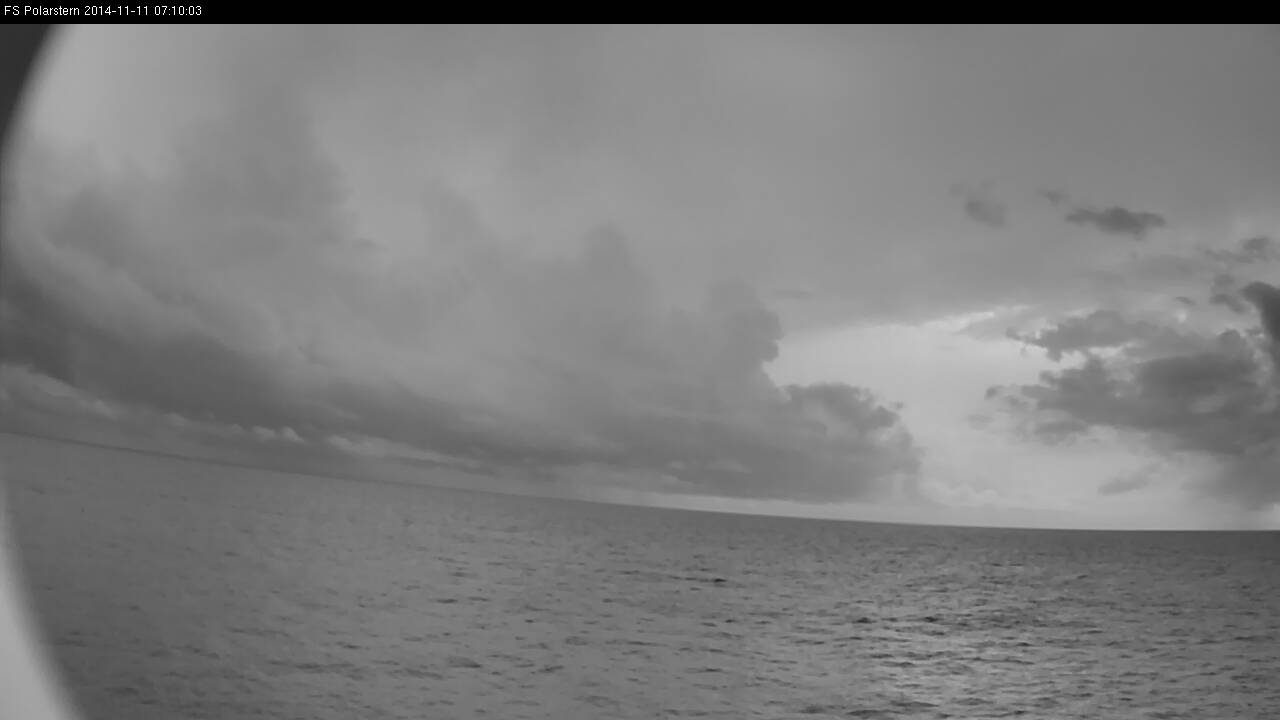
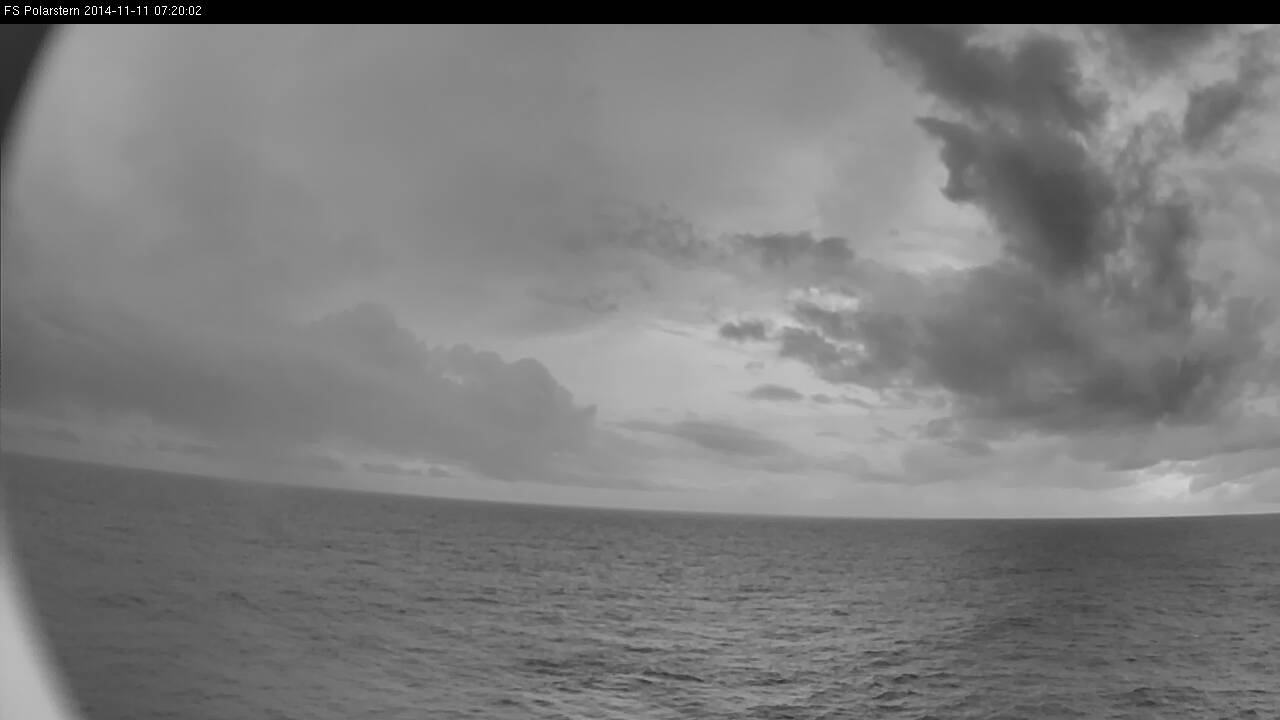
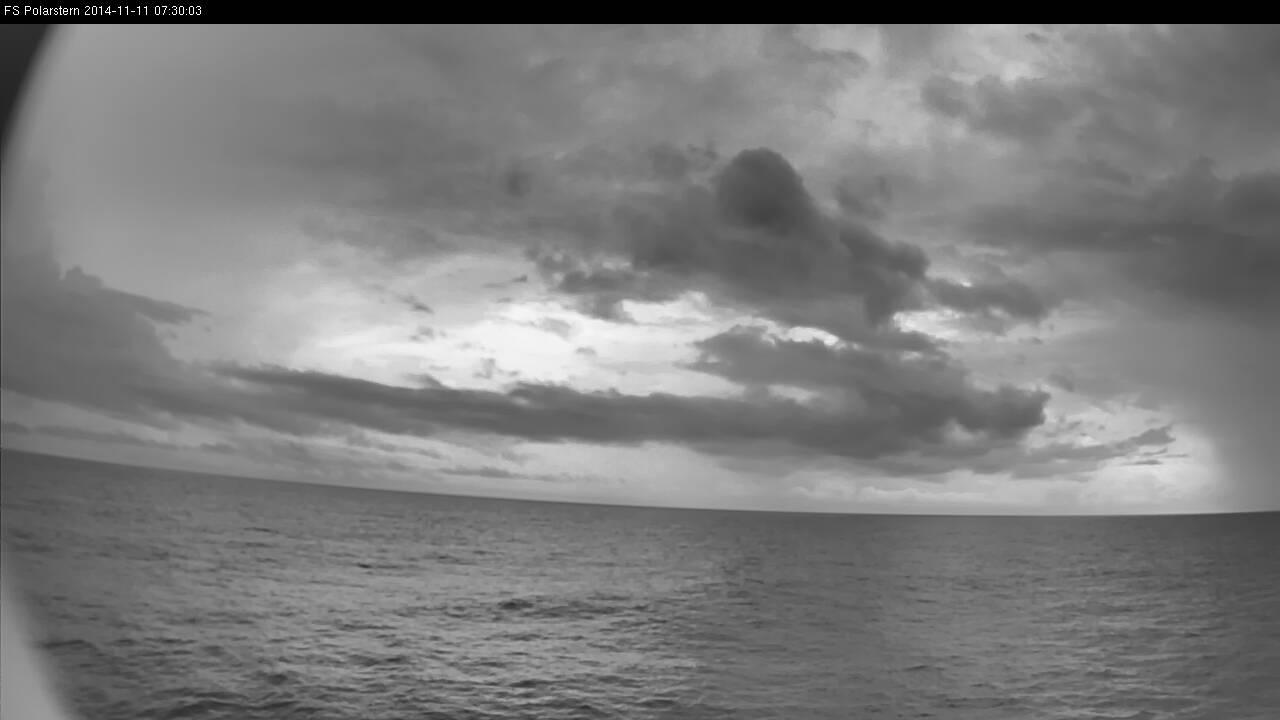
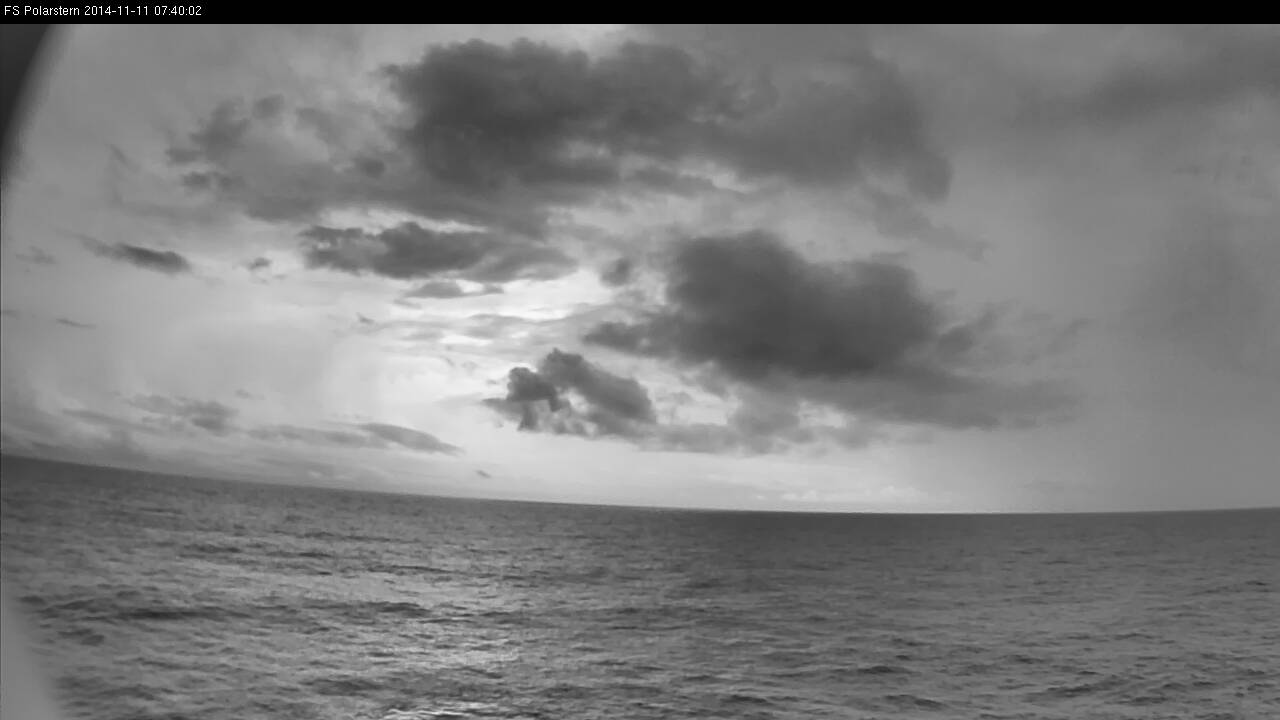
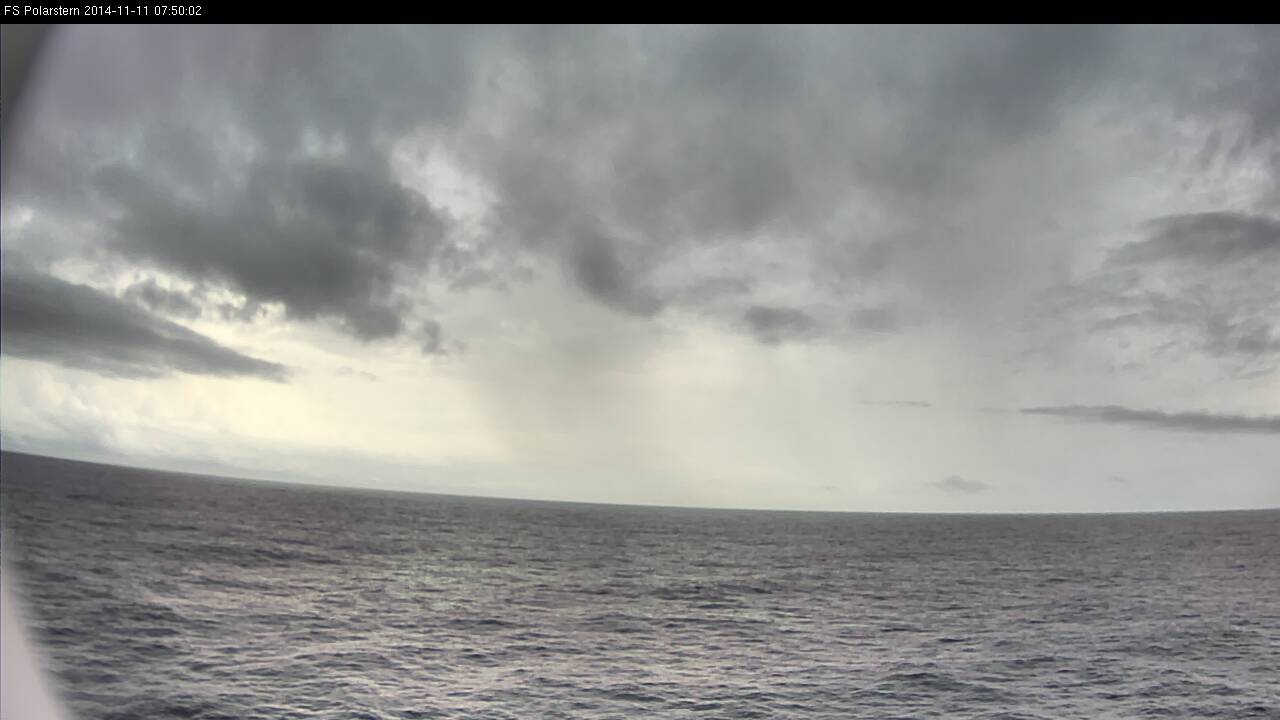
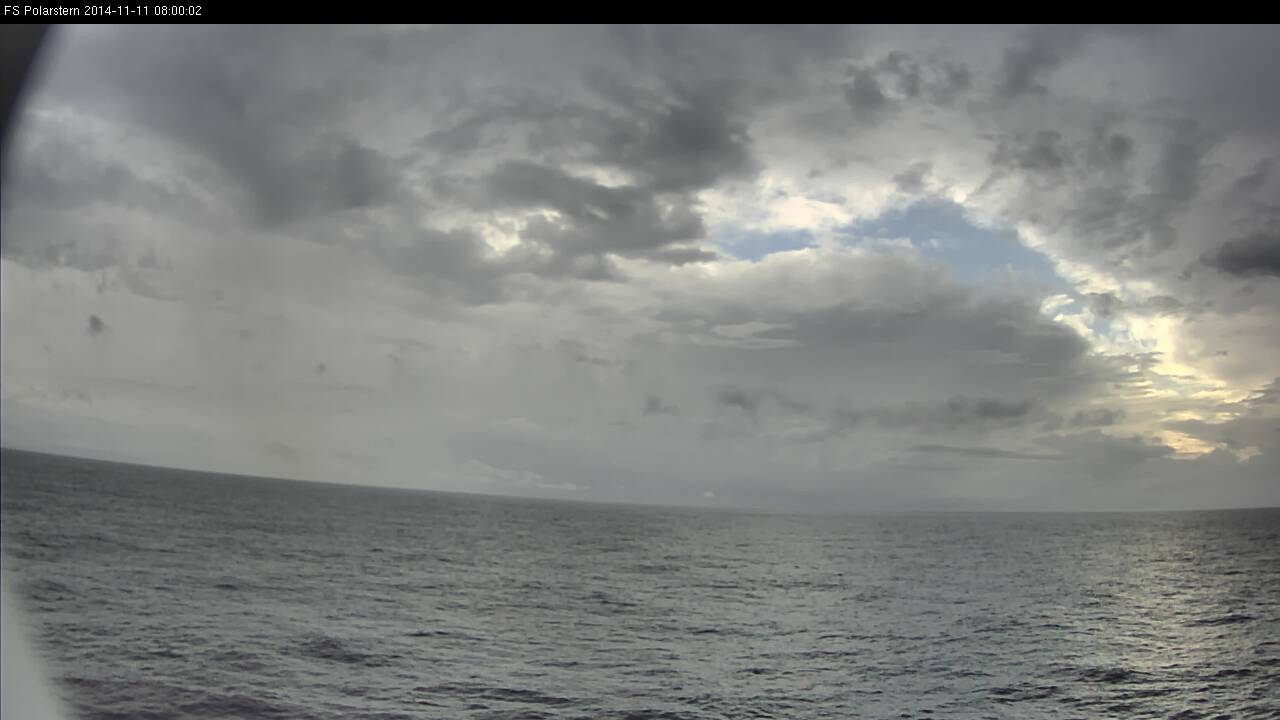
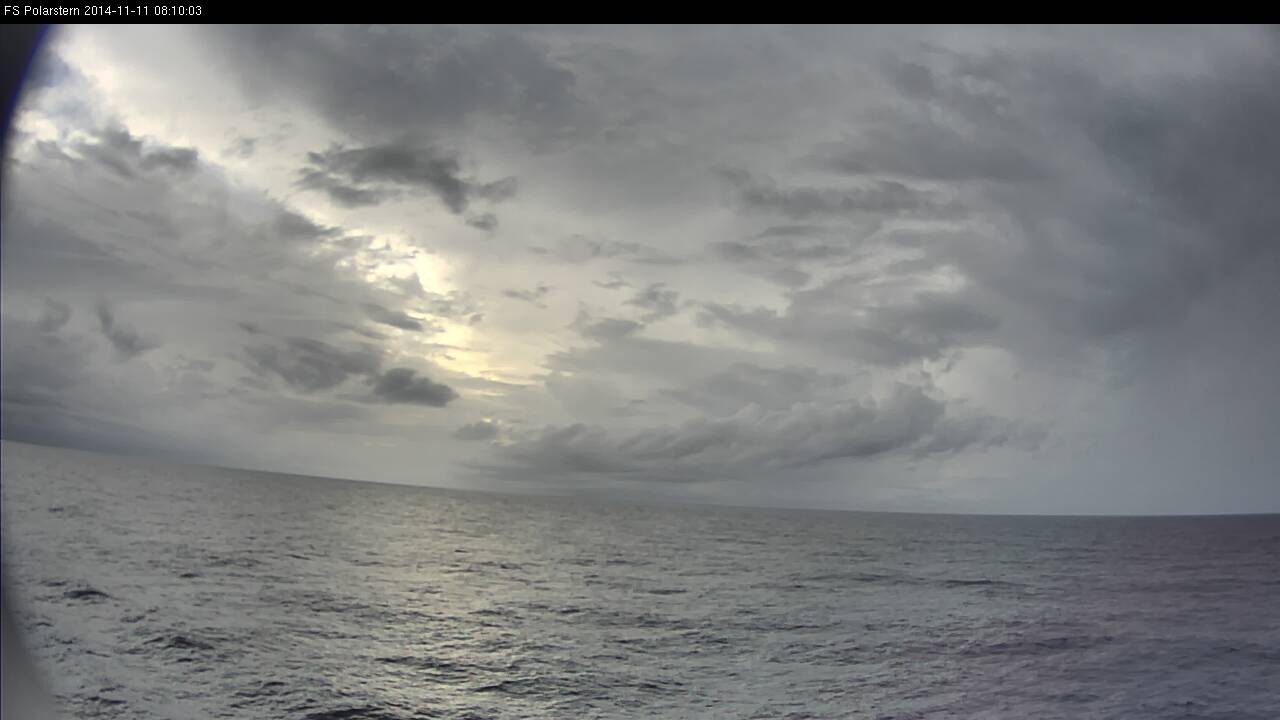
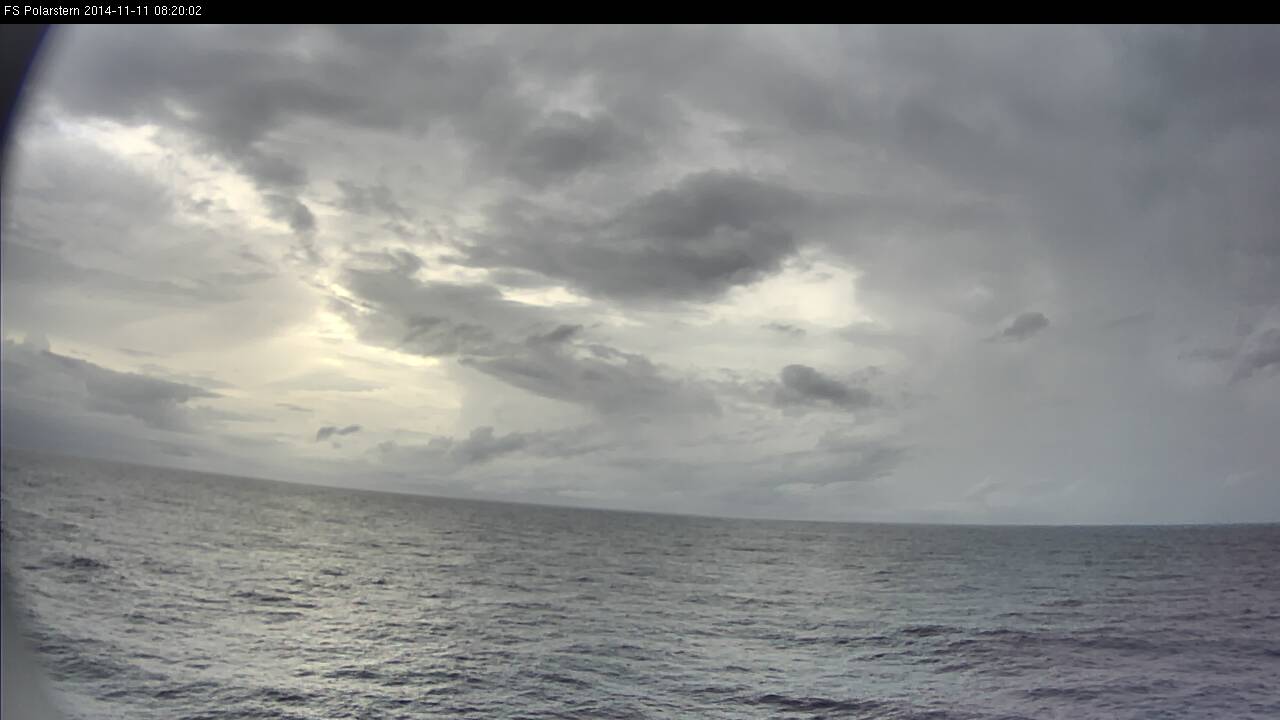
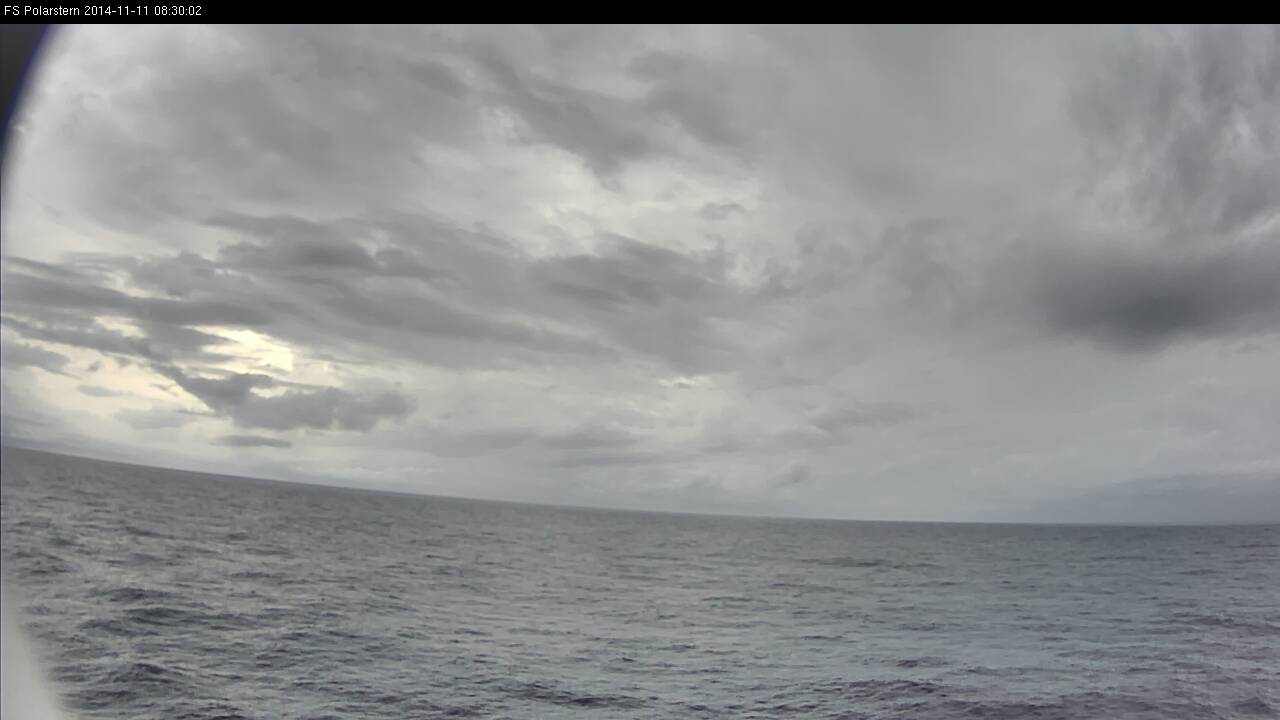
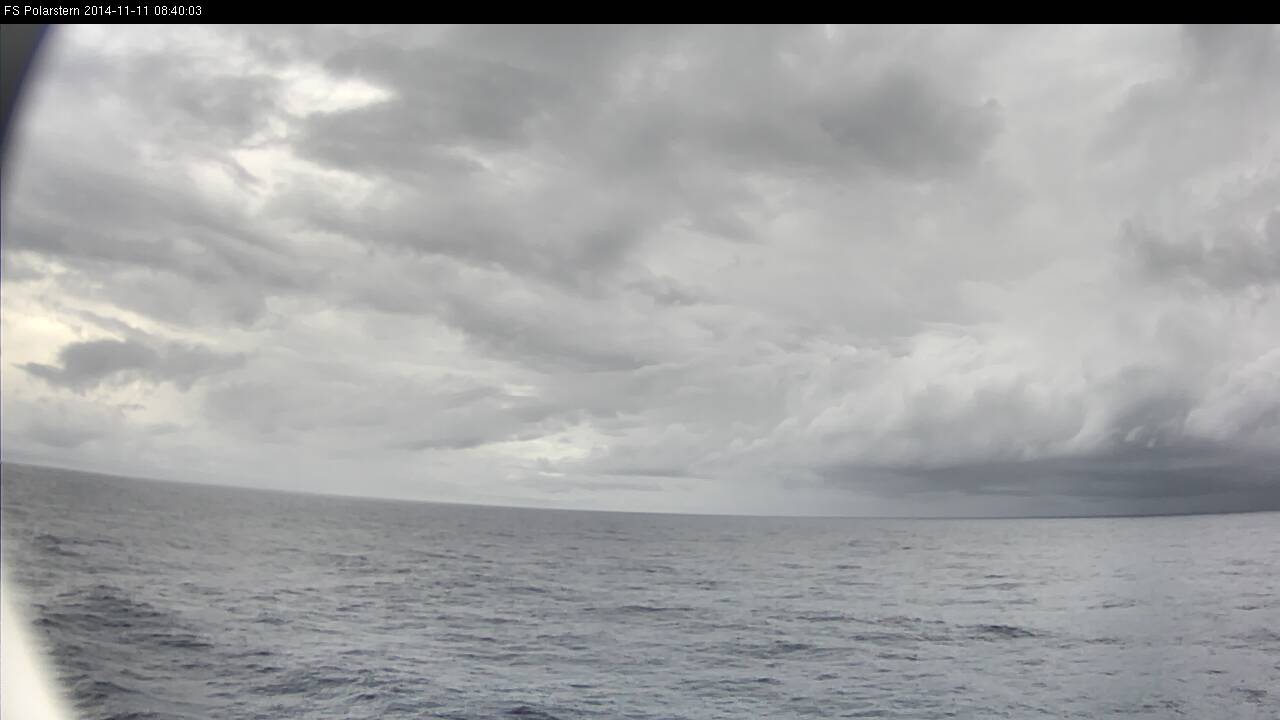
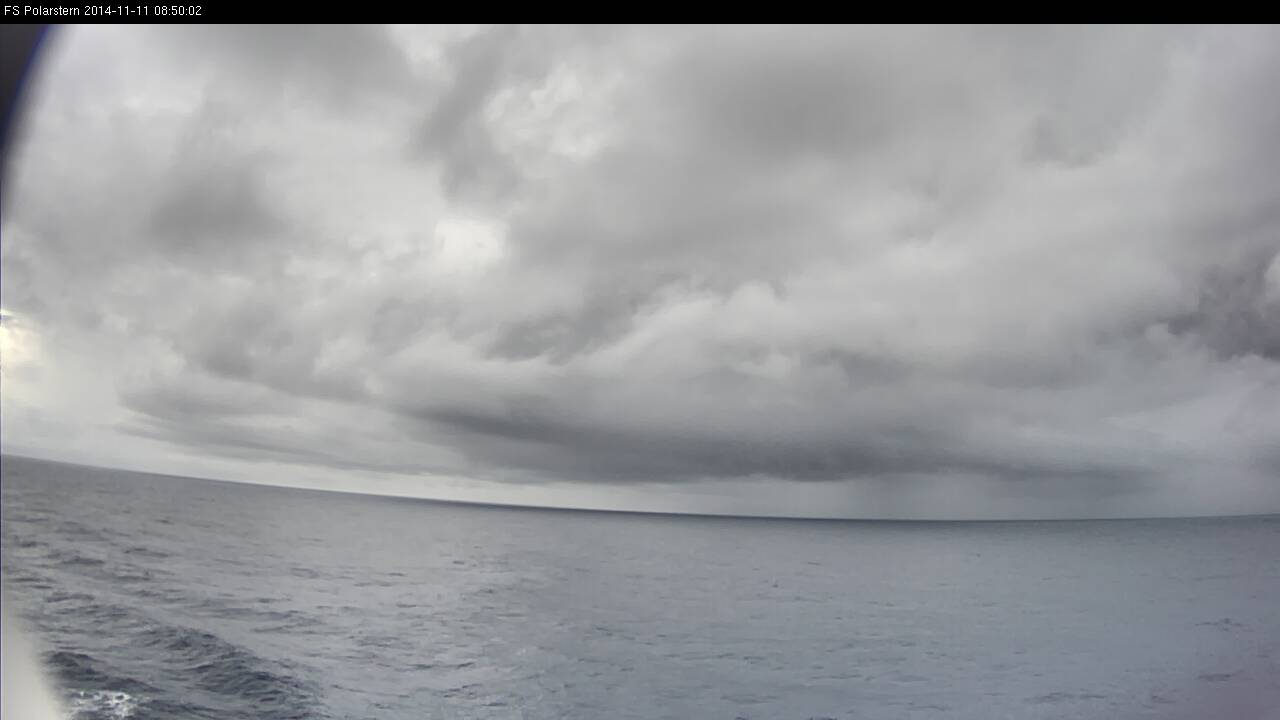
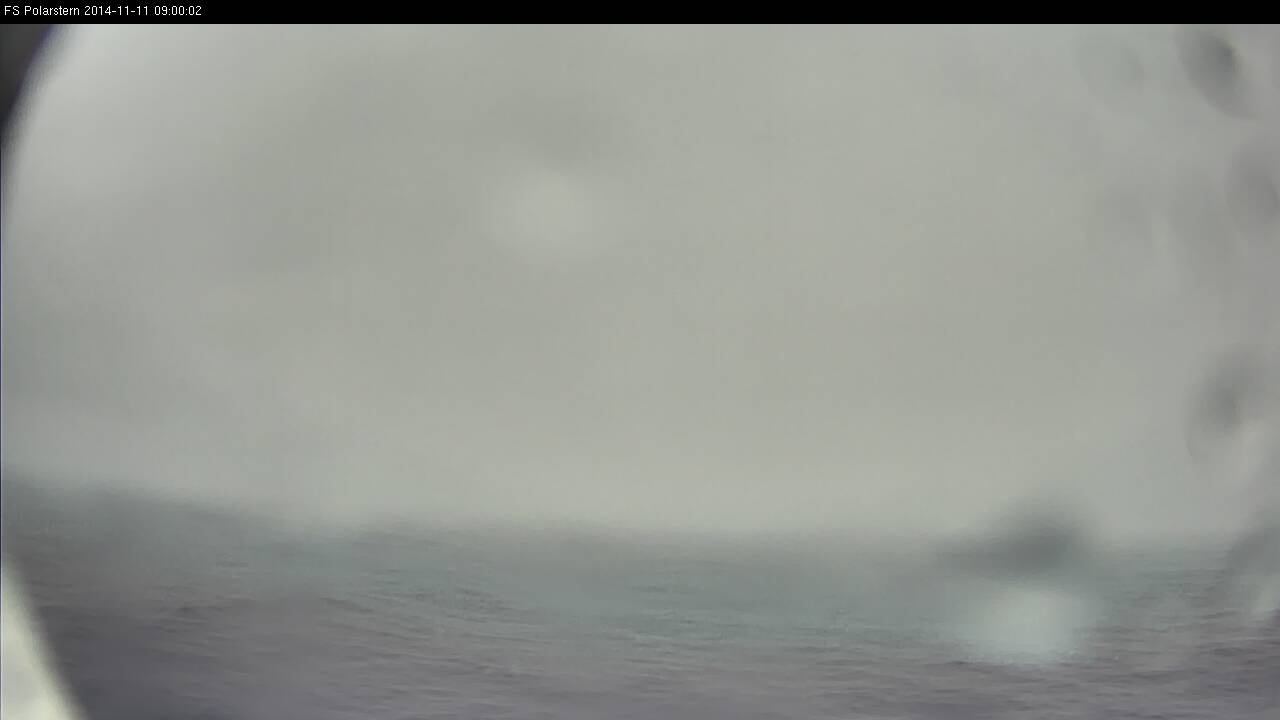
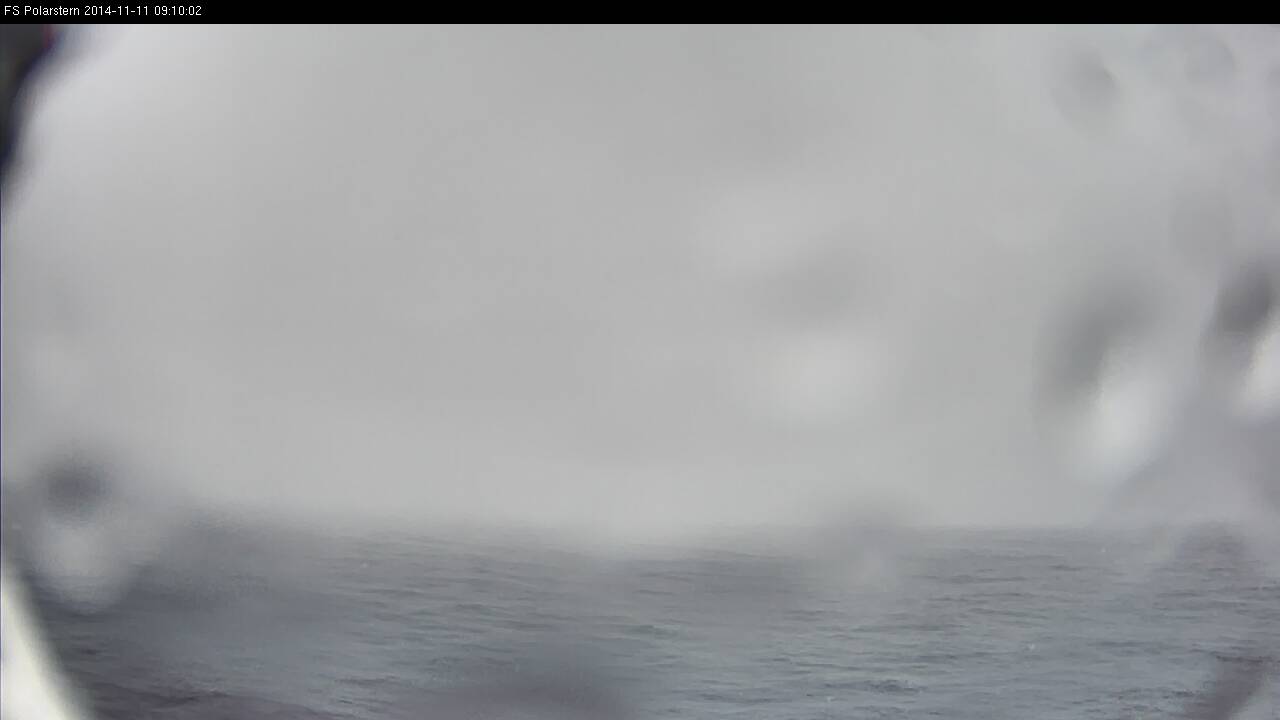
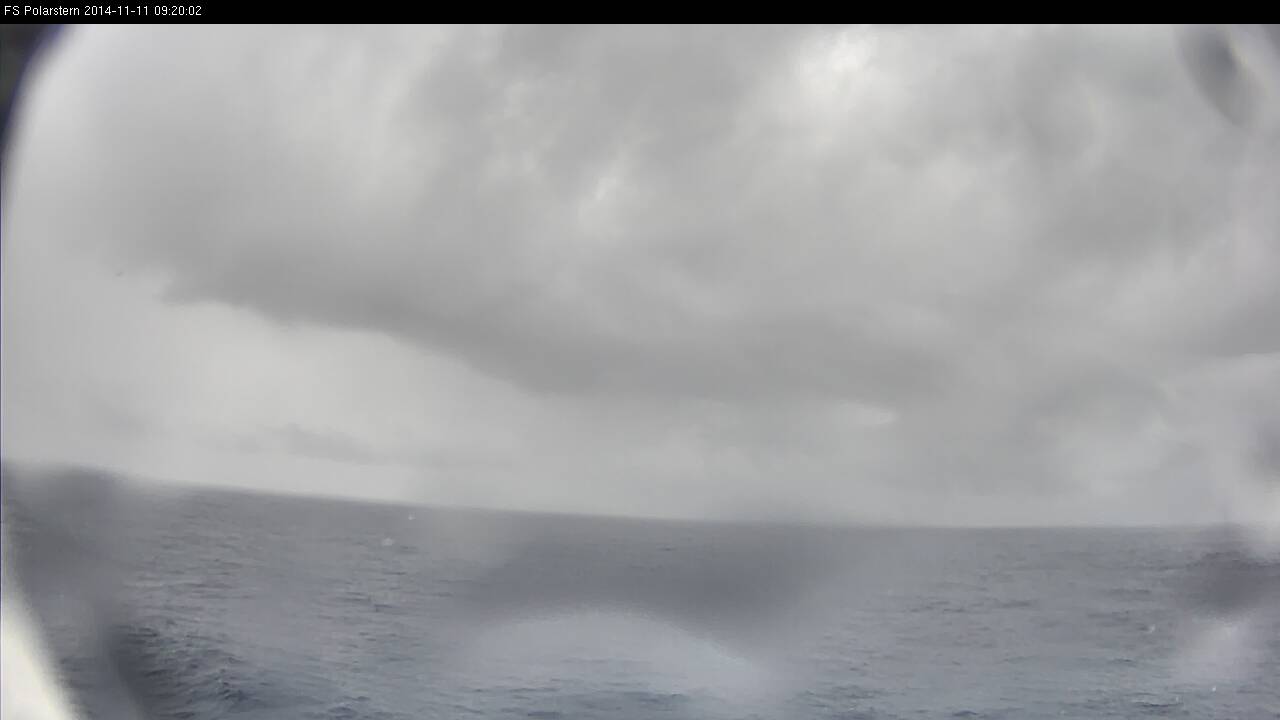
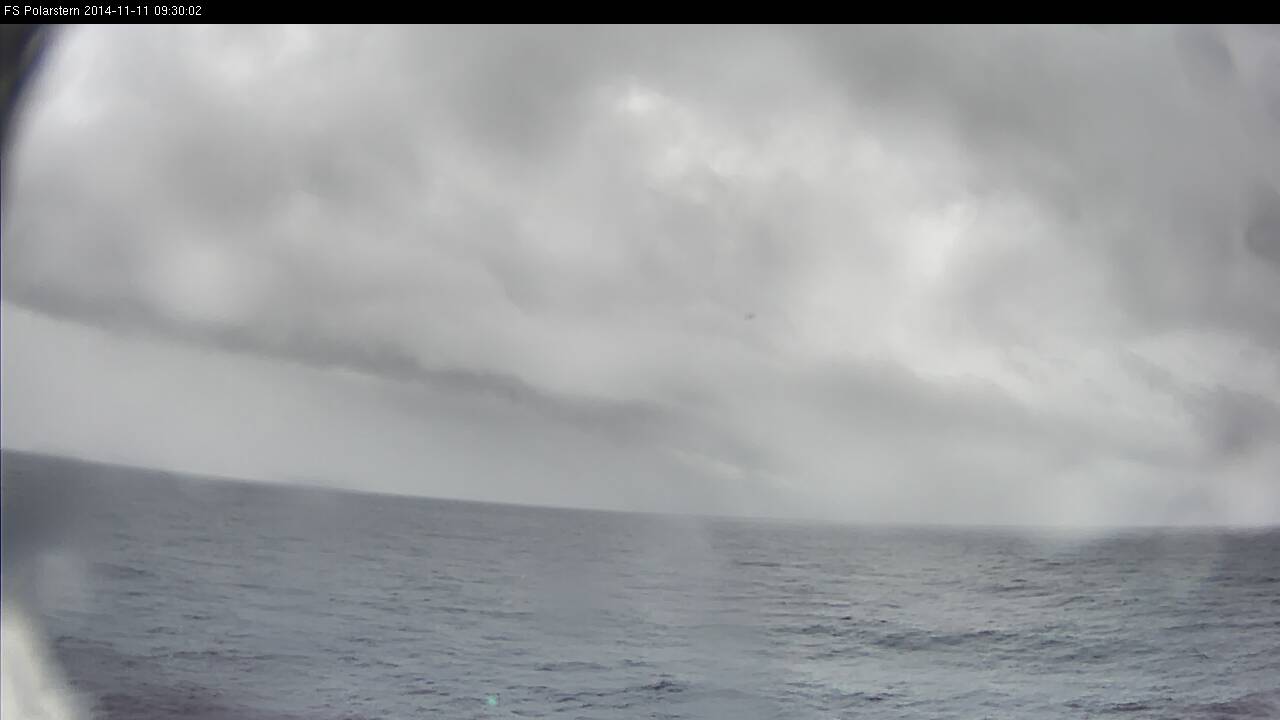
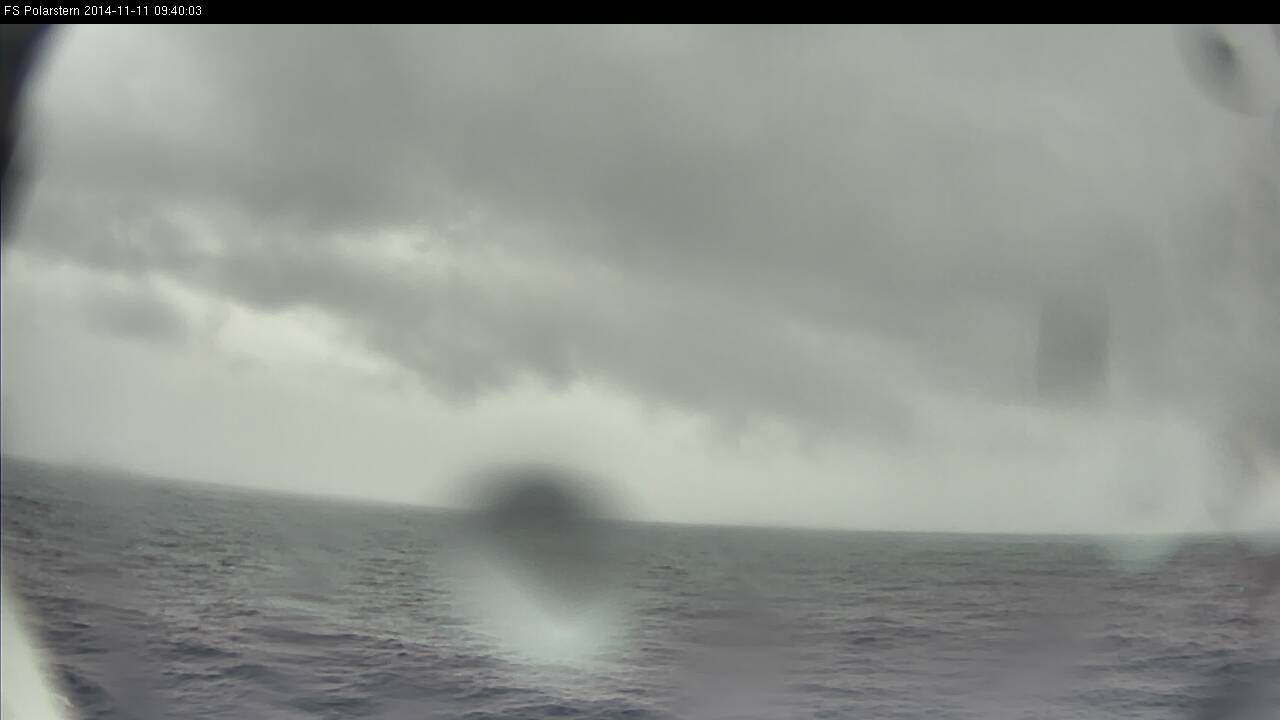
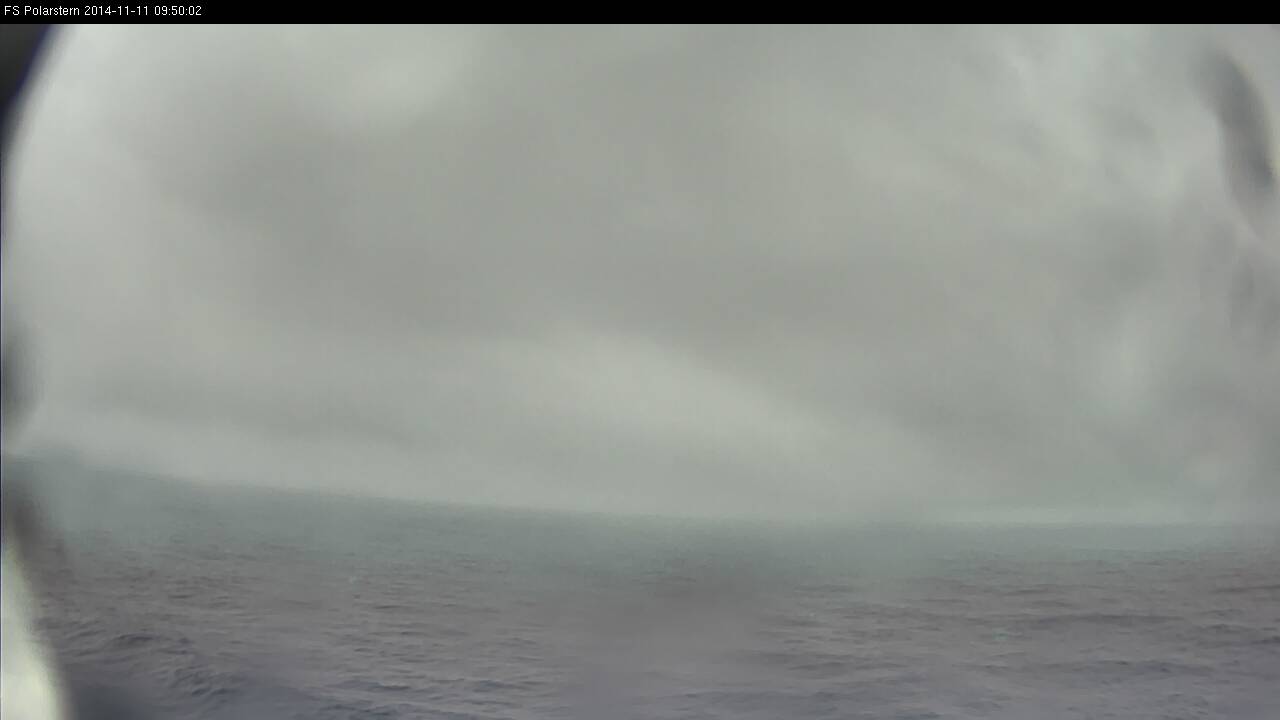
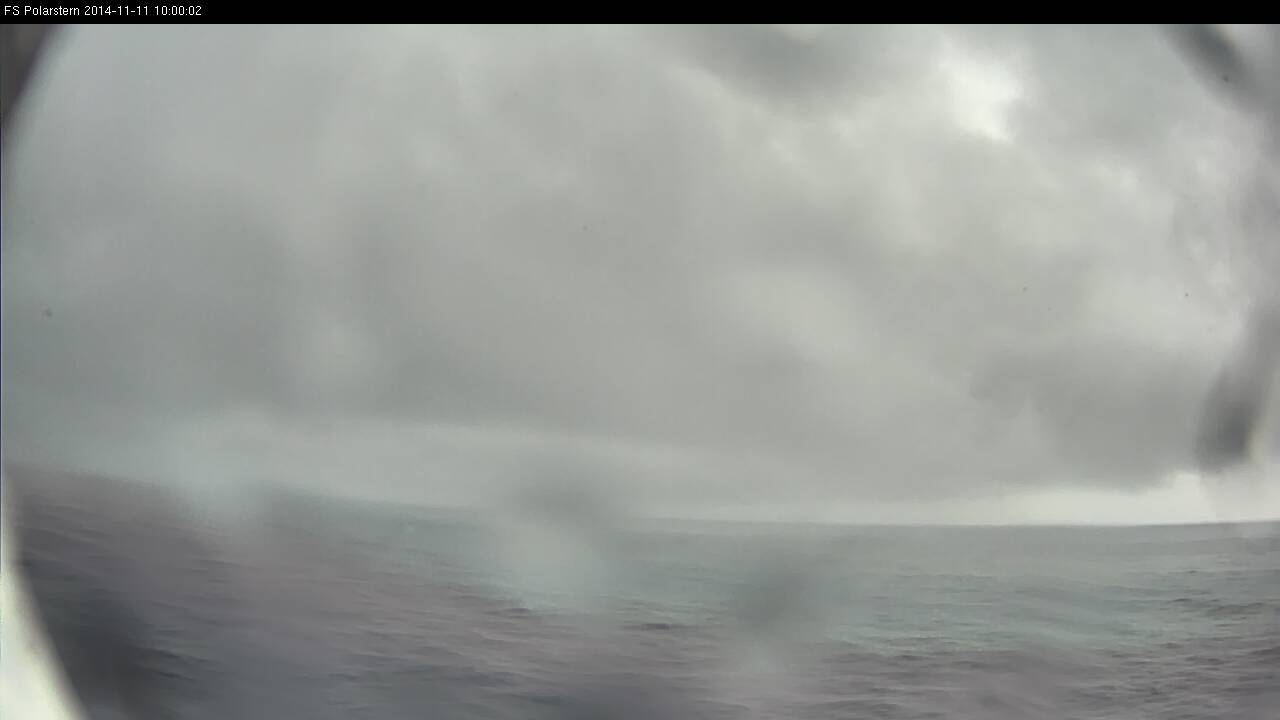
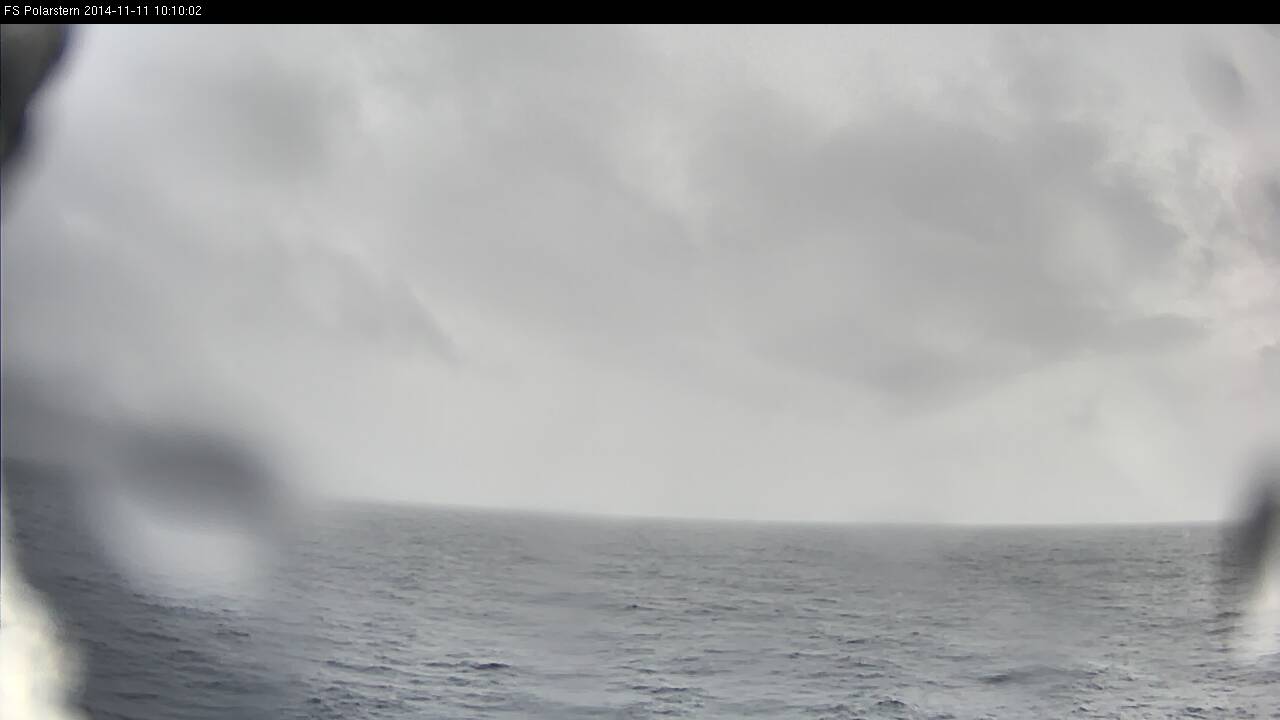
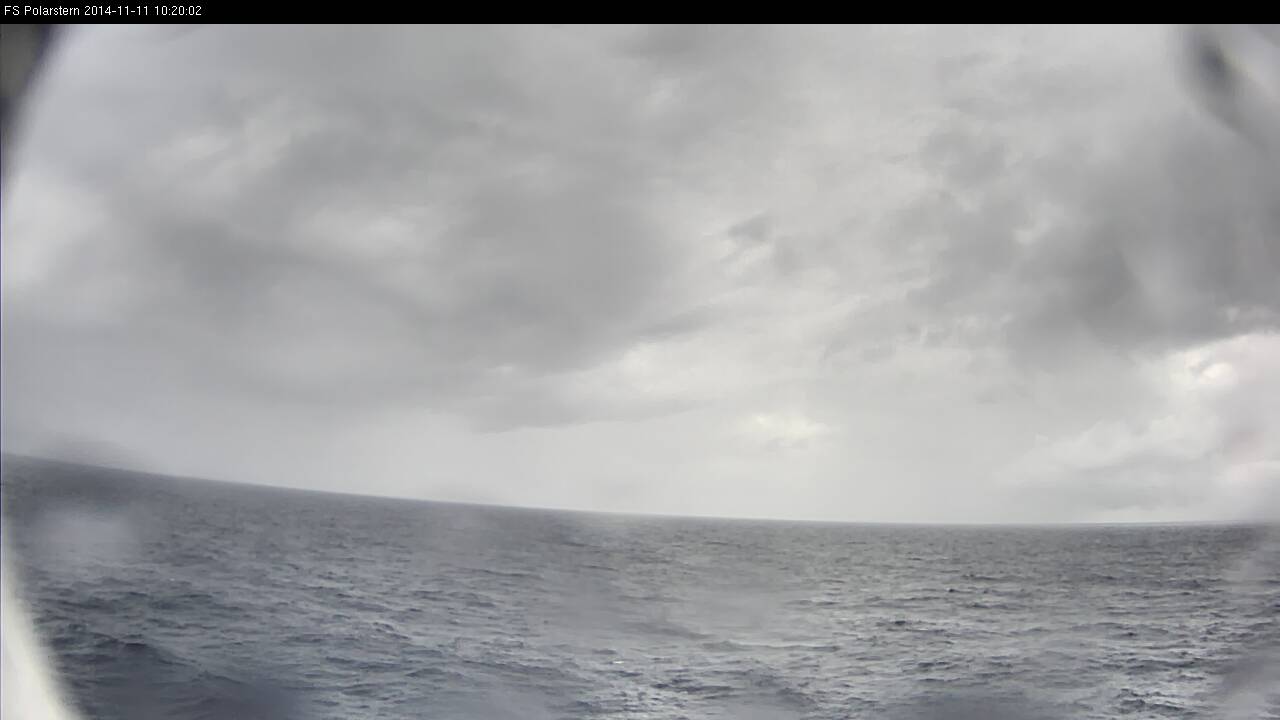
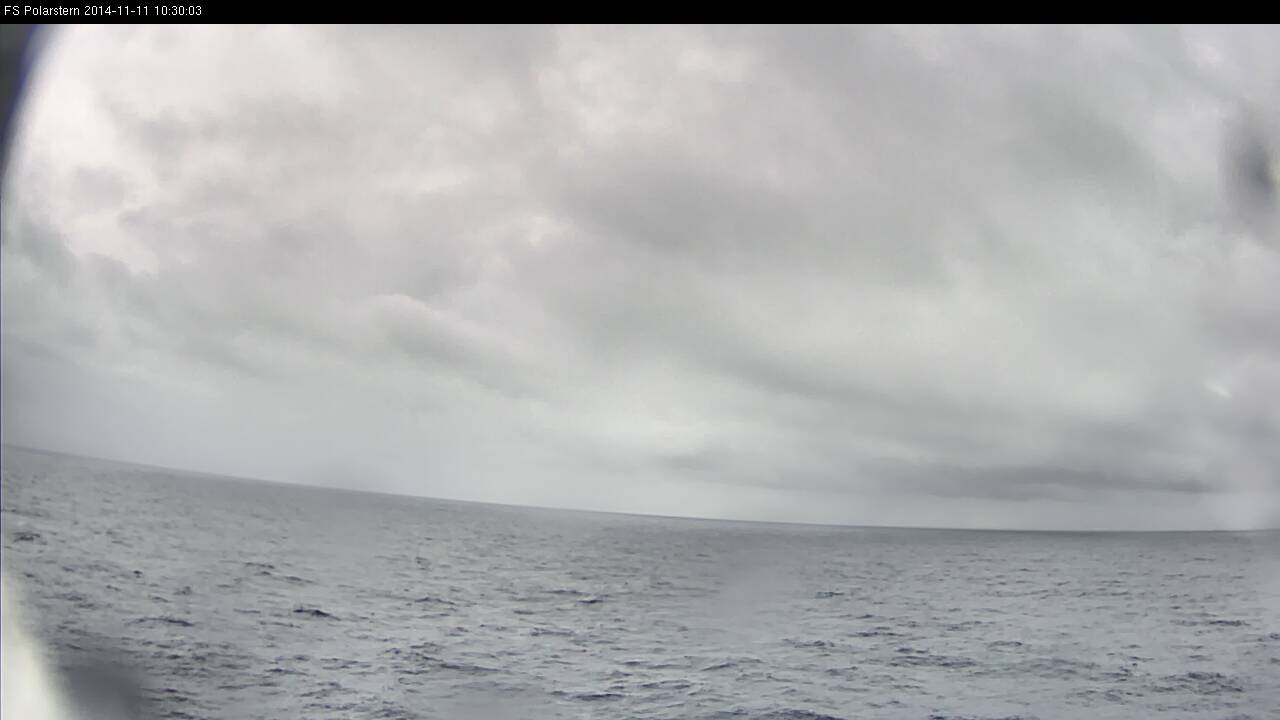
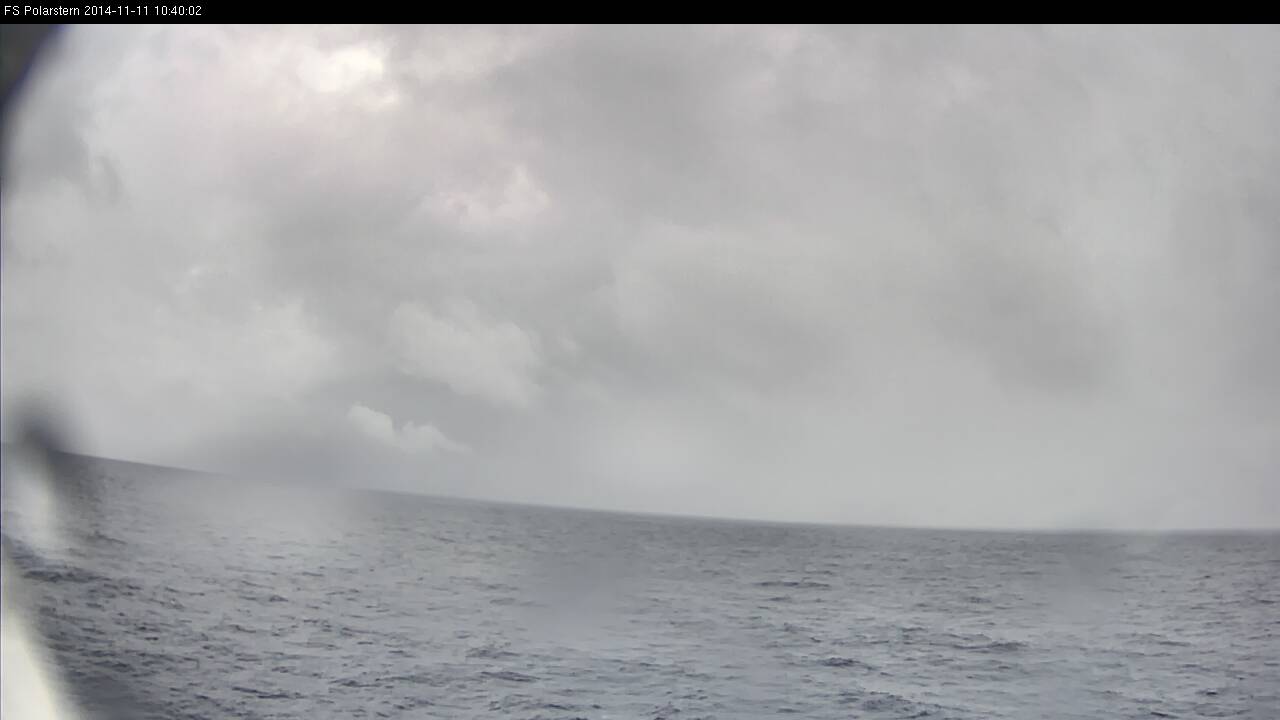
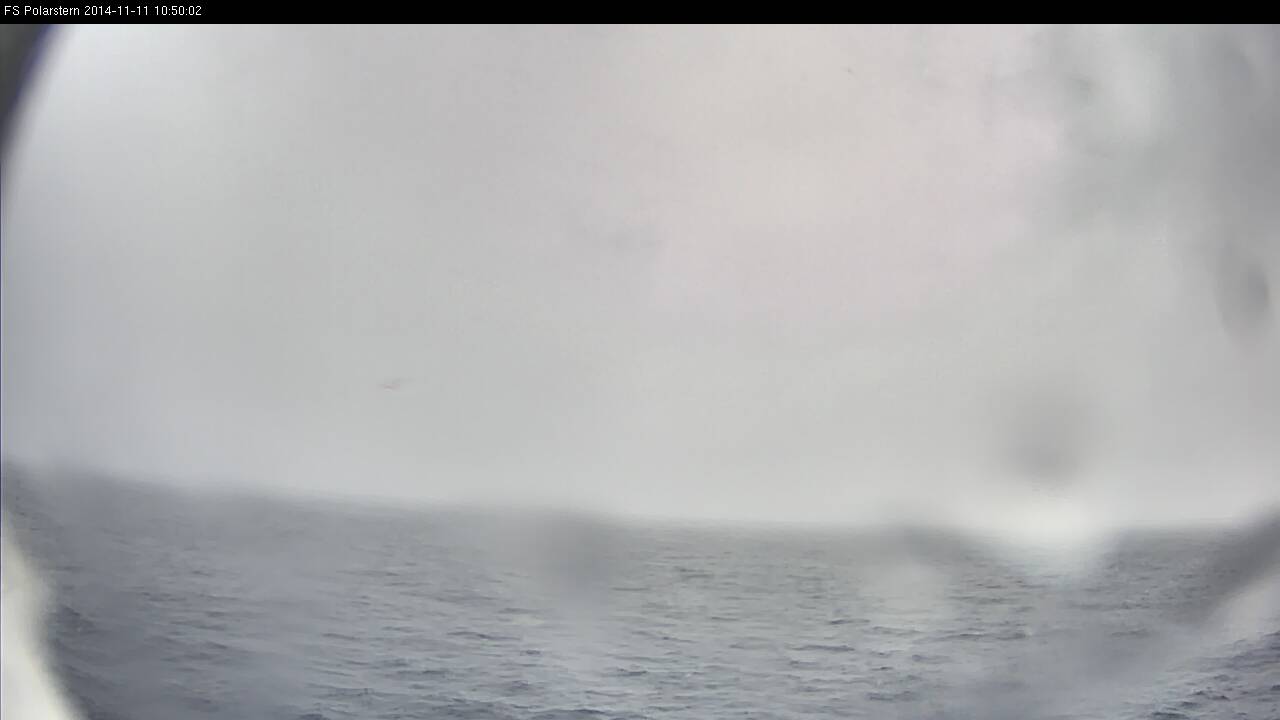
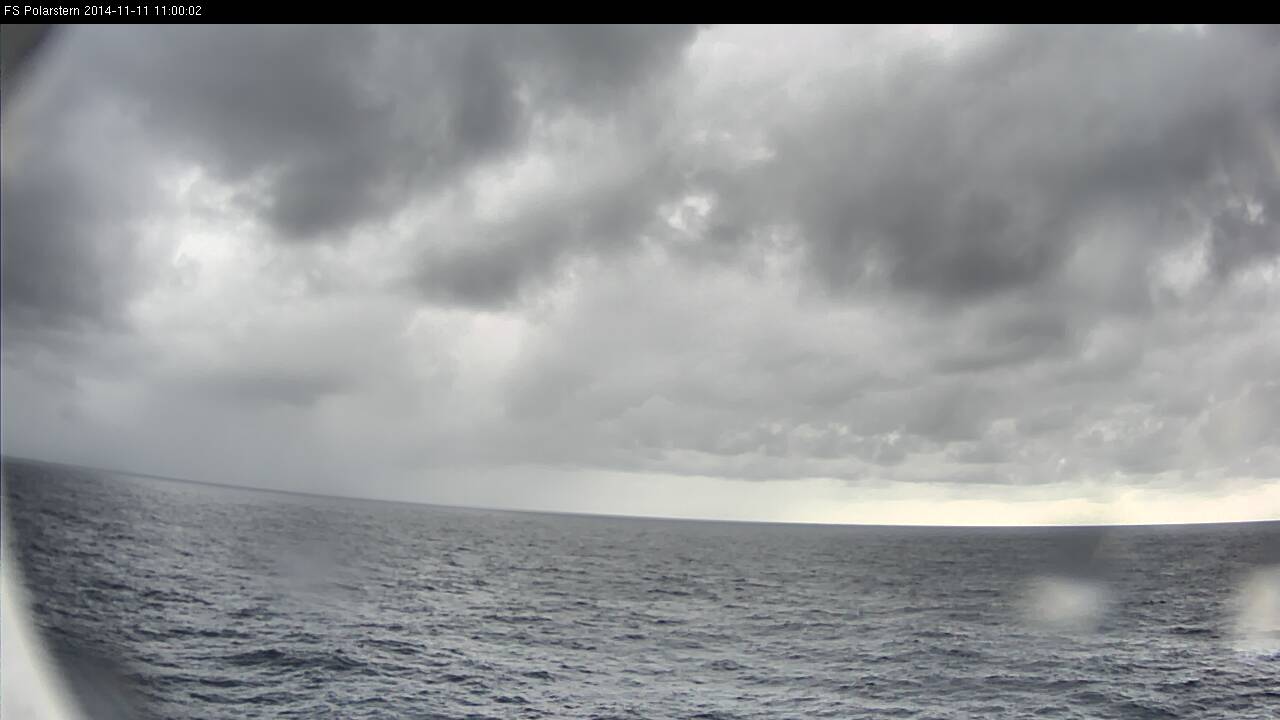
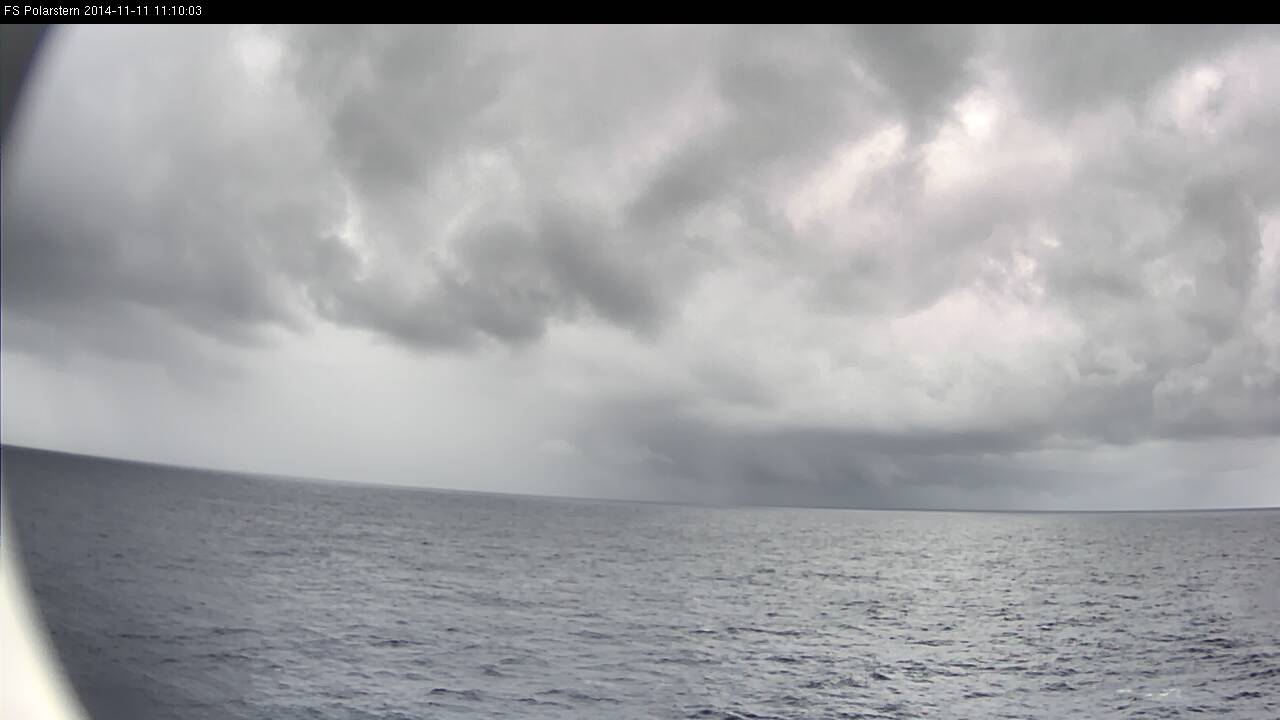
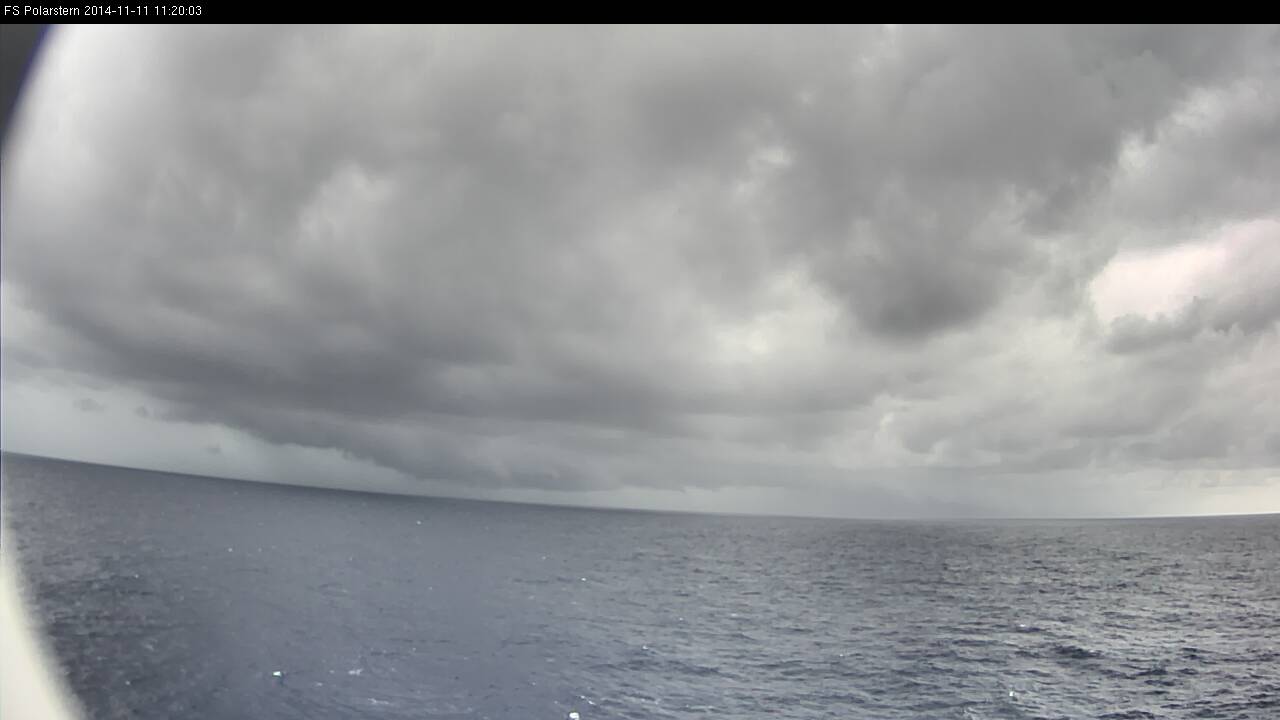
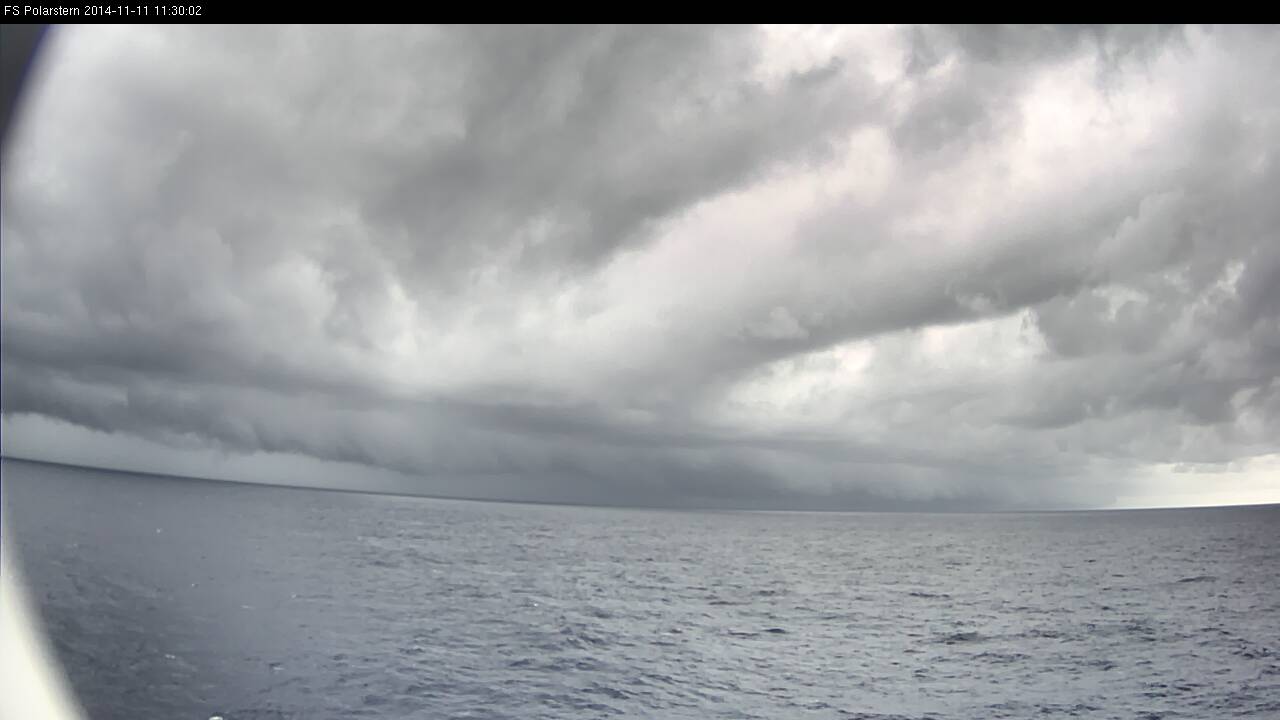
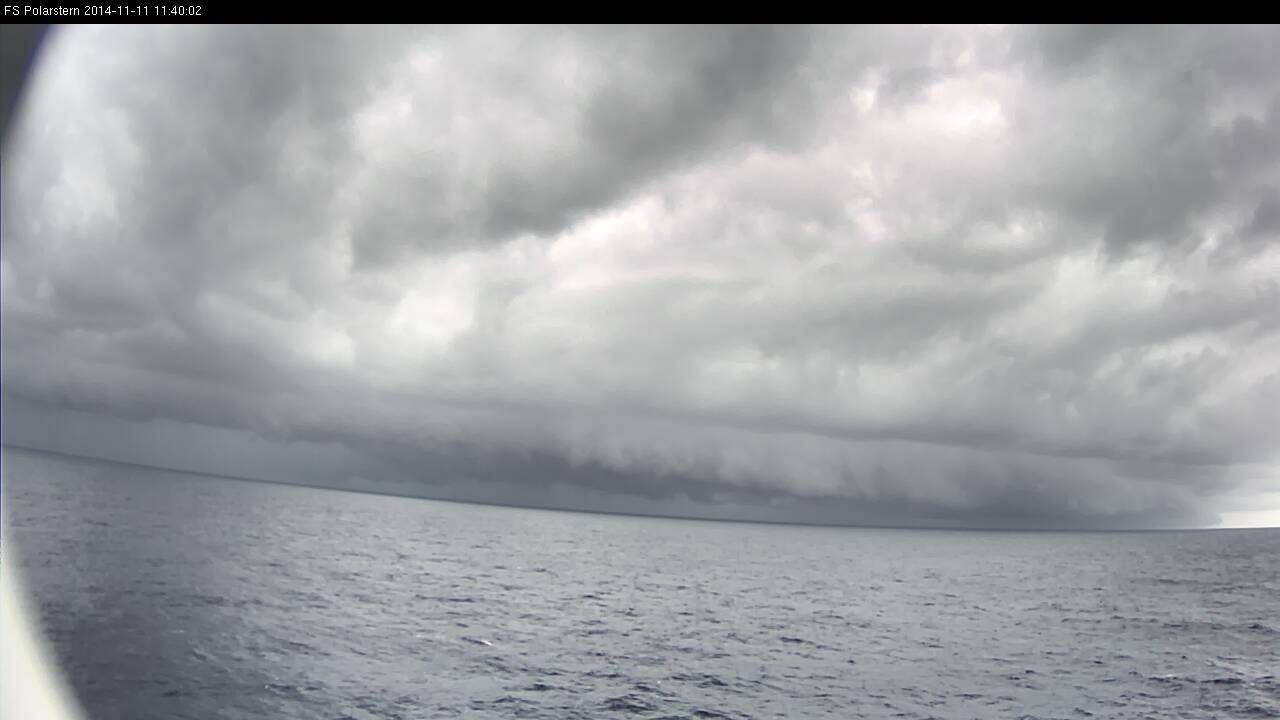
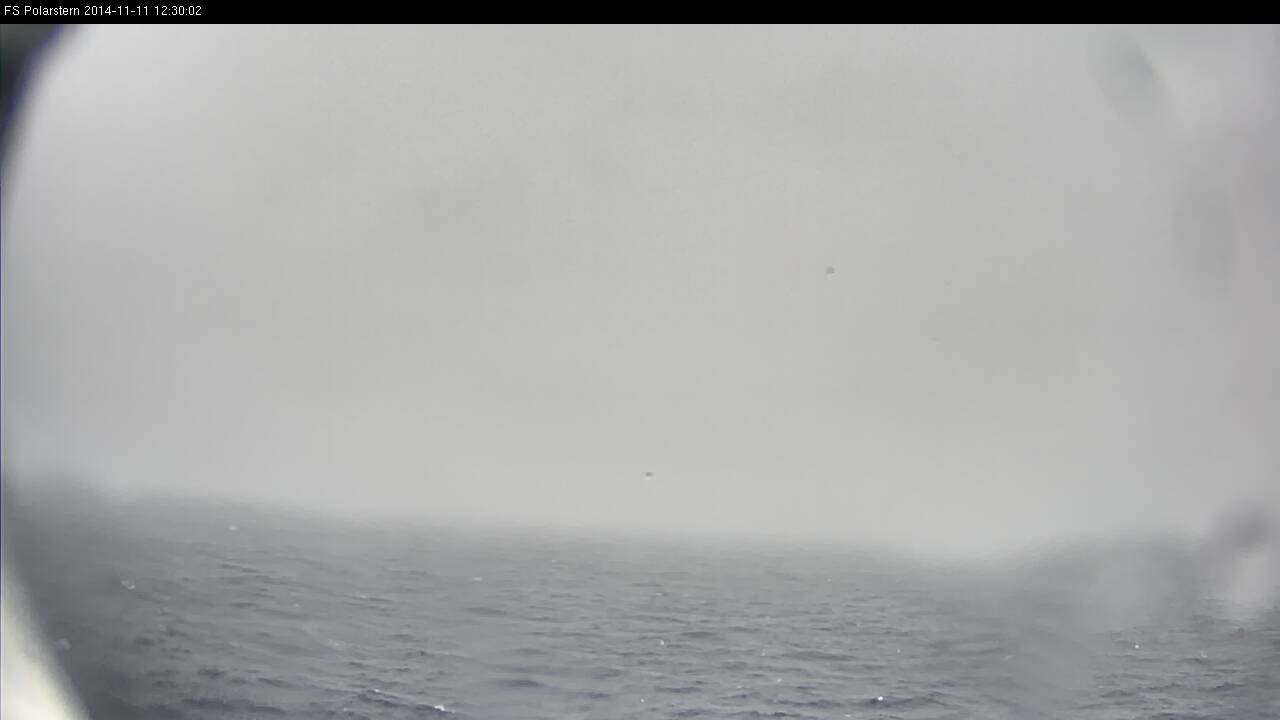
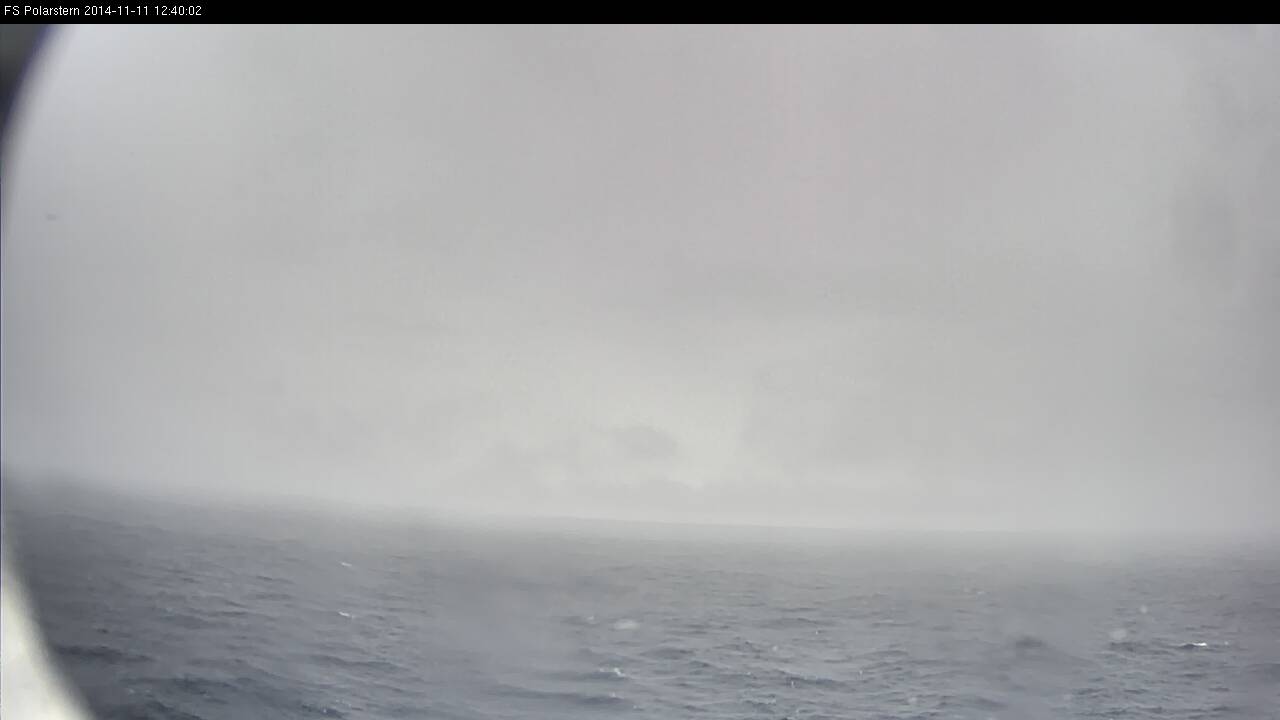
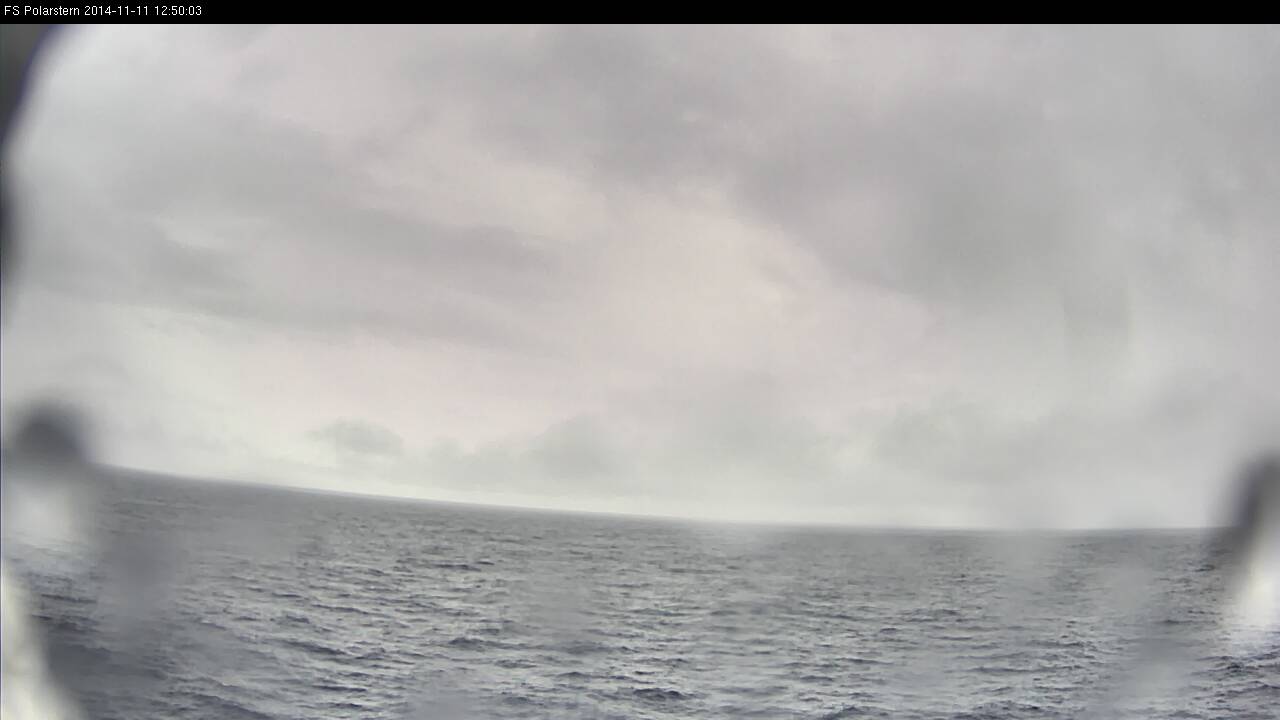
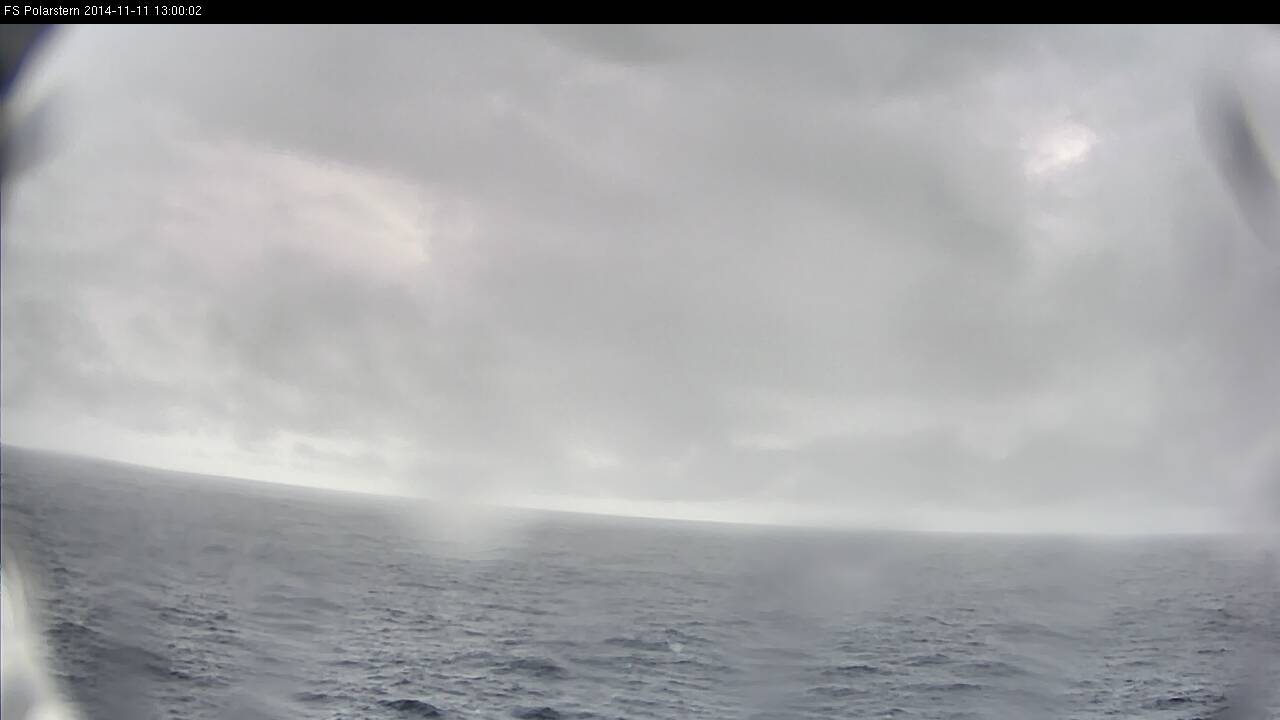
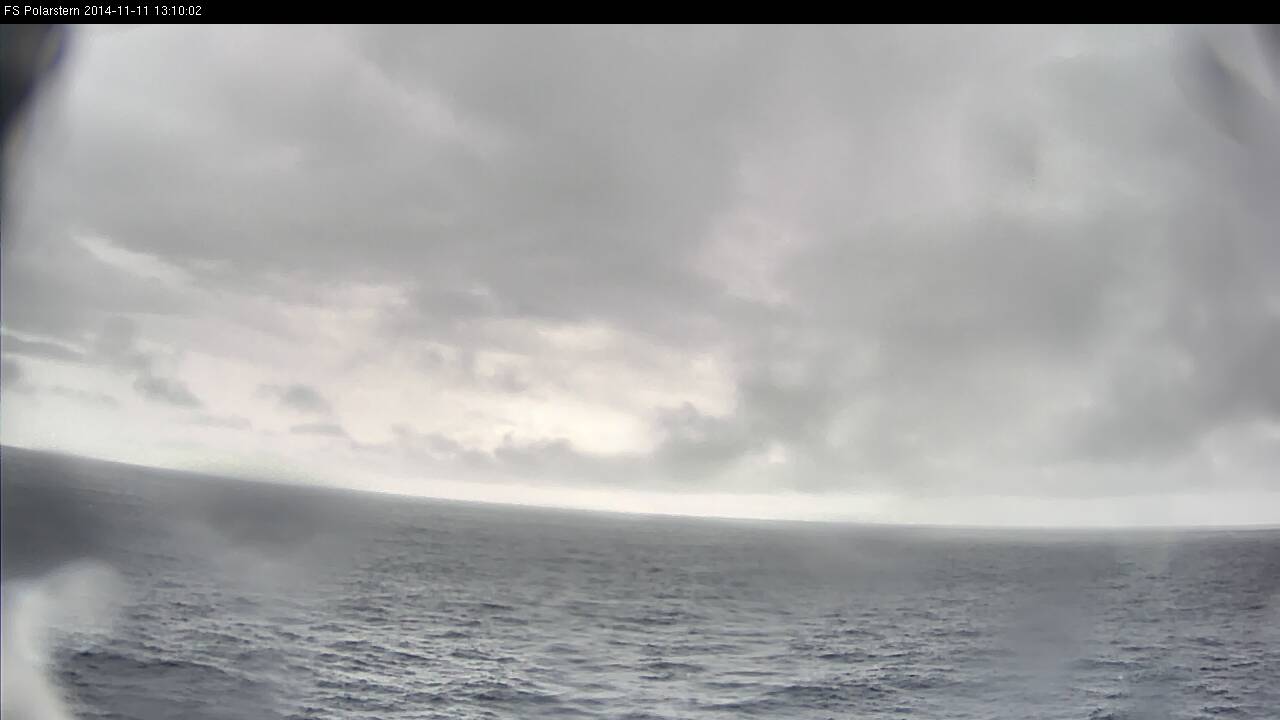
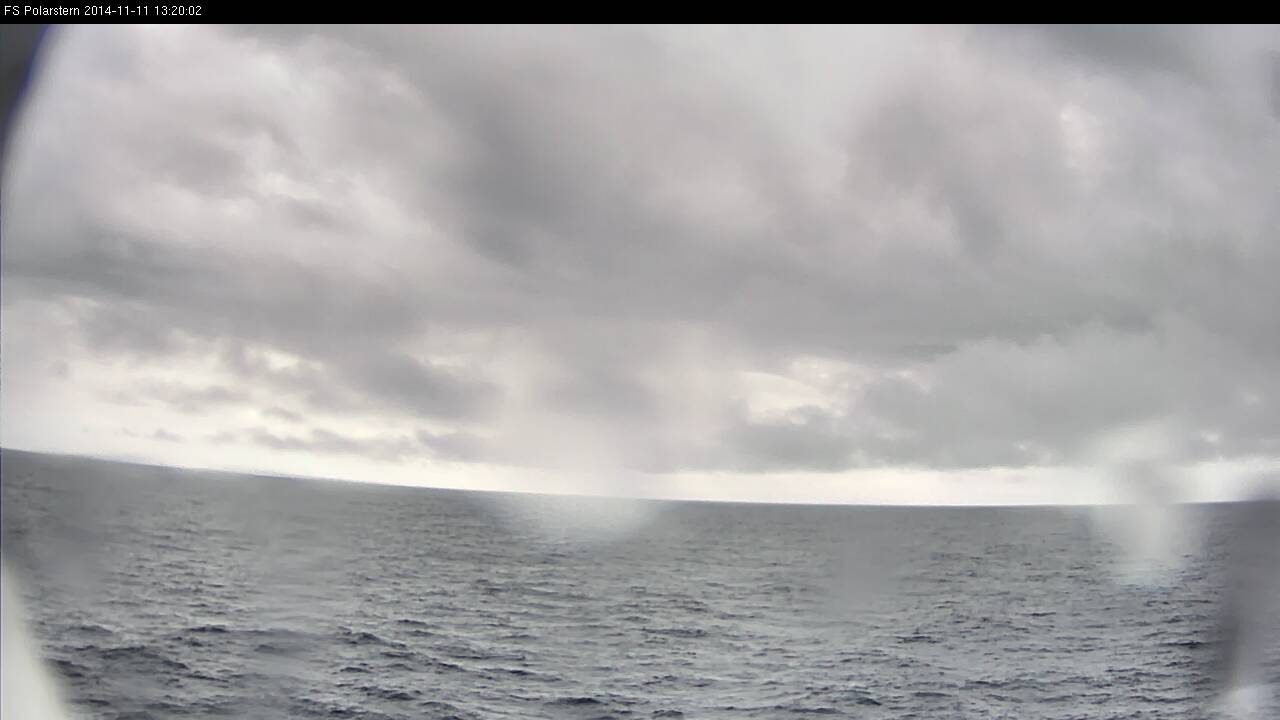
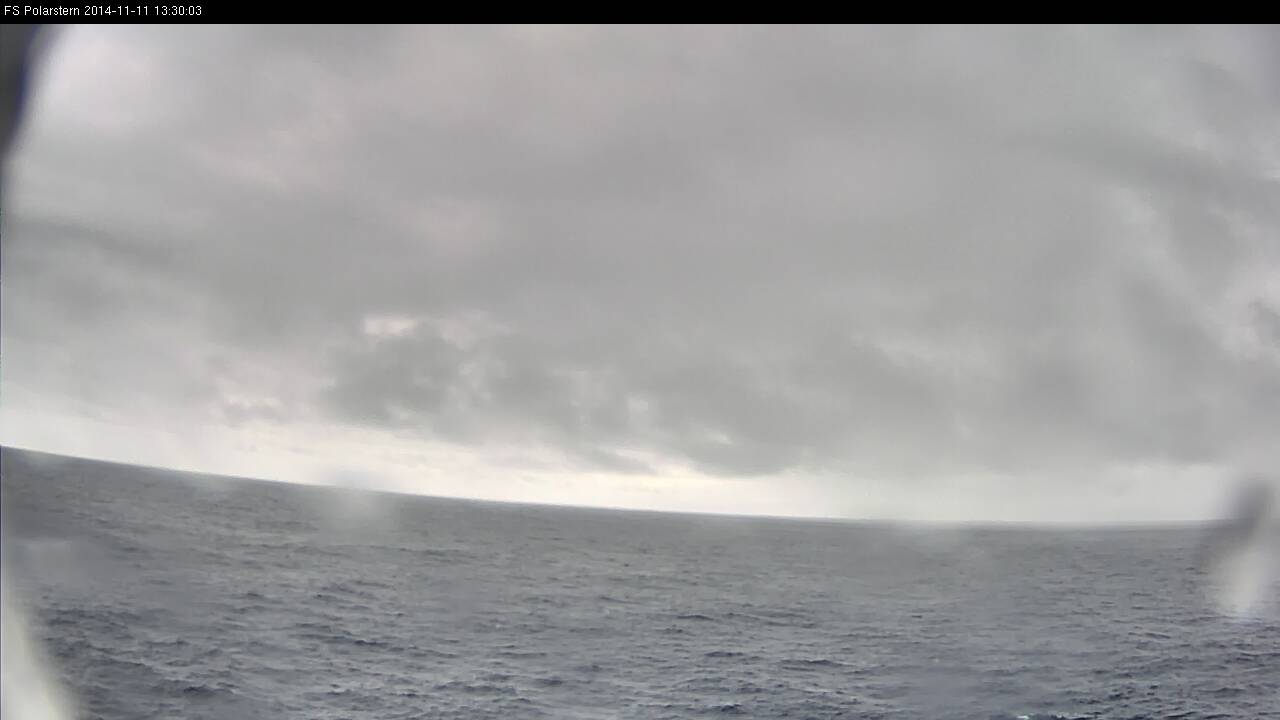
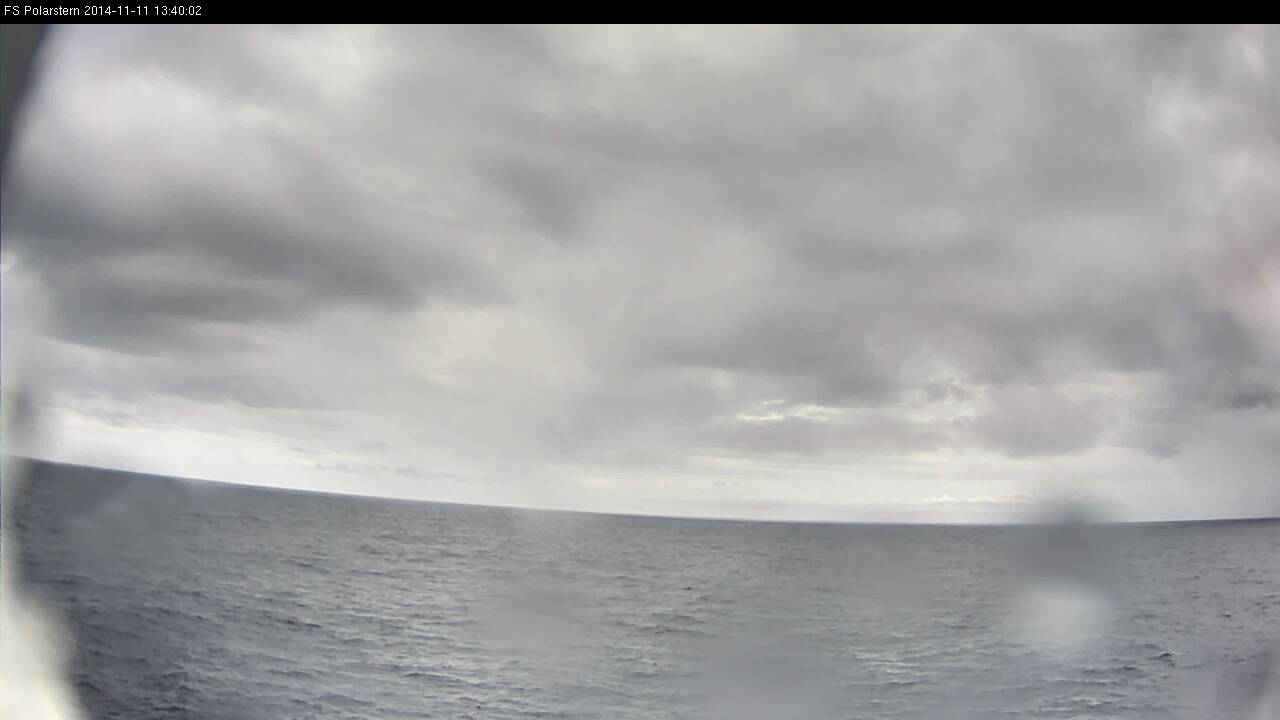
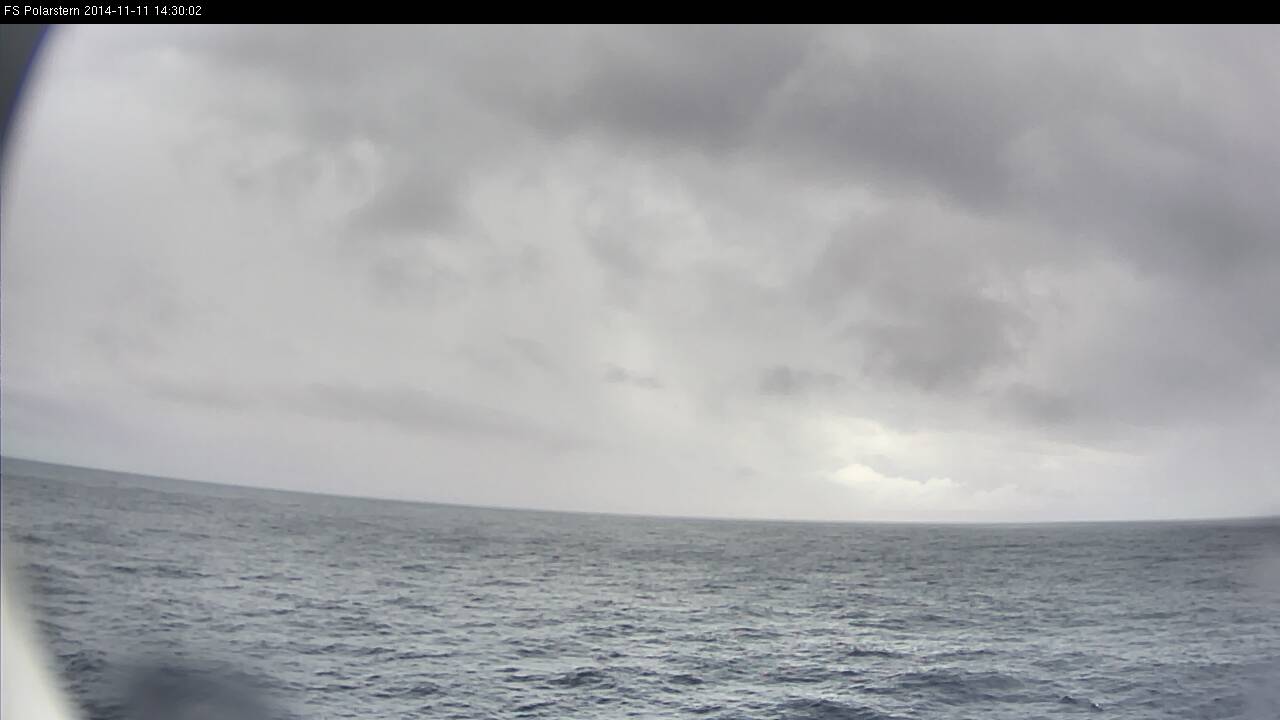
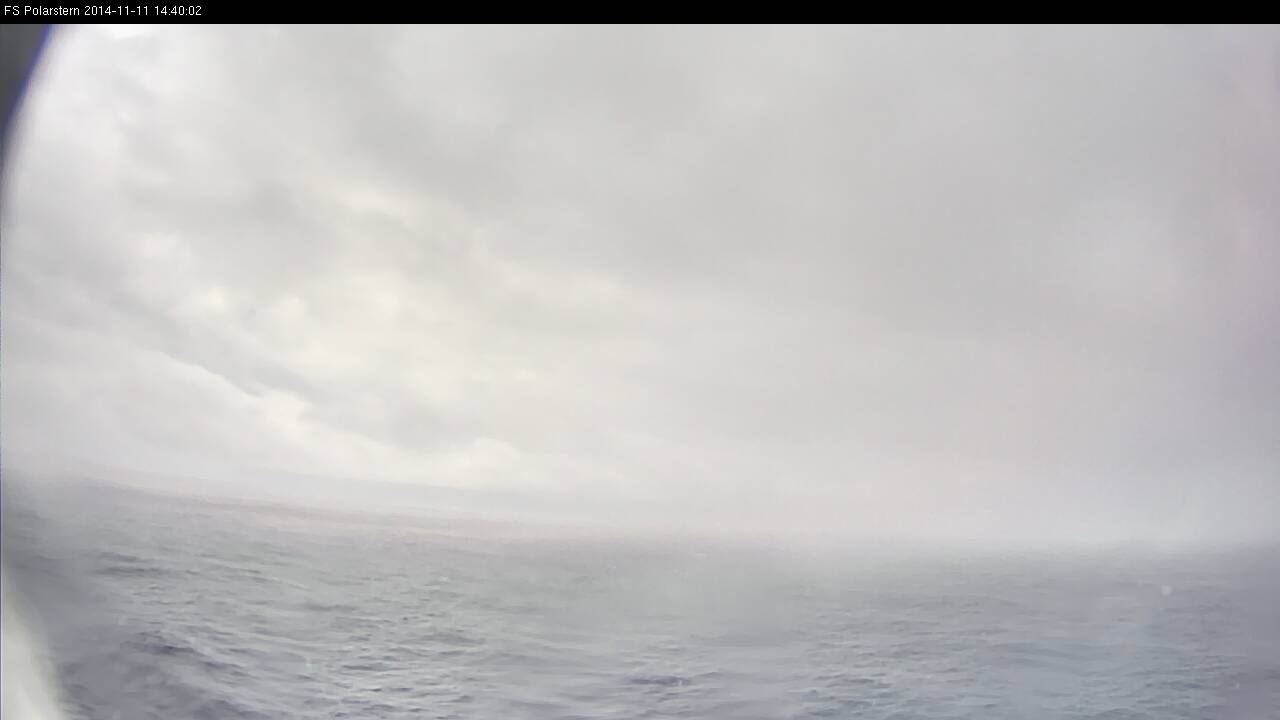
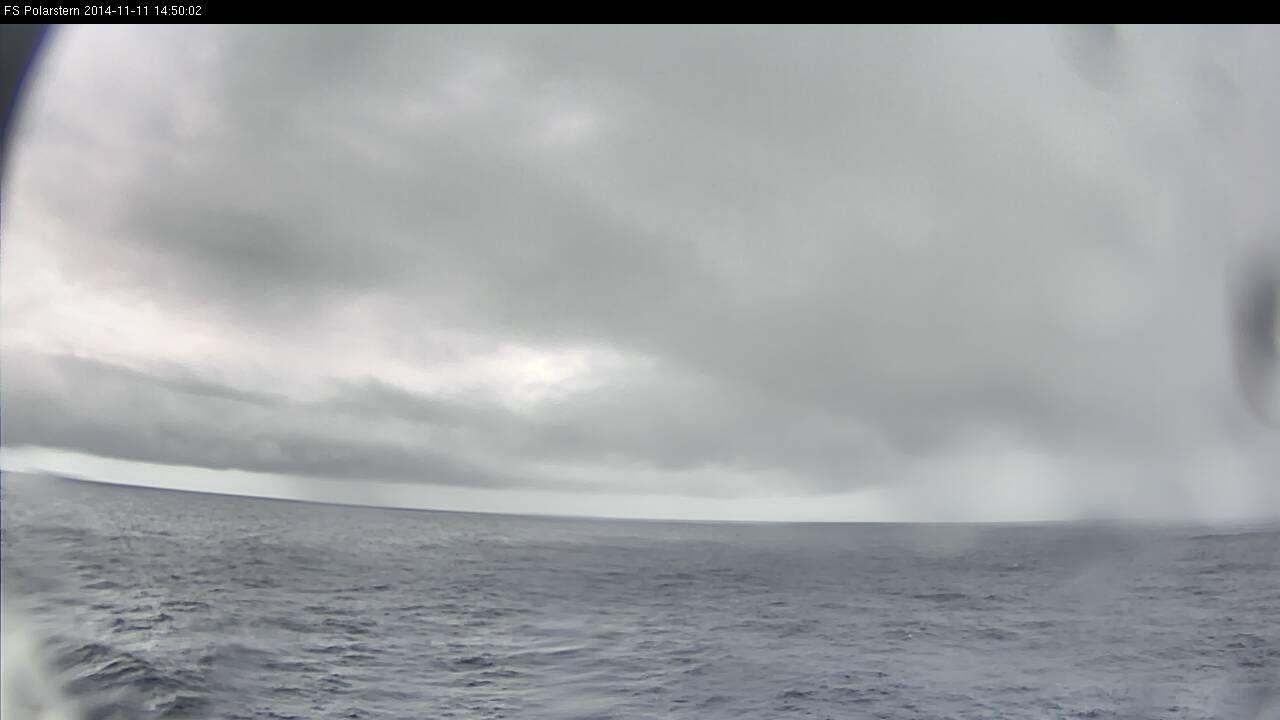
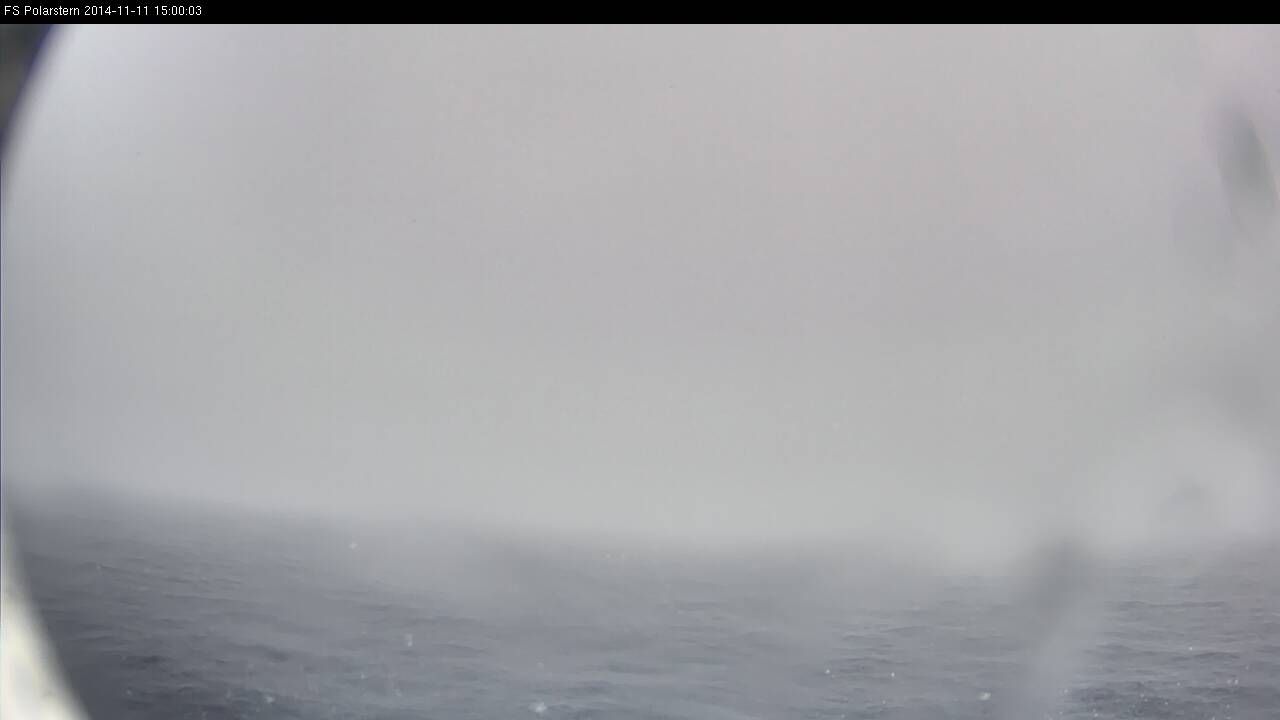
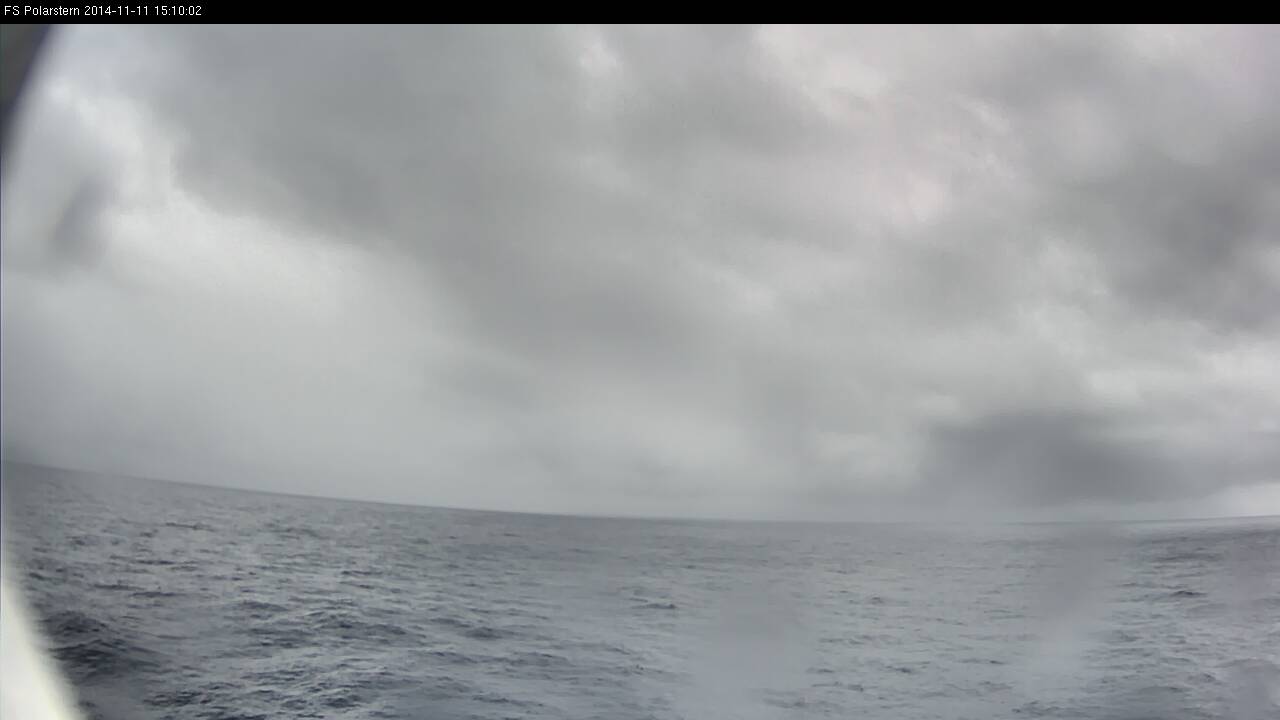
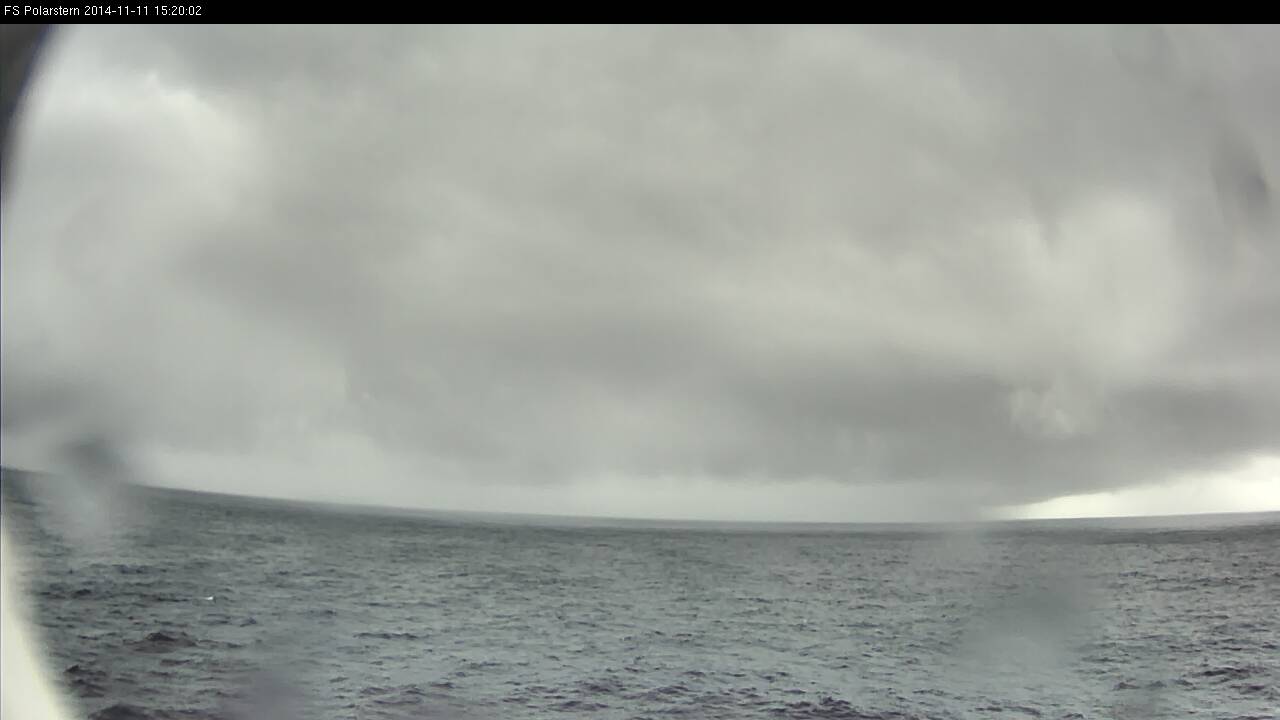
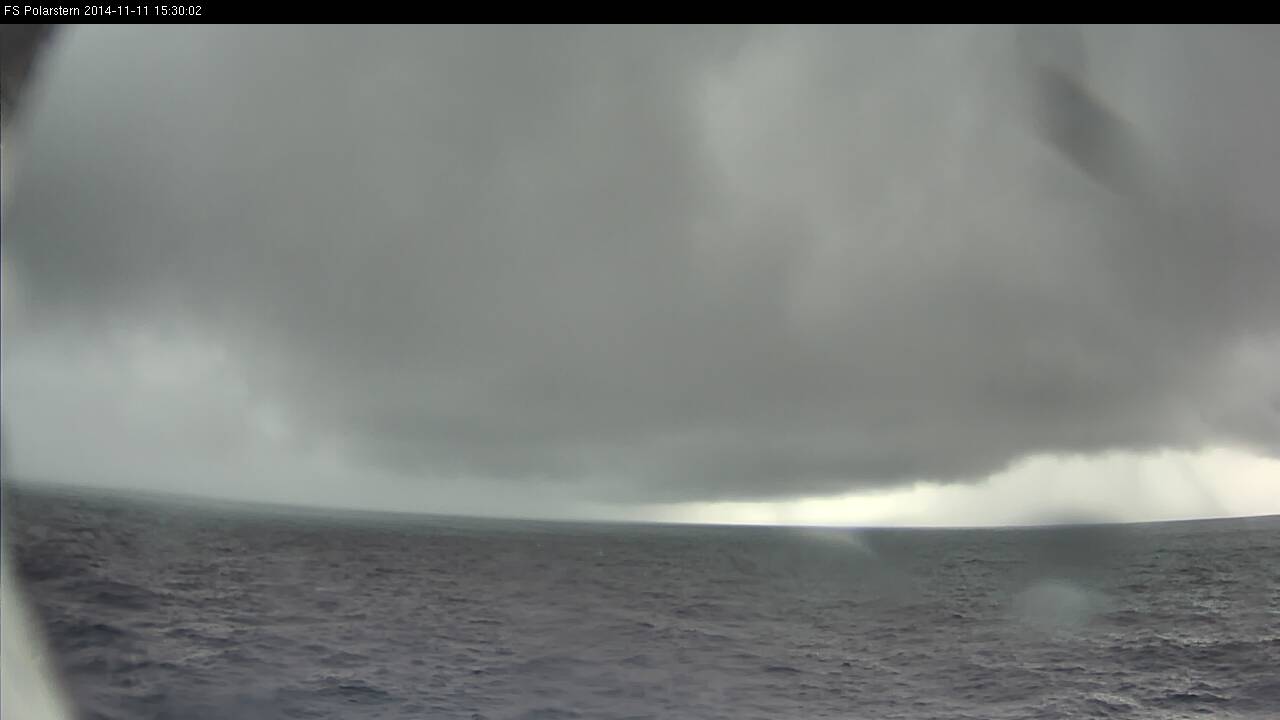
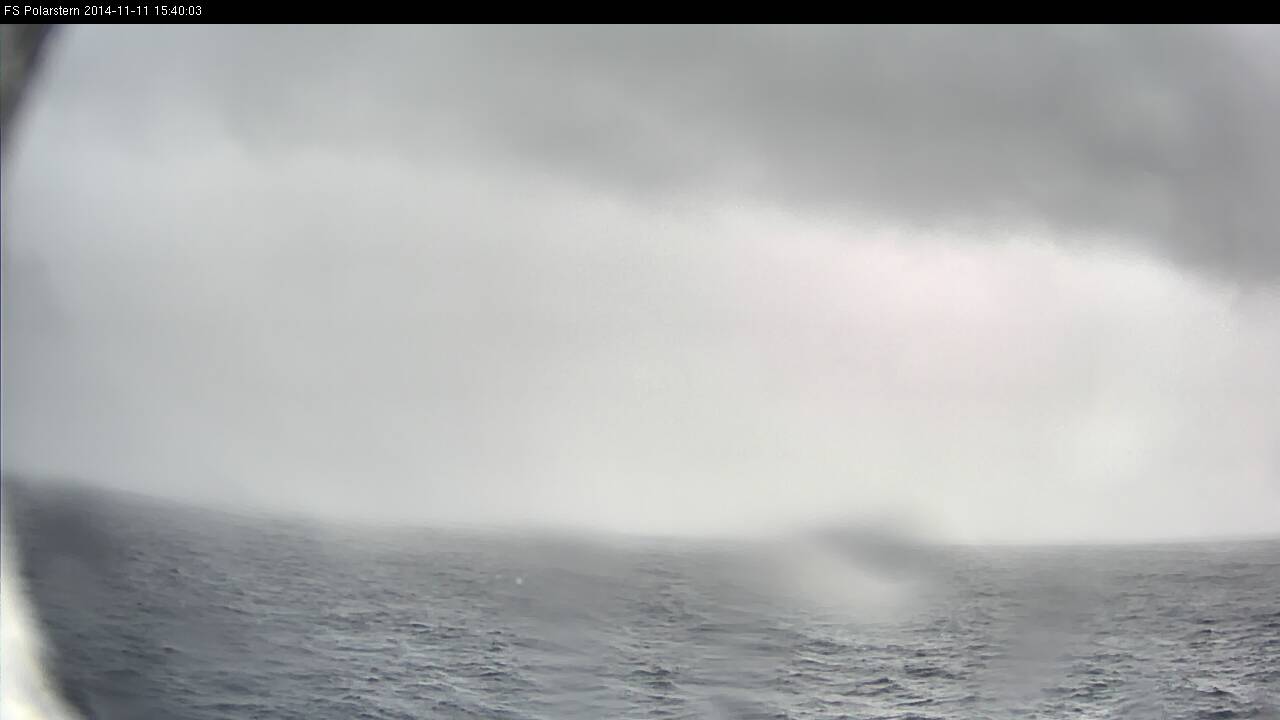
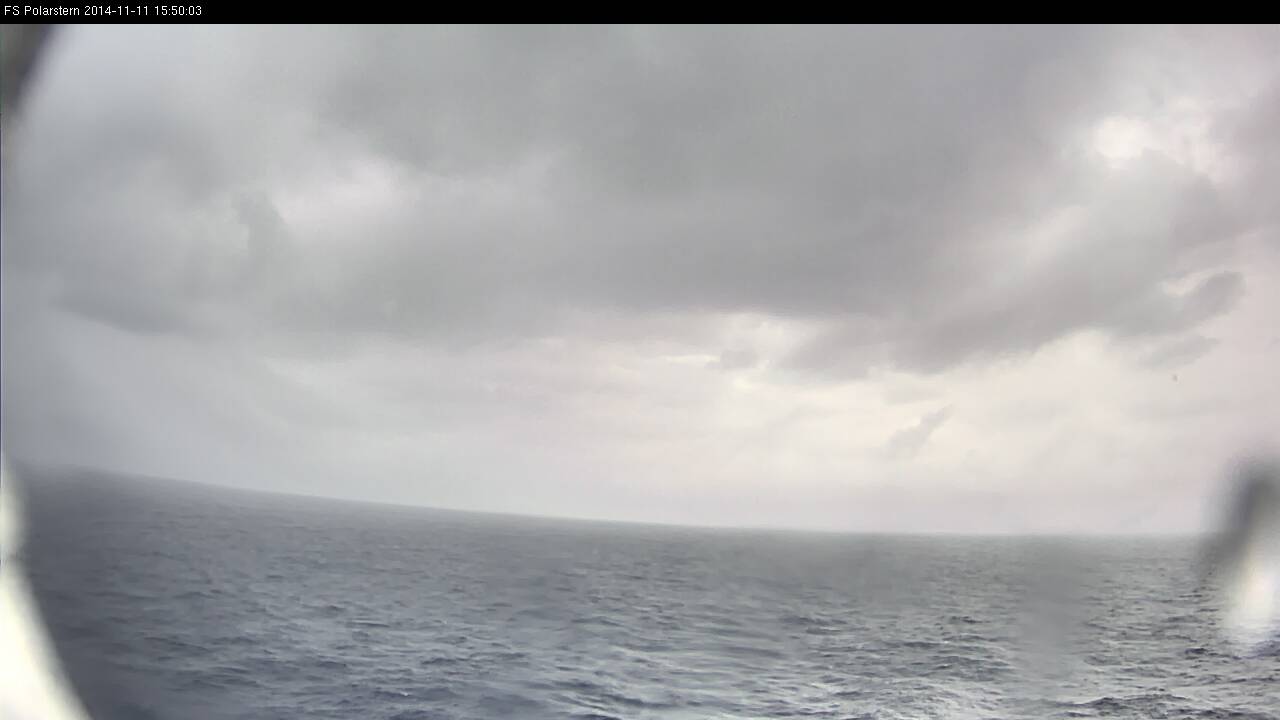
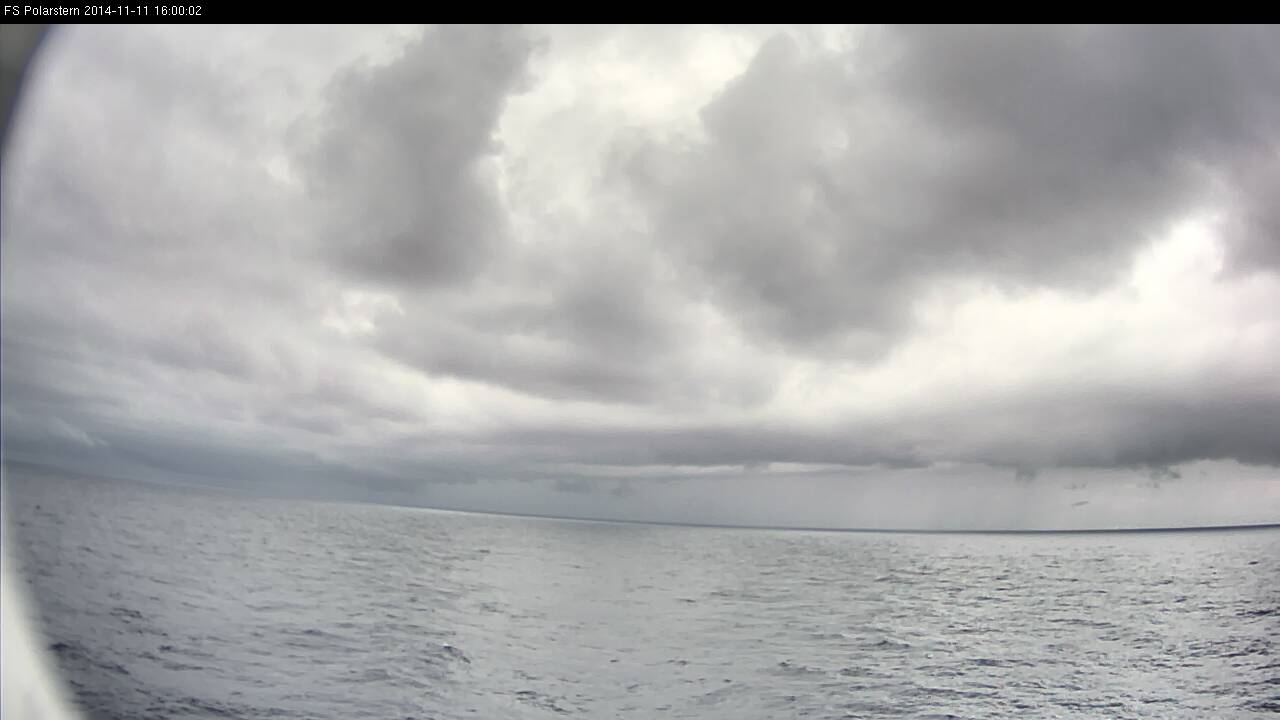
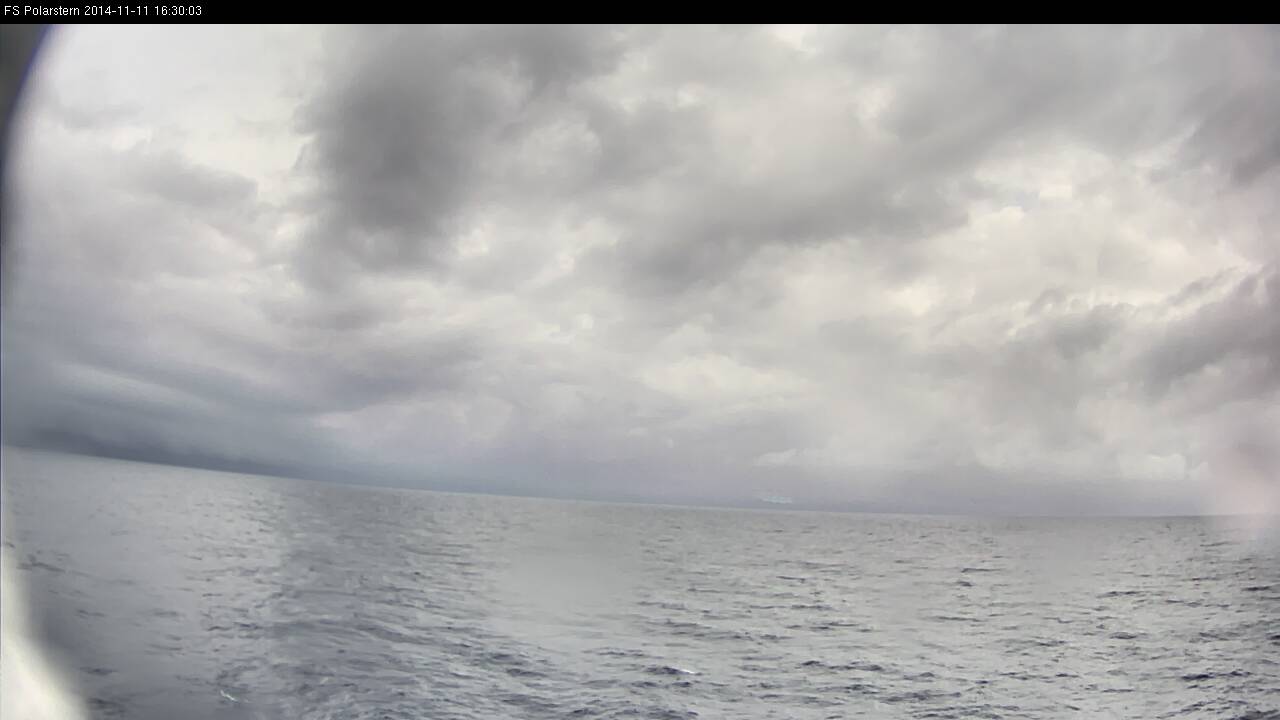
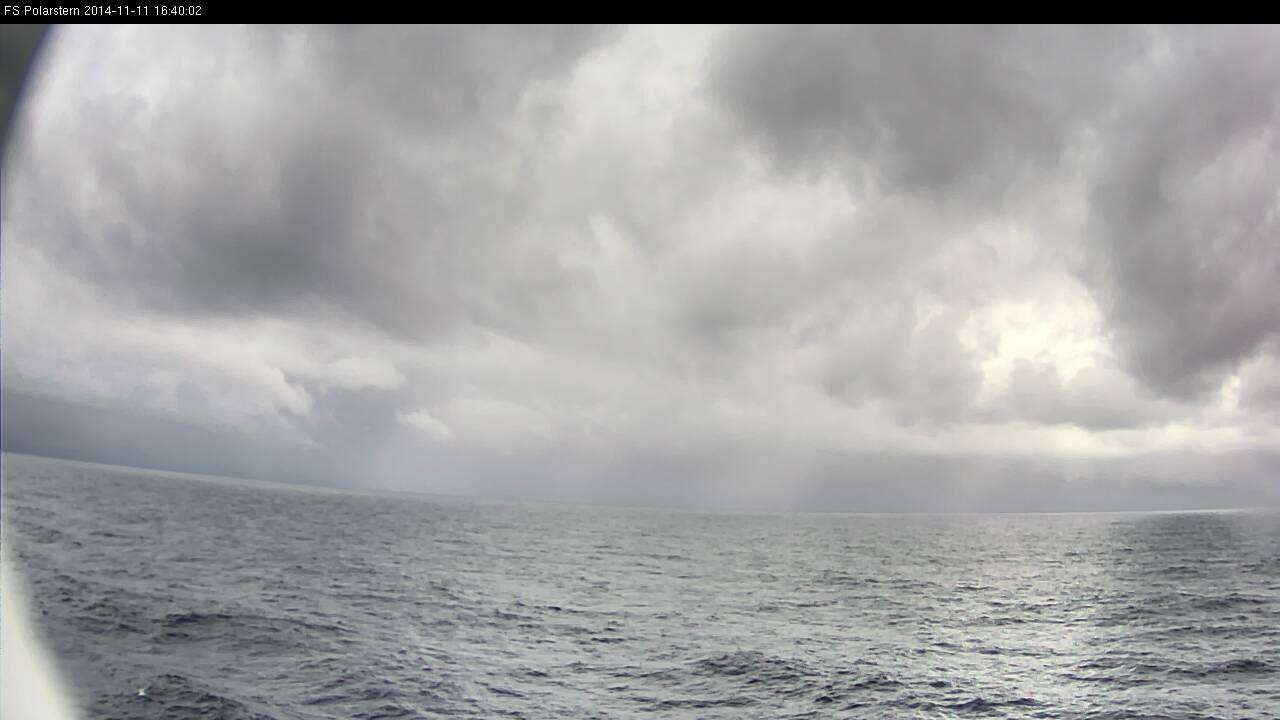
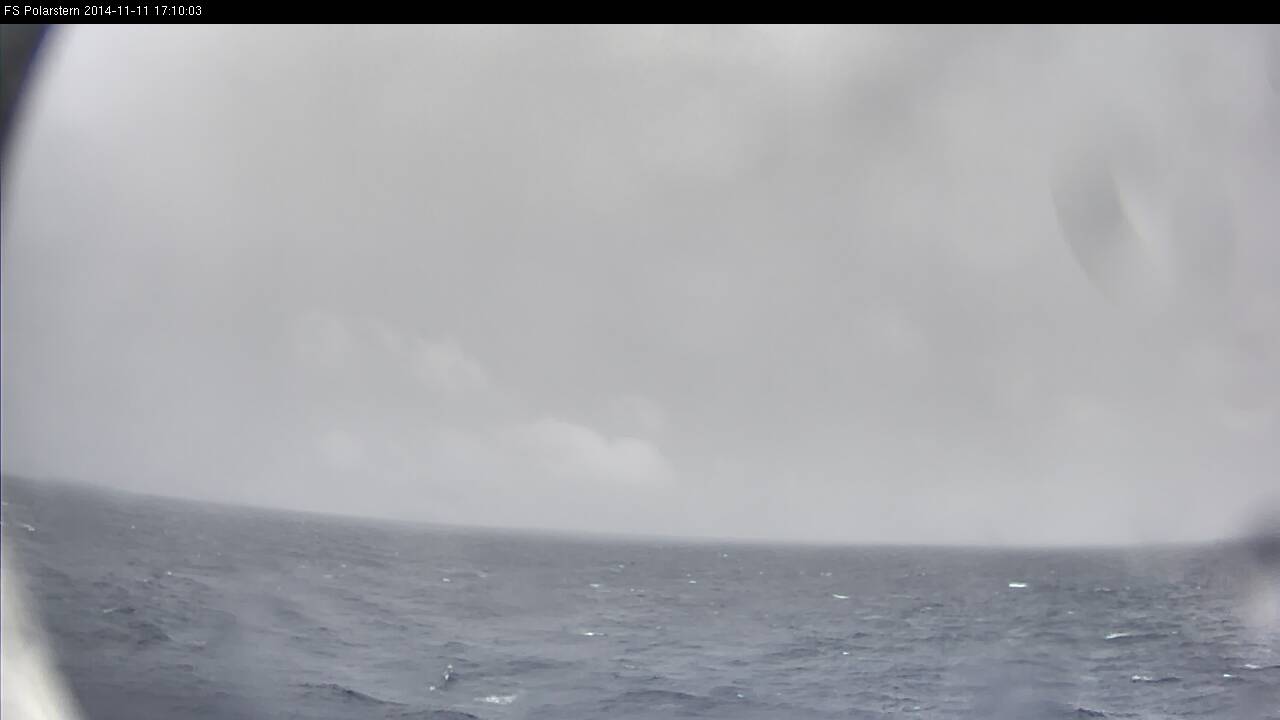
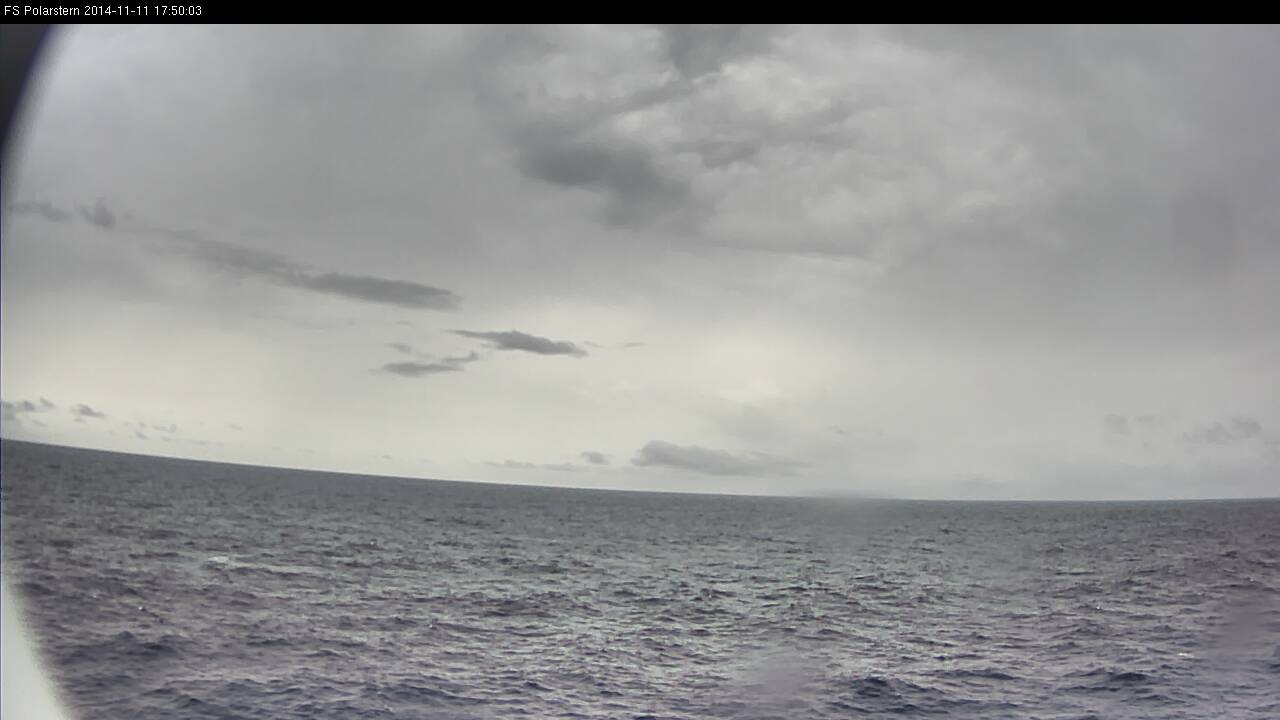
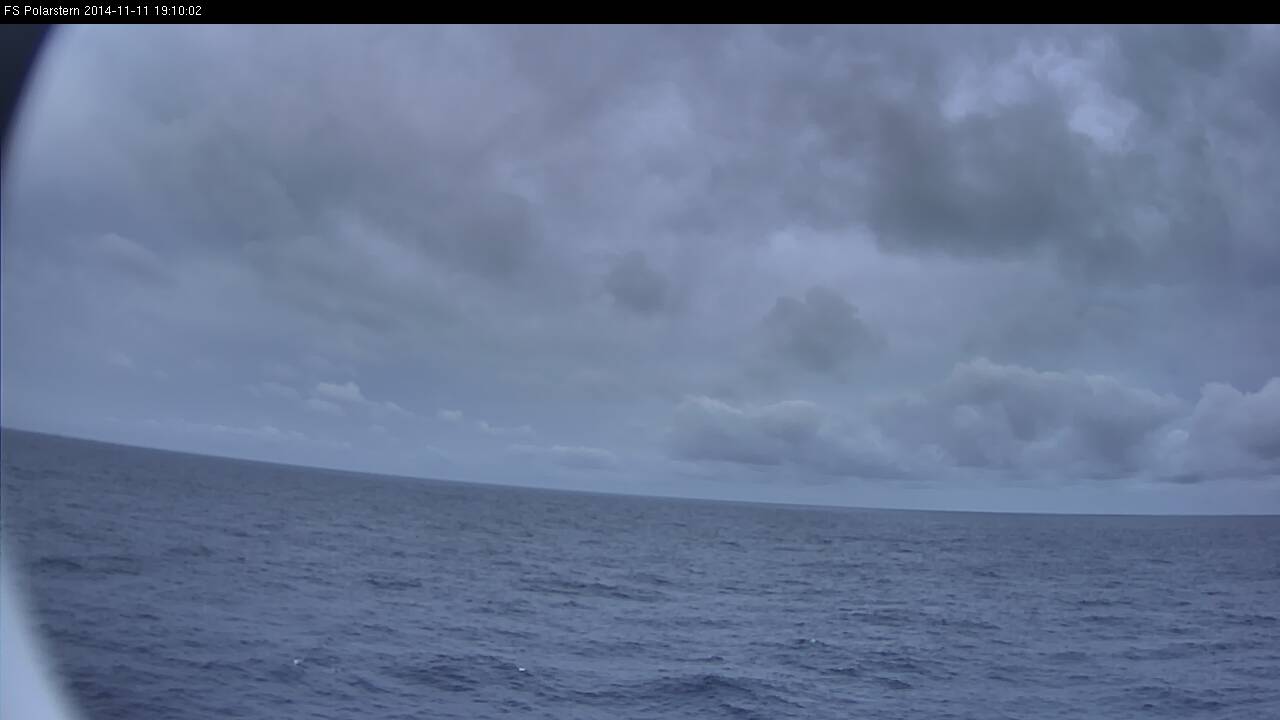
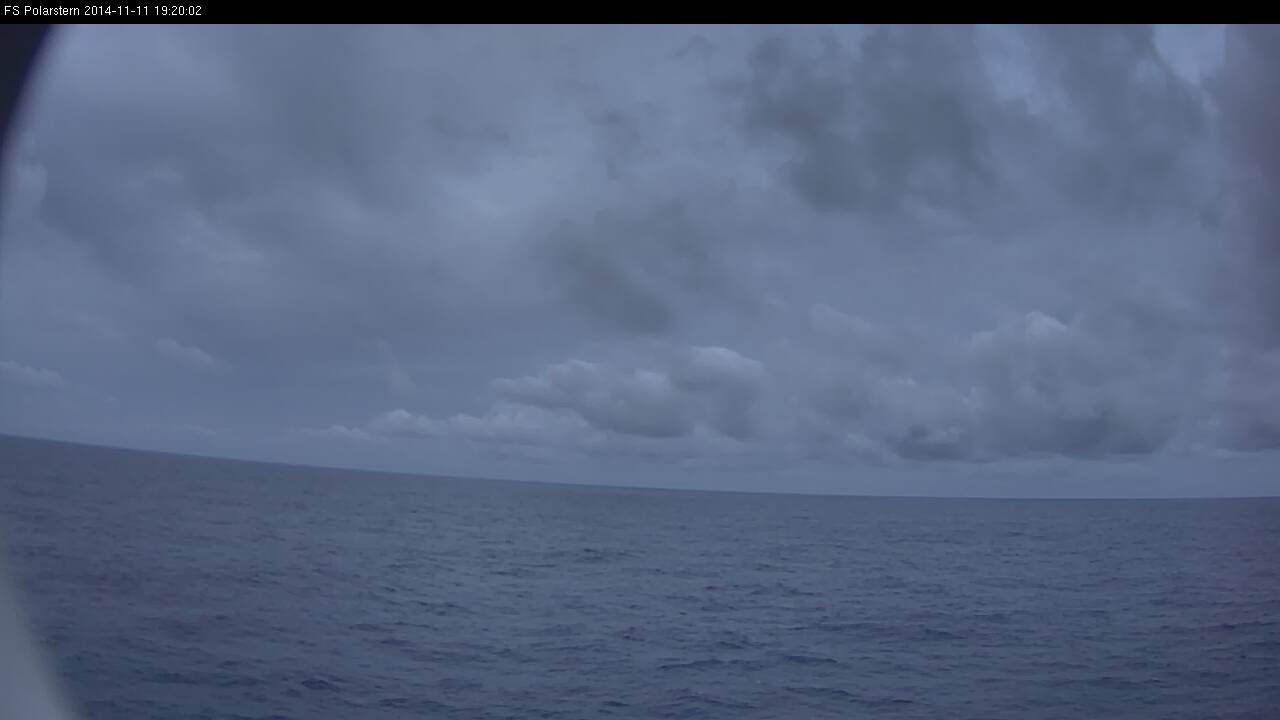
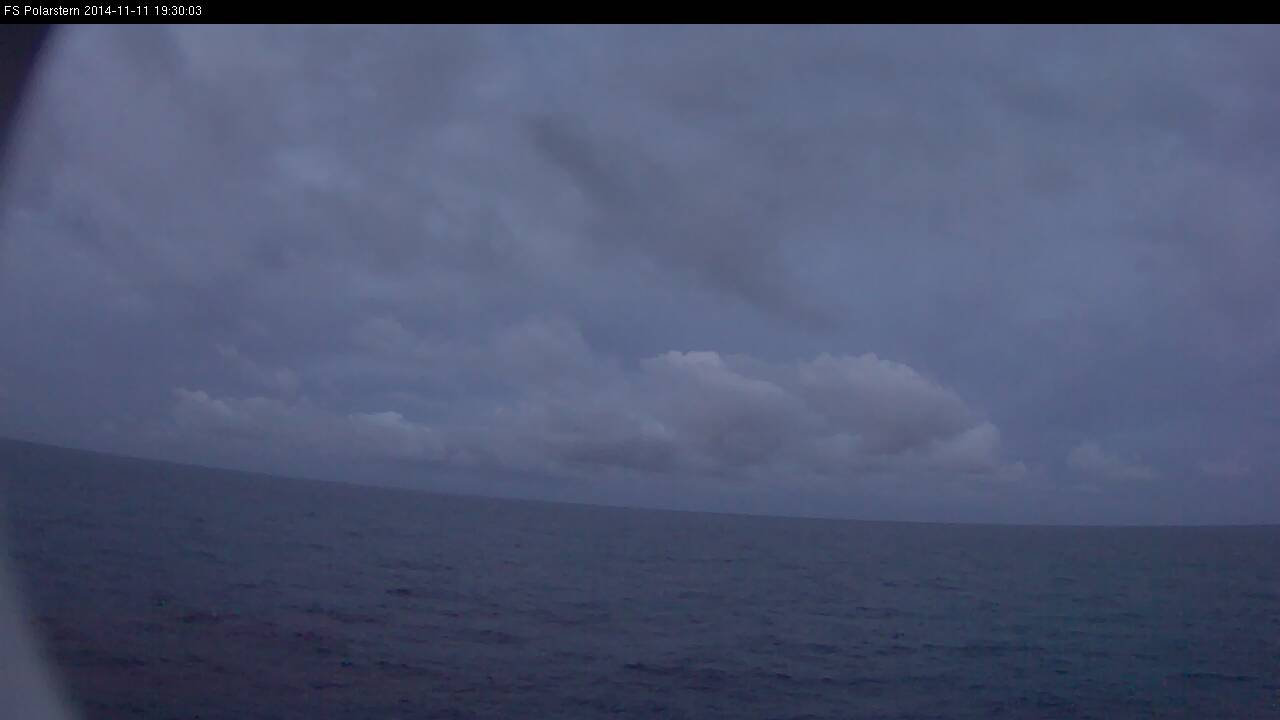
Figure L2-19: 11 Nov 2014, 11:50 UTC. Clouds in the center of the ITCZ. Source: DWD.
In this image the strong wind convergence and the resulting turbulence are very impressive.
DBLK 11121 99040 70230 11496 81206 10247 20229 40122 51003 6///1 78082 889//
22242 04281 20301 315// 40803 6//// =
The SYNOP from 12:00 UTC reports a light rainshower. Due to the moist airmass with a dewpoint of 22,9°C and the turbulence, the condensation level is very low. Evaporation from the sea surface is very high because of how warm the water is; the water temperature measures at 28,1°C. The Polarstern had reached the southern side of the ITCZ's convergence and the wind had veered to a southeasterly direction of 120° and 06 knots. The reported cloud layer is 8/8 (overcast) with cumulonimbus capillatus.
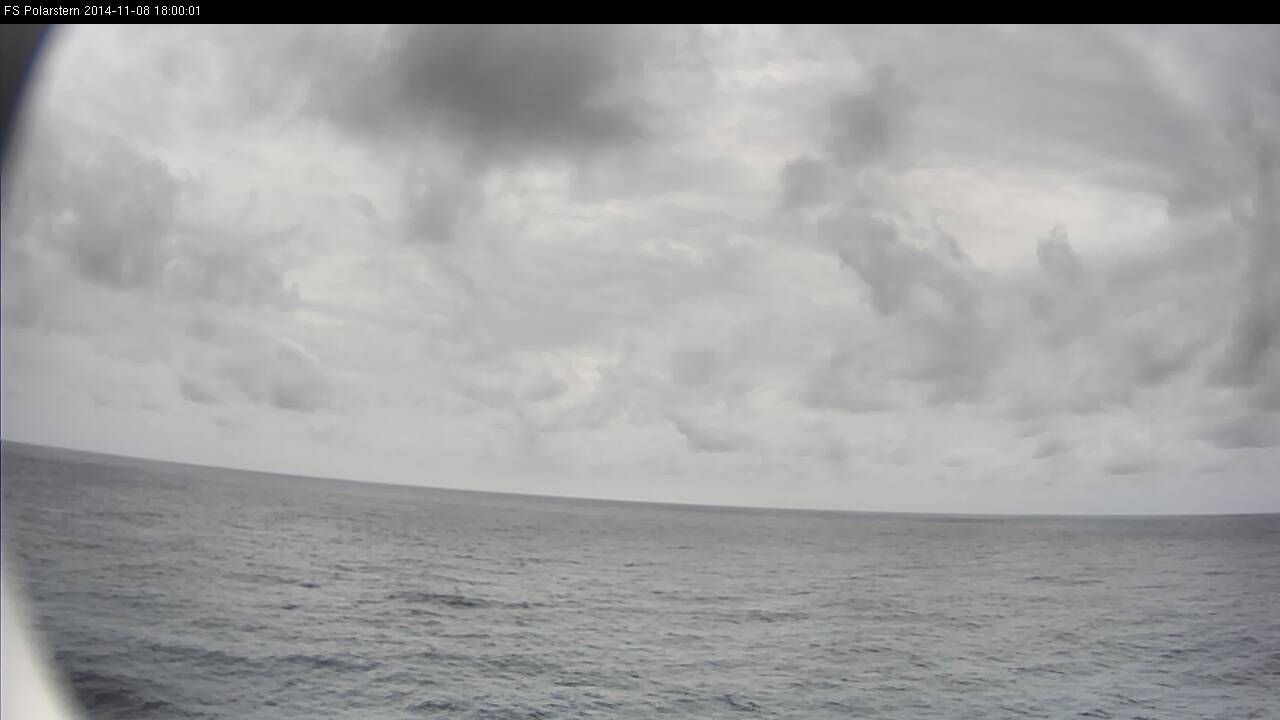
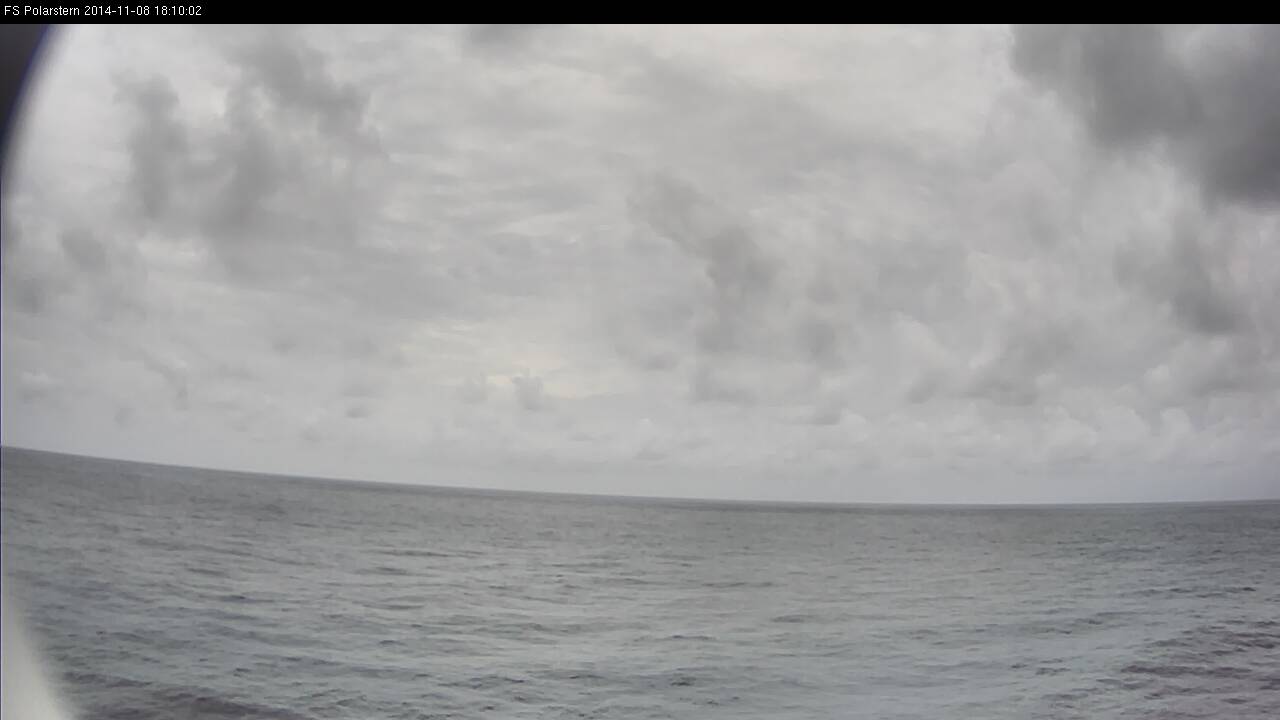
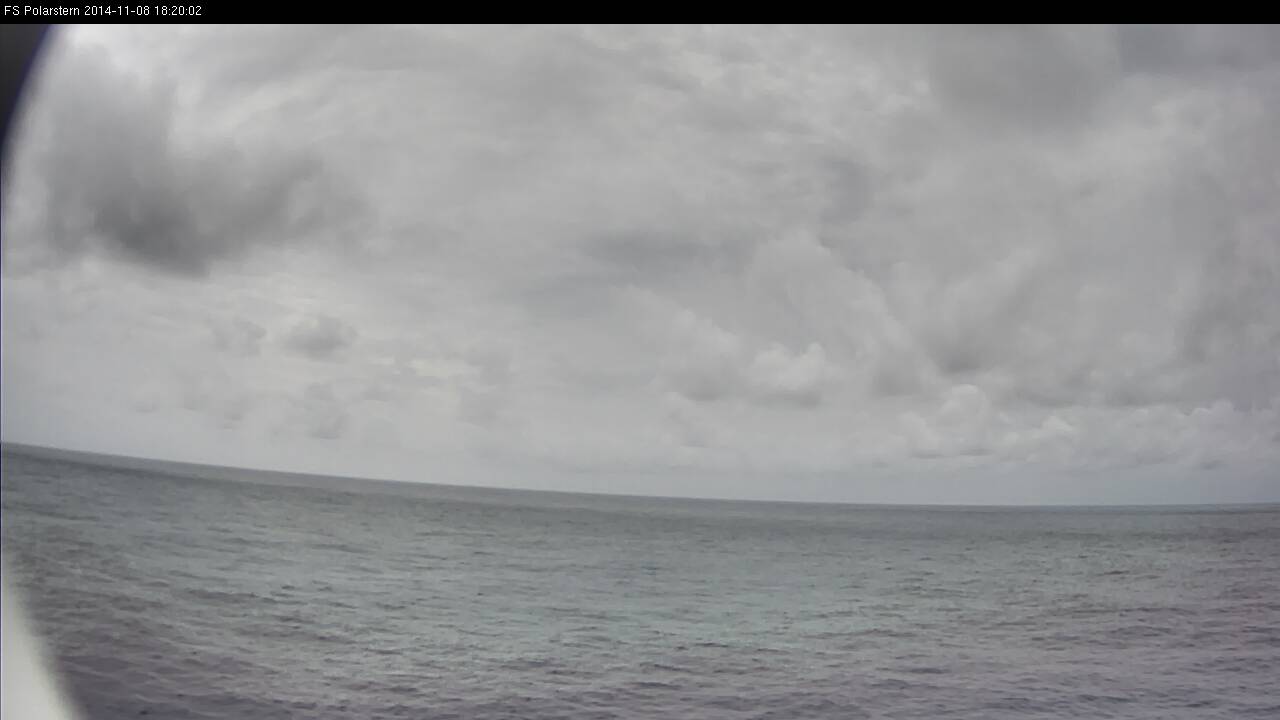
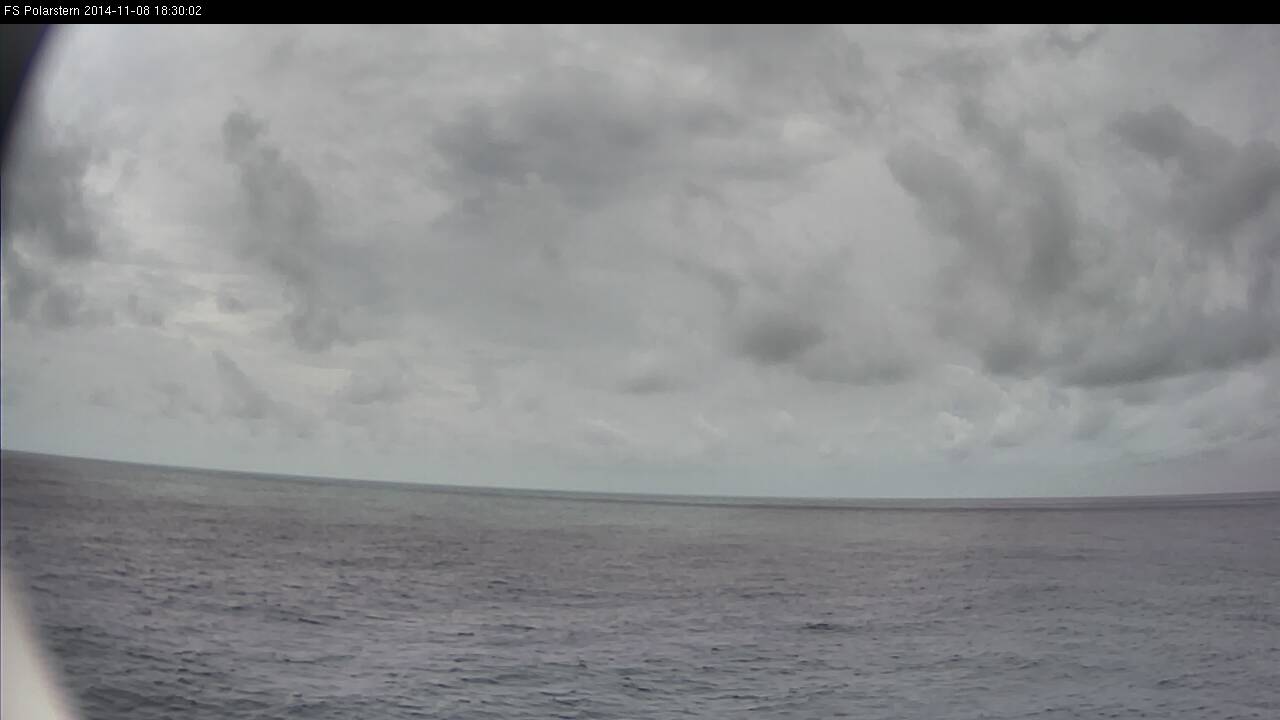
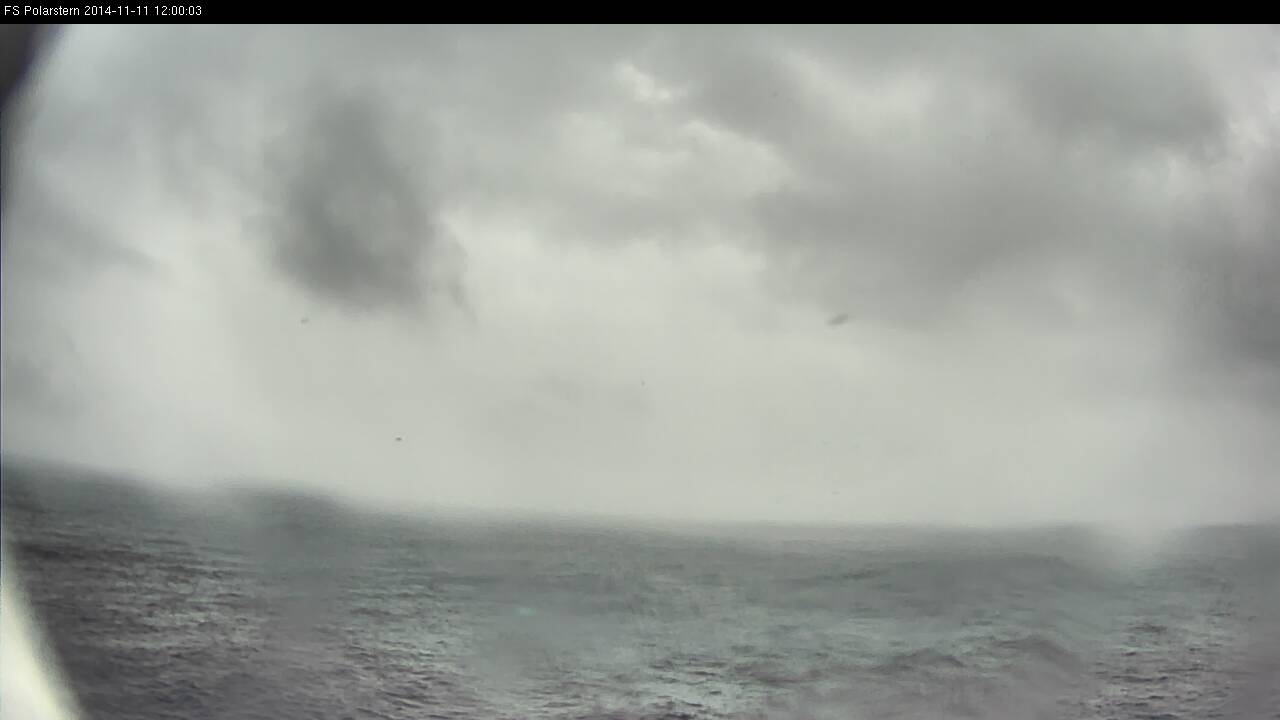
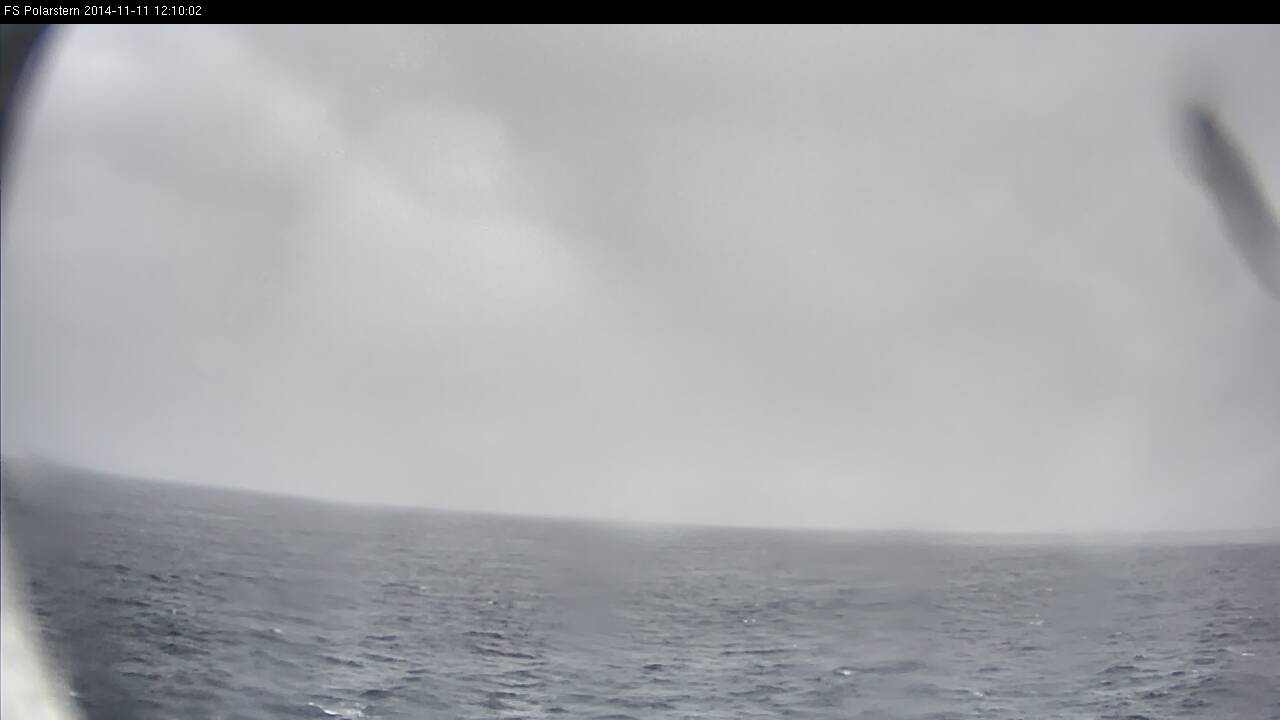
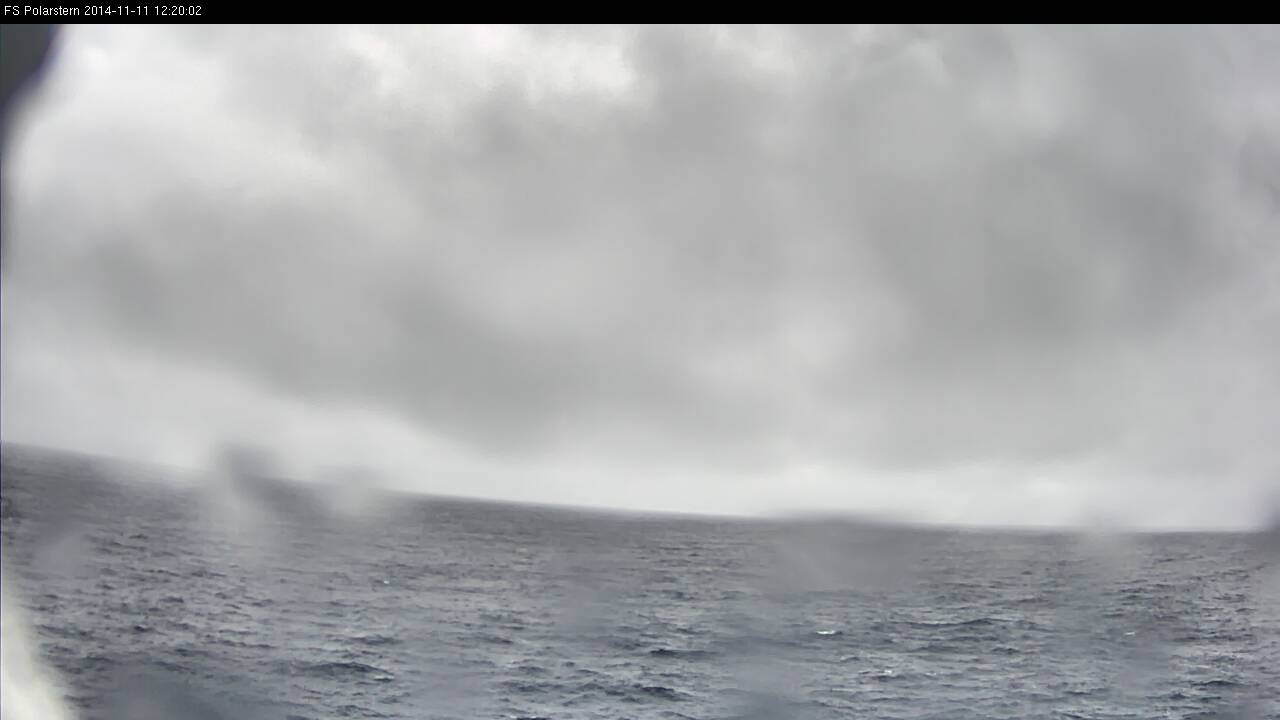
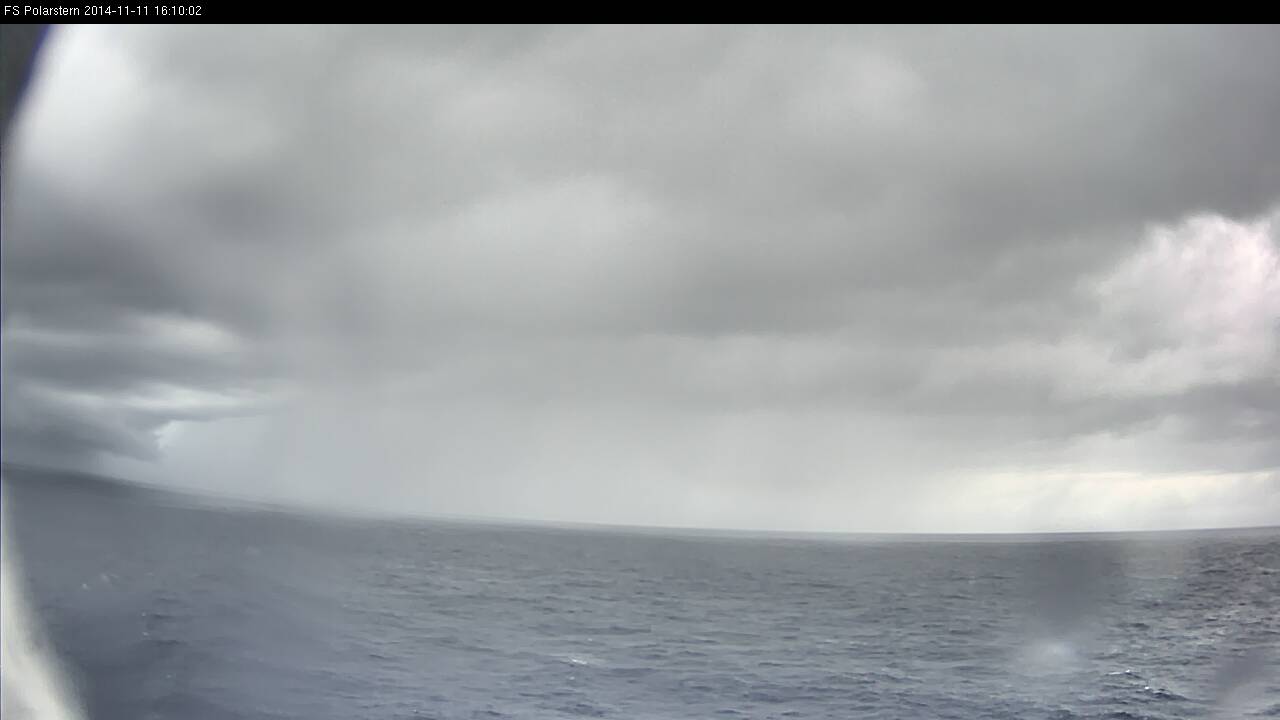
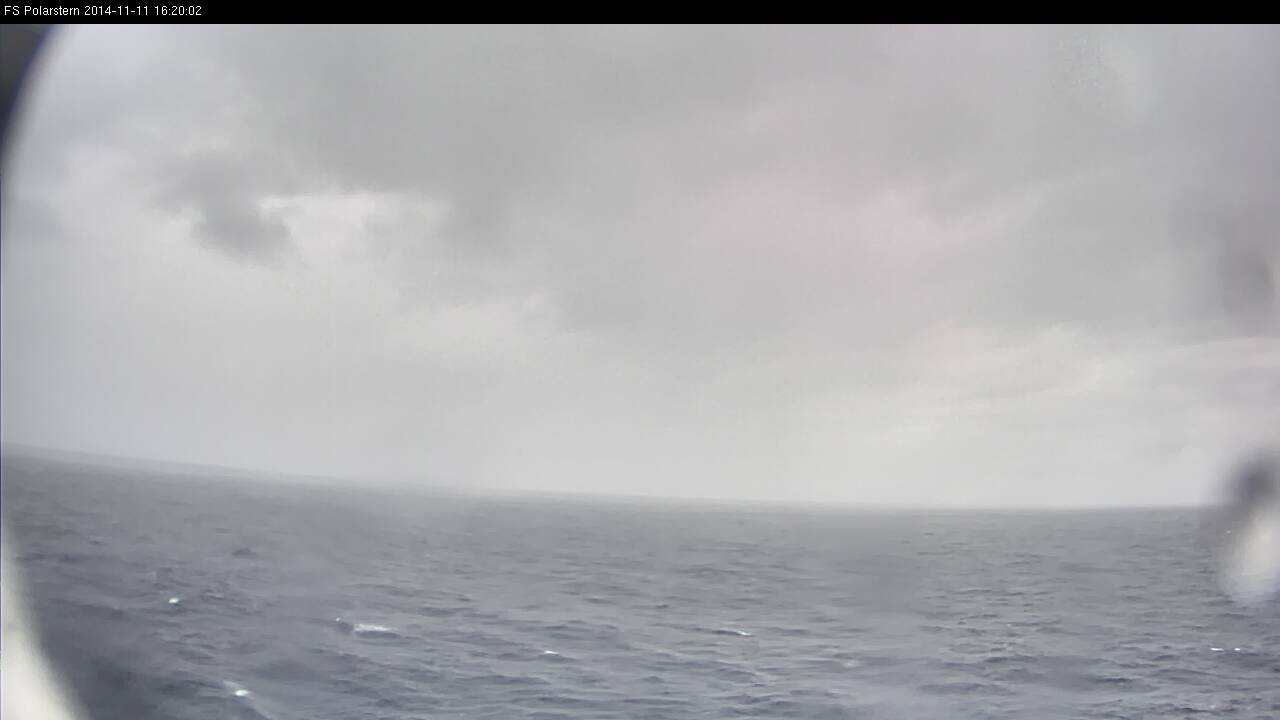
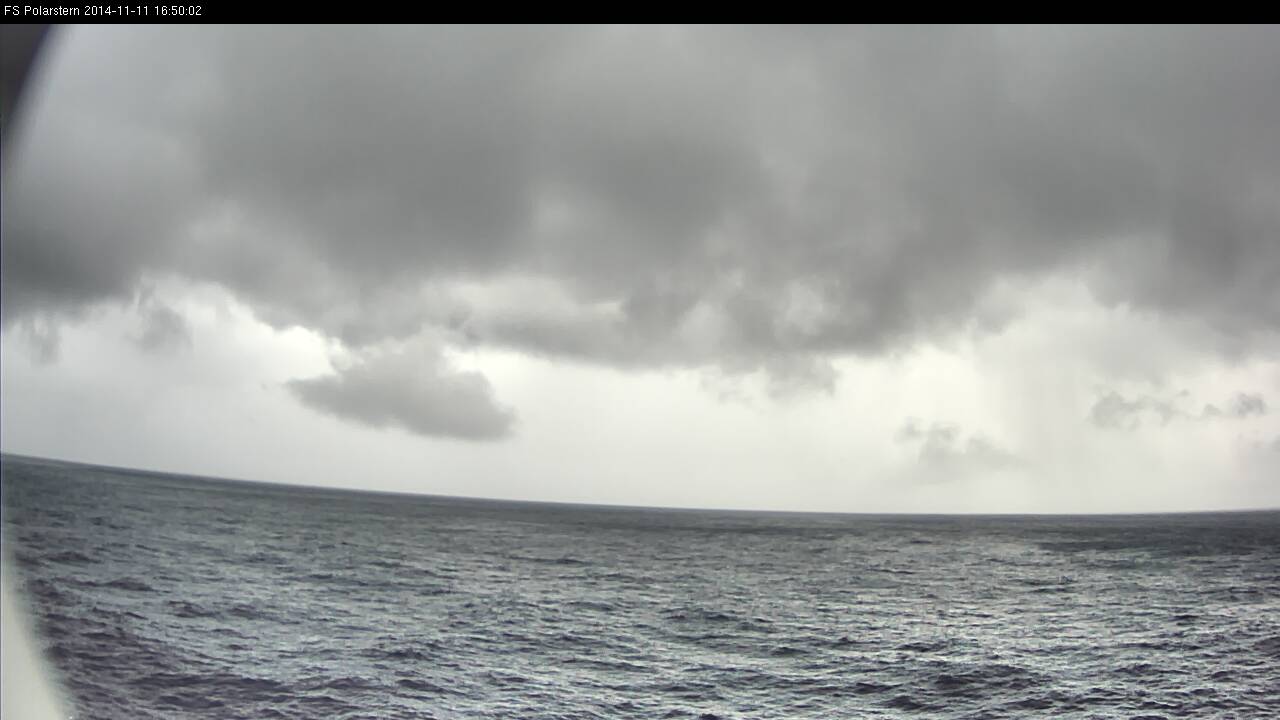
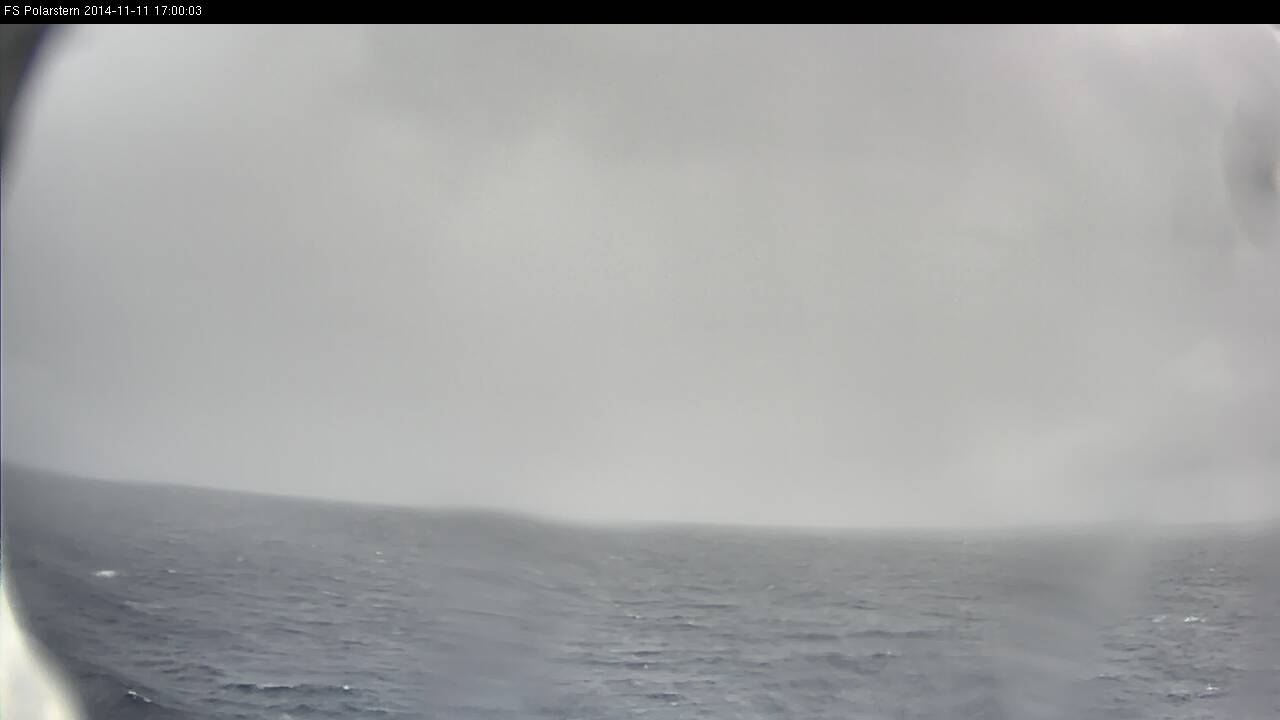
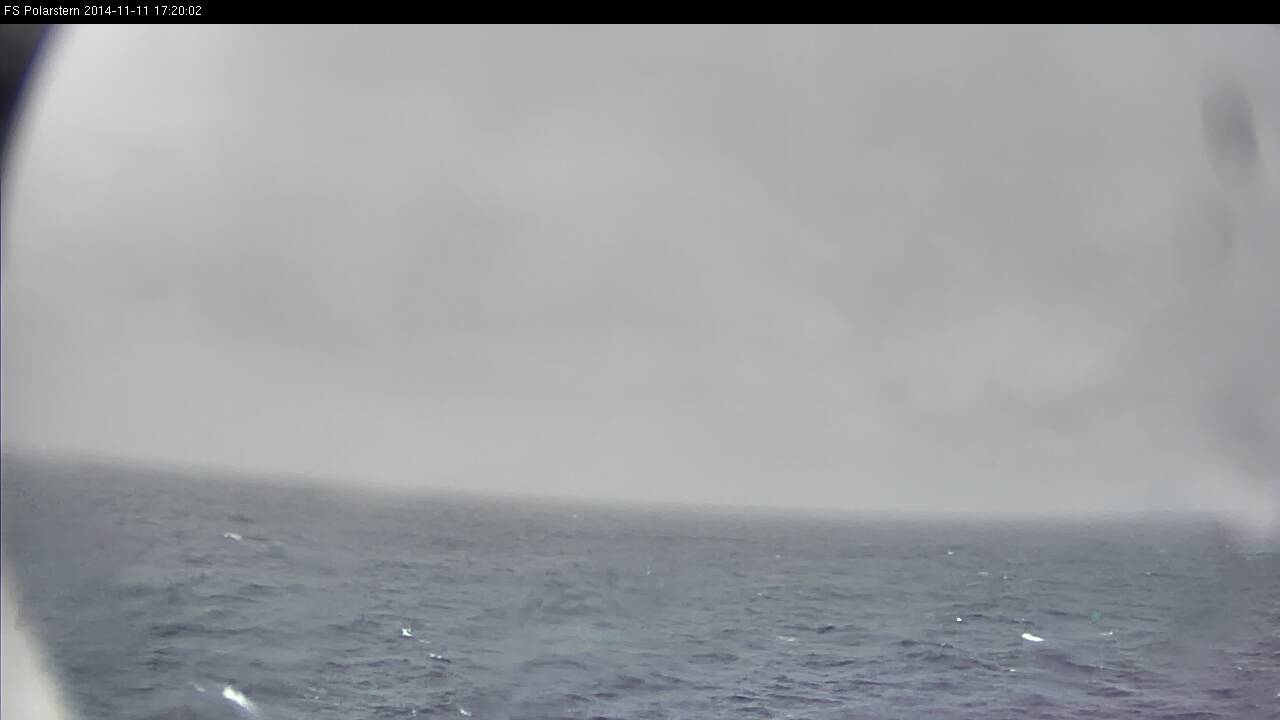
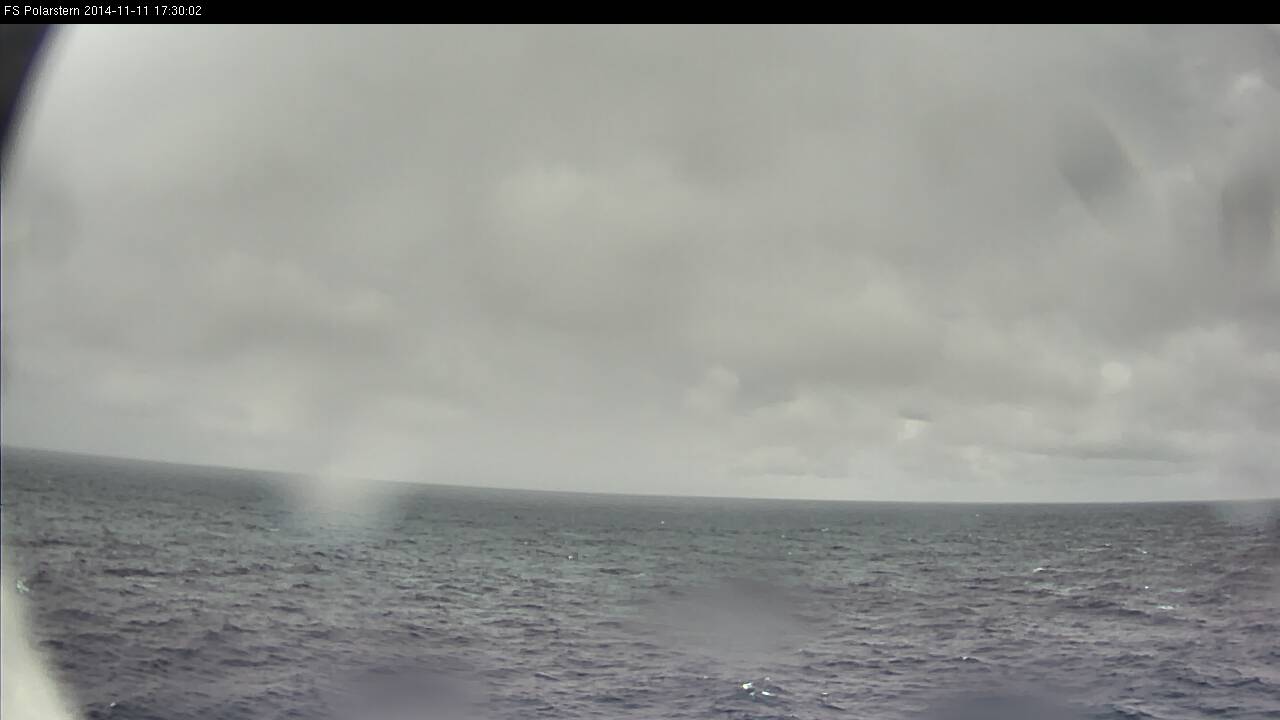
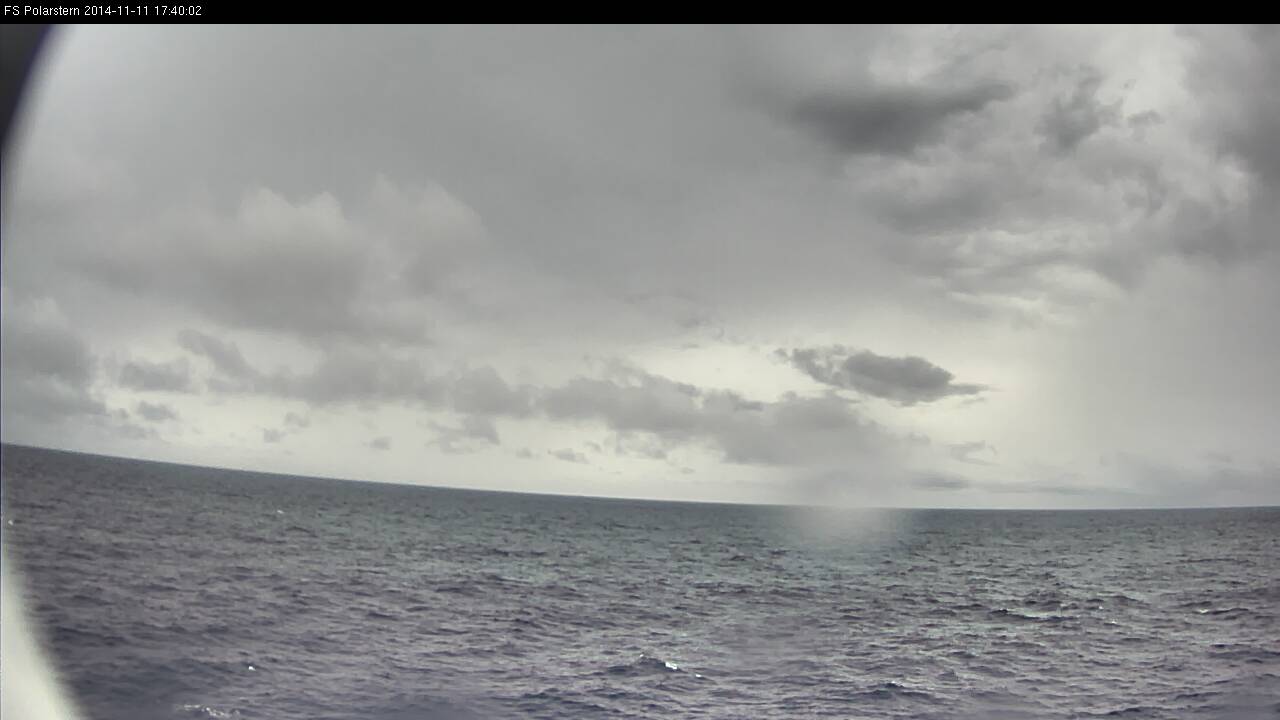
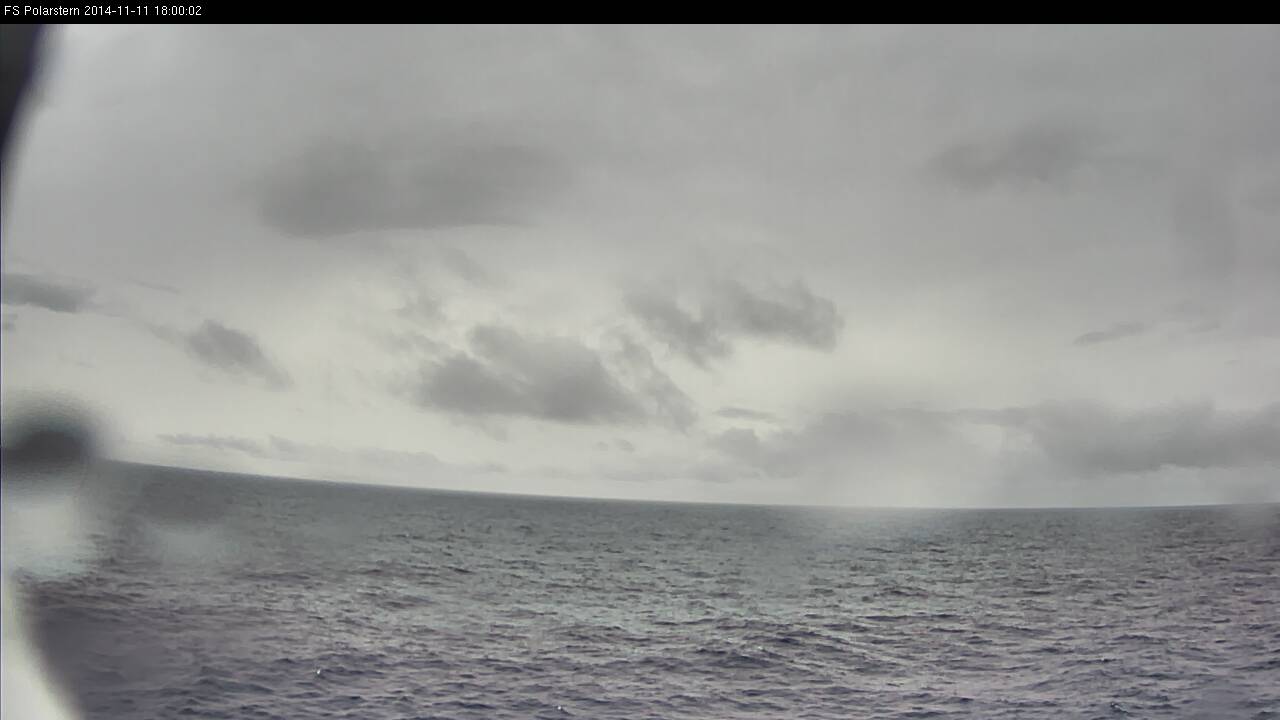
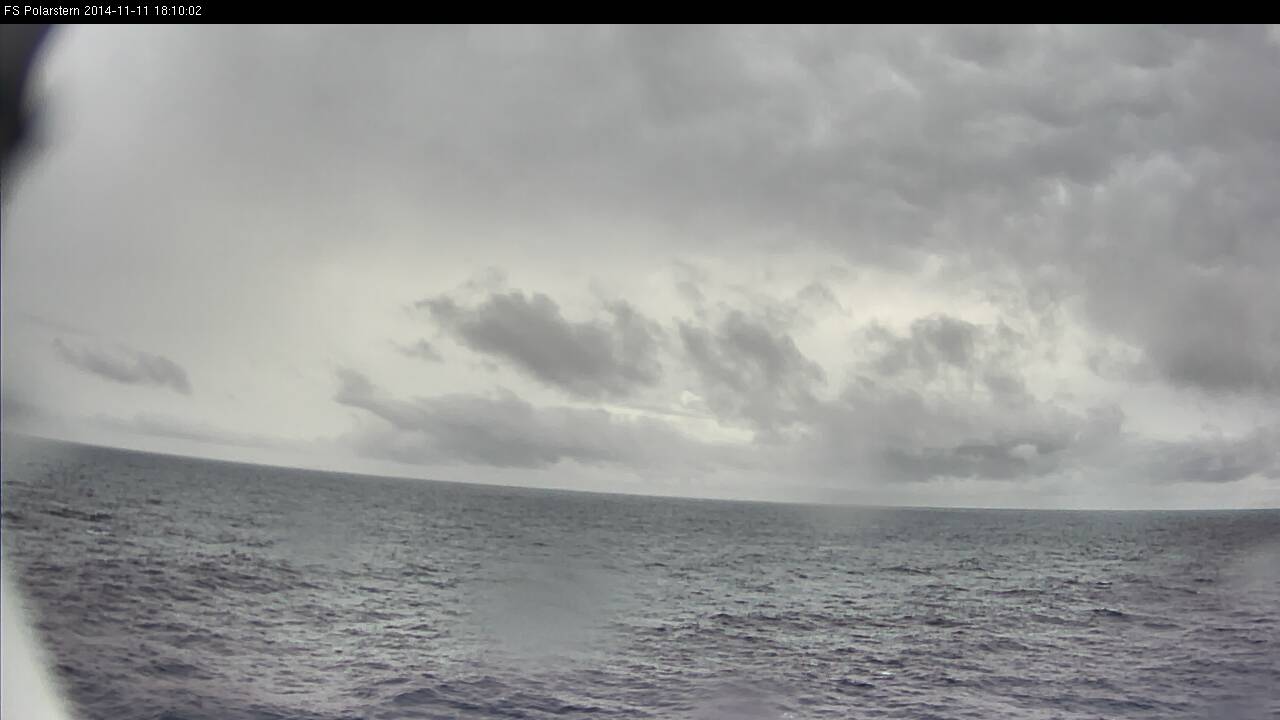
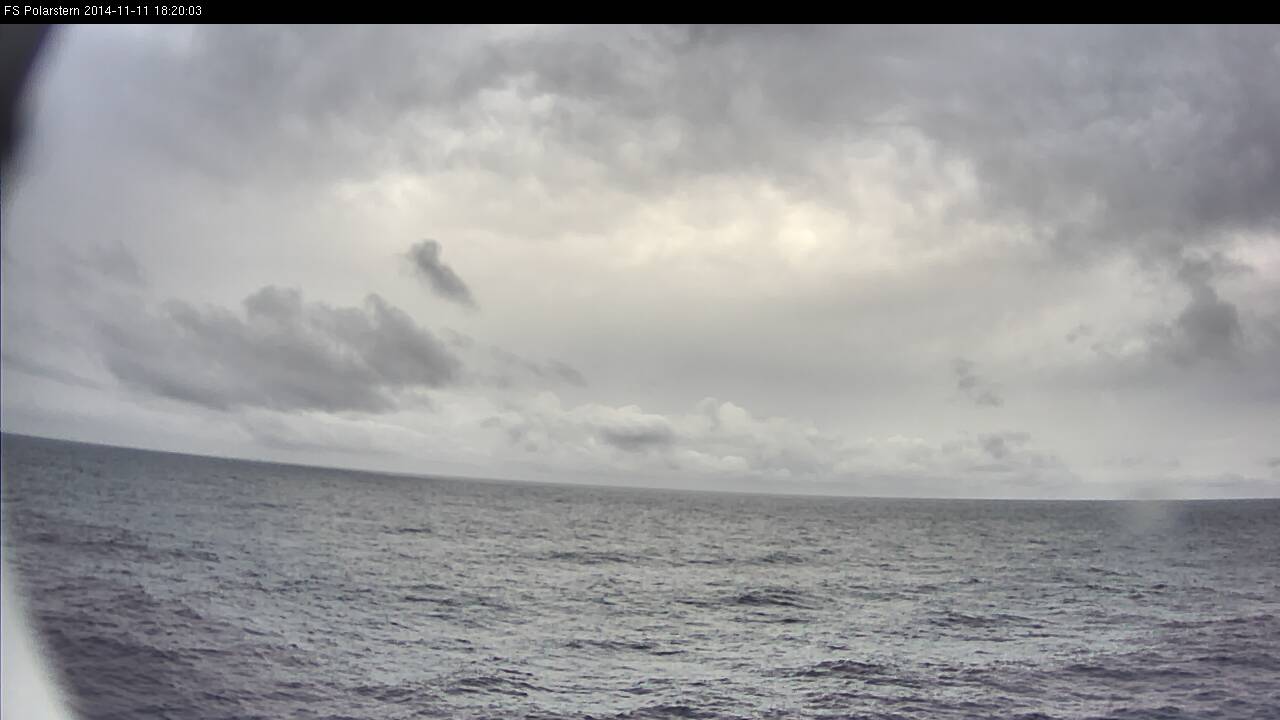
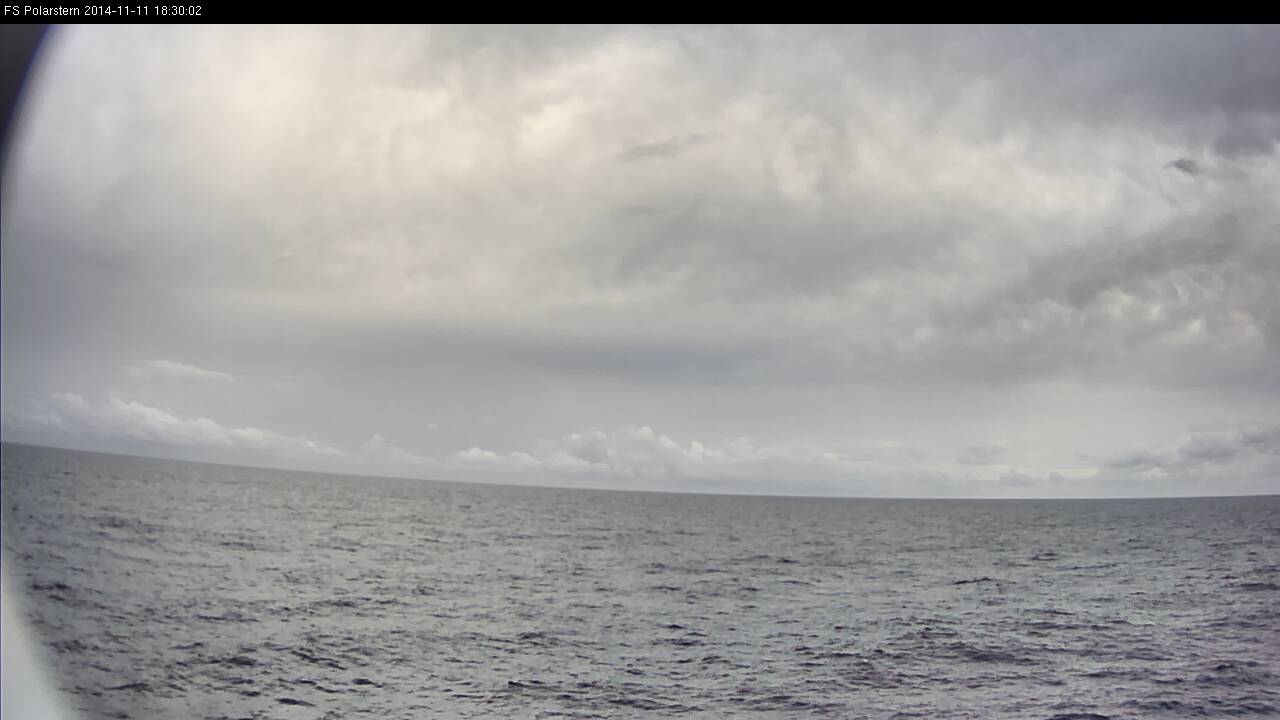
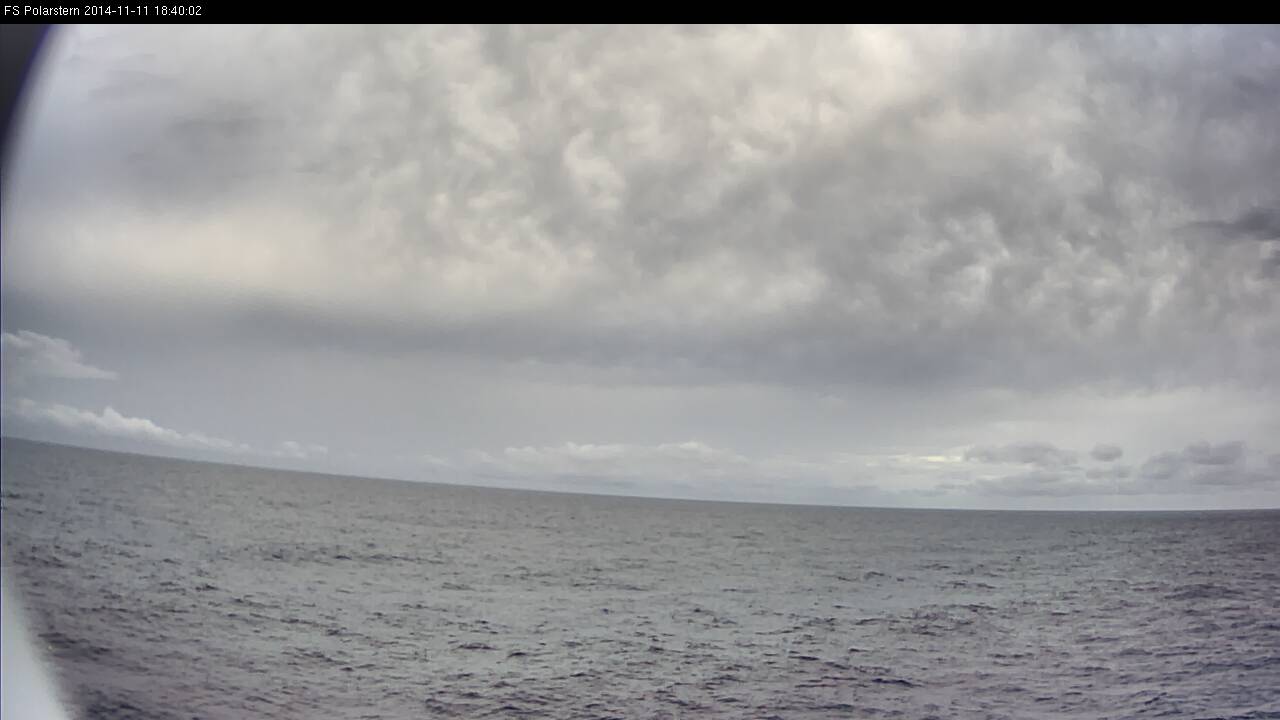
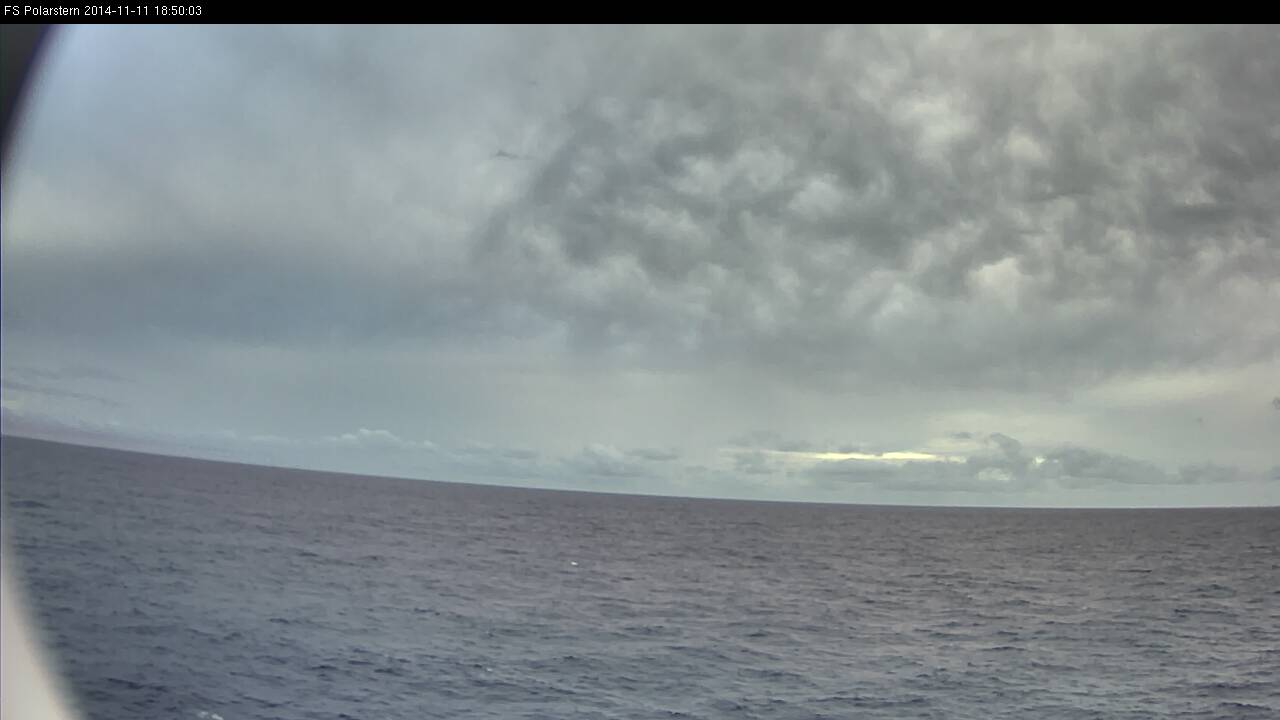
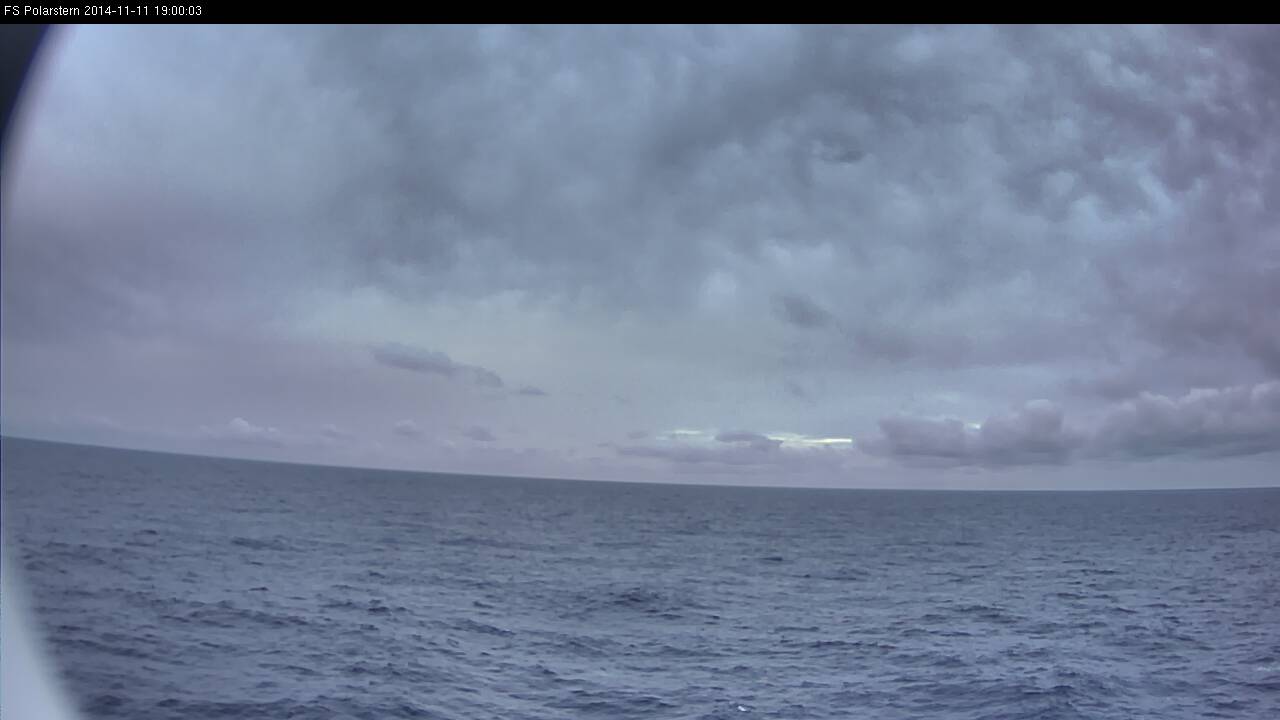
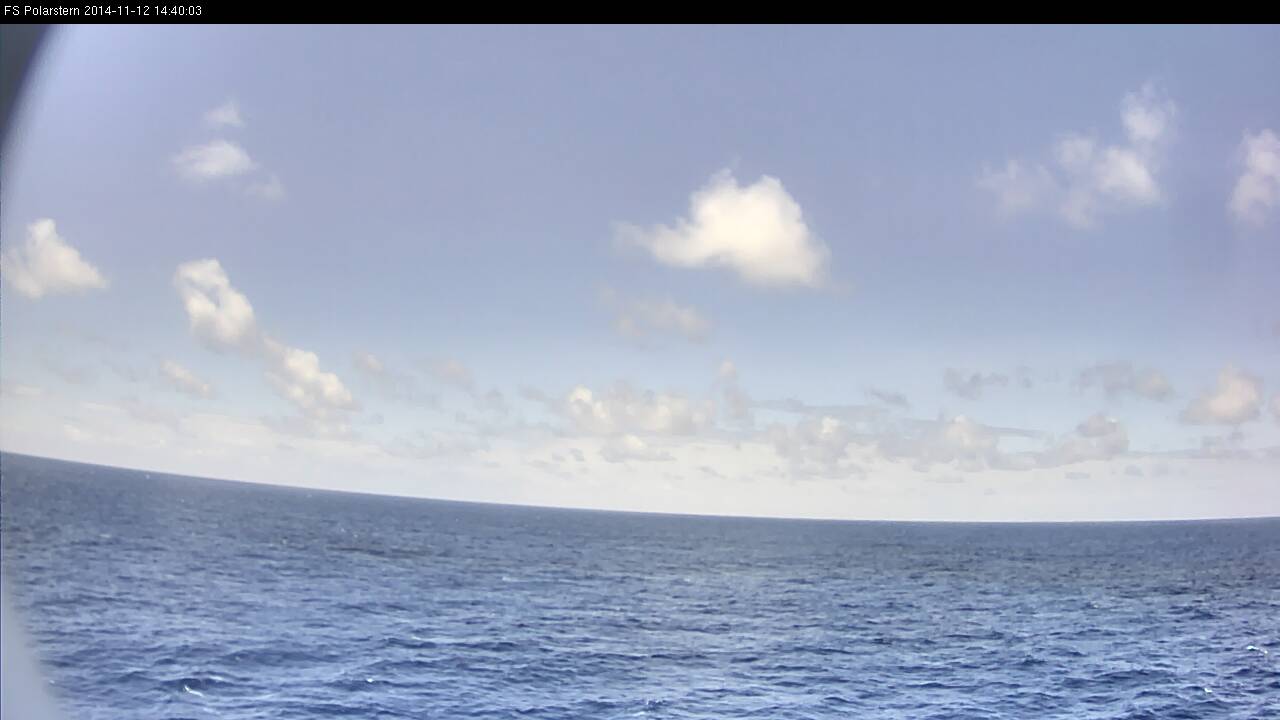
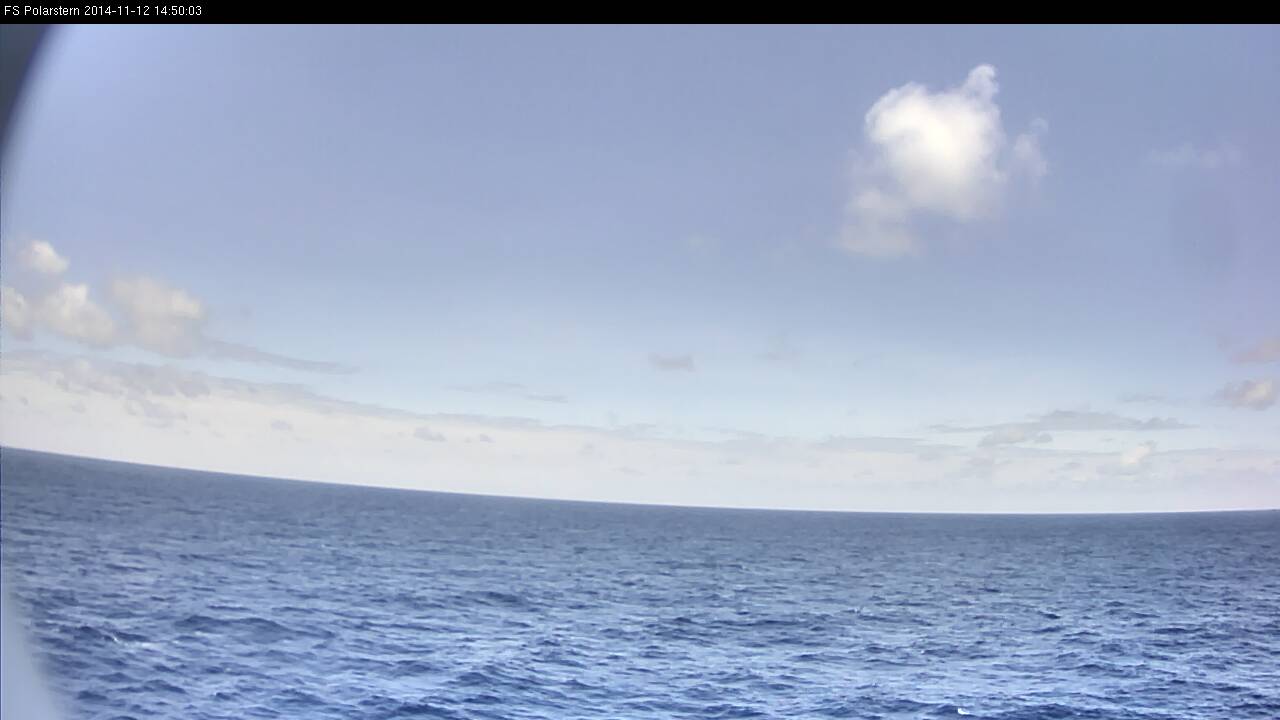
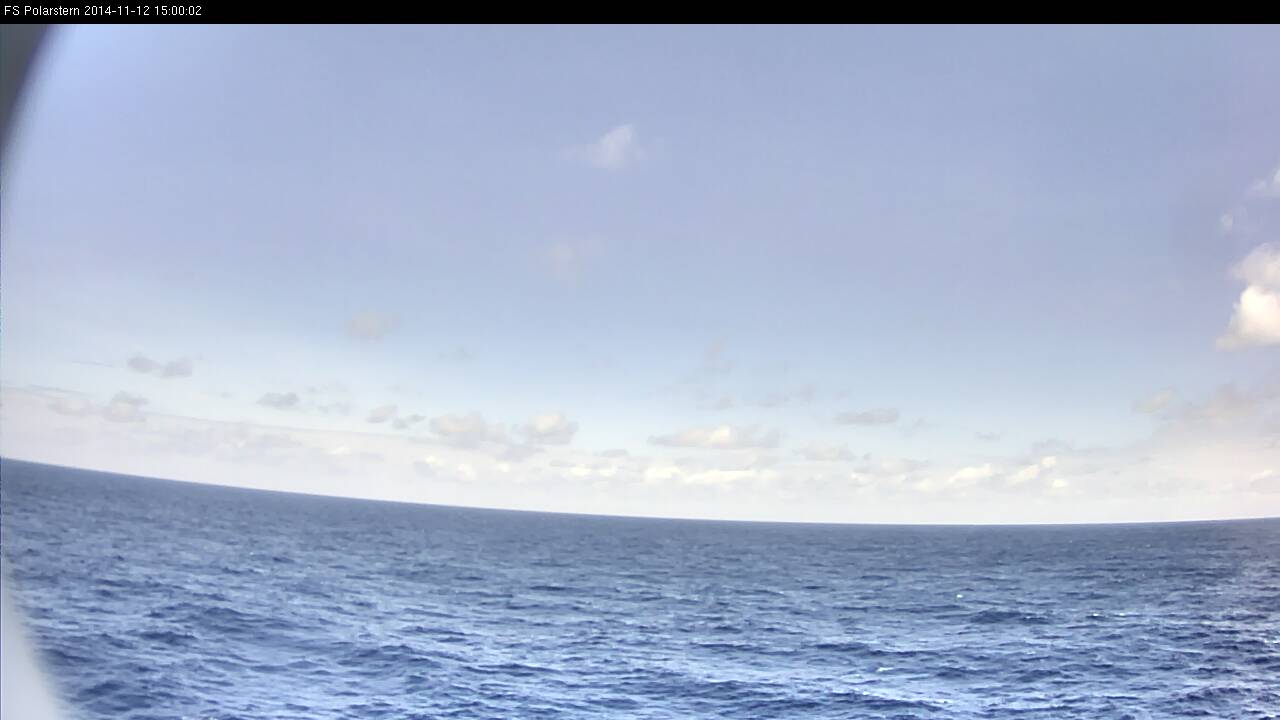
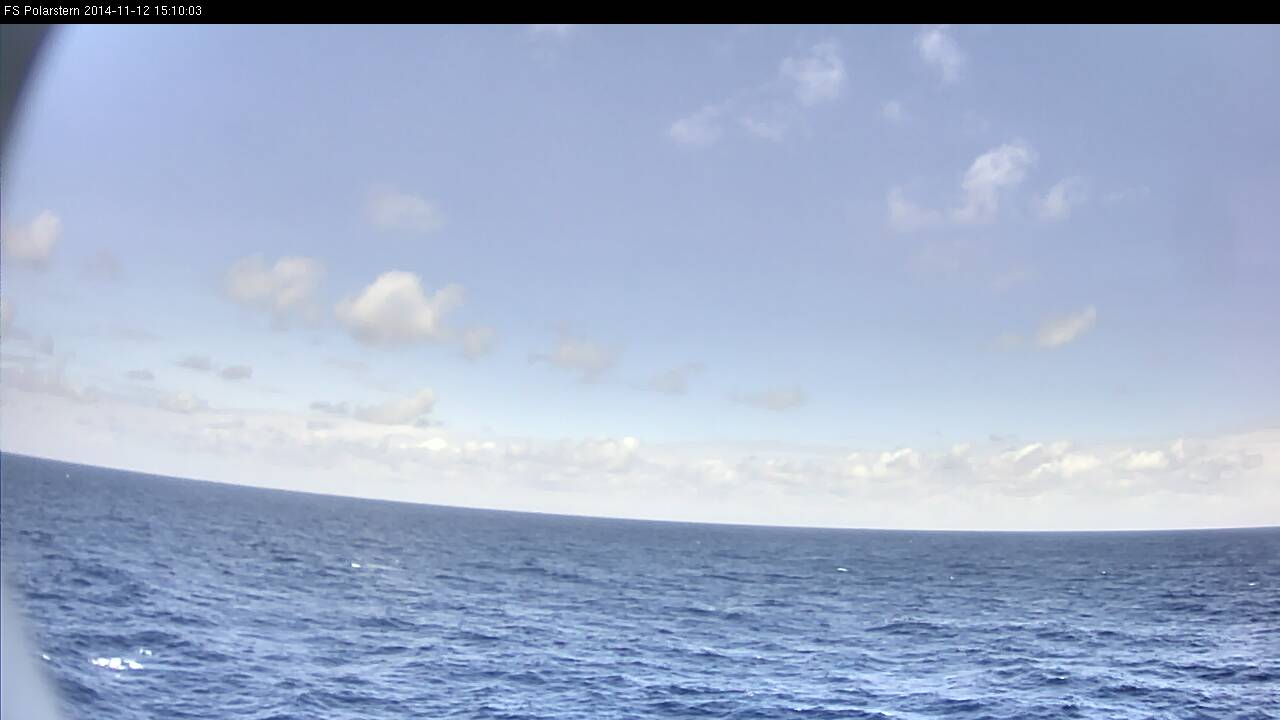
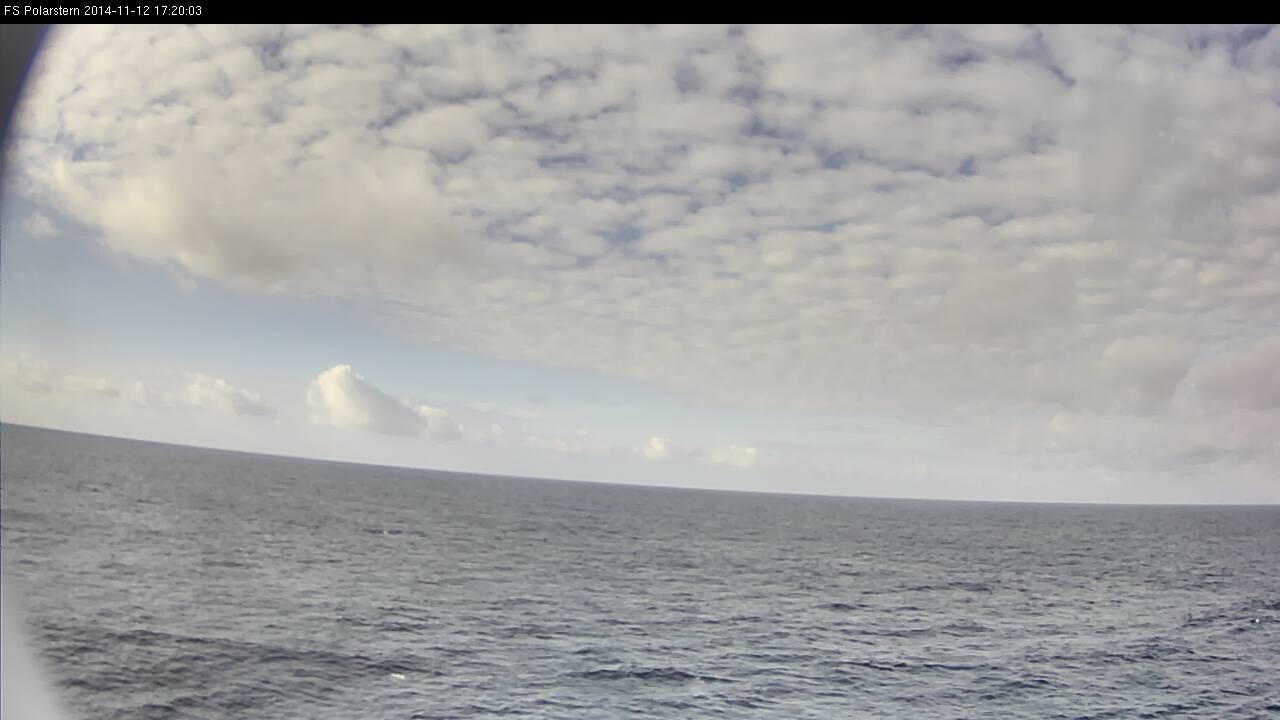
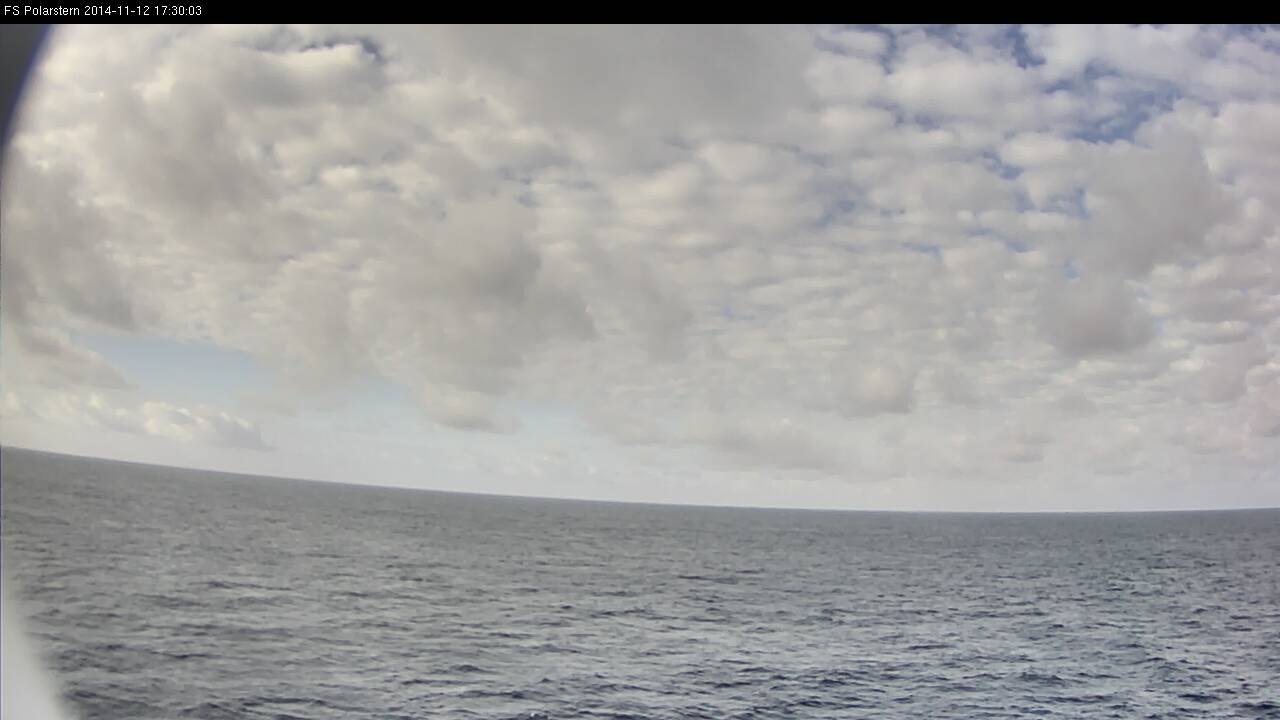
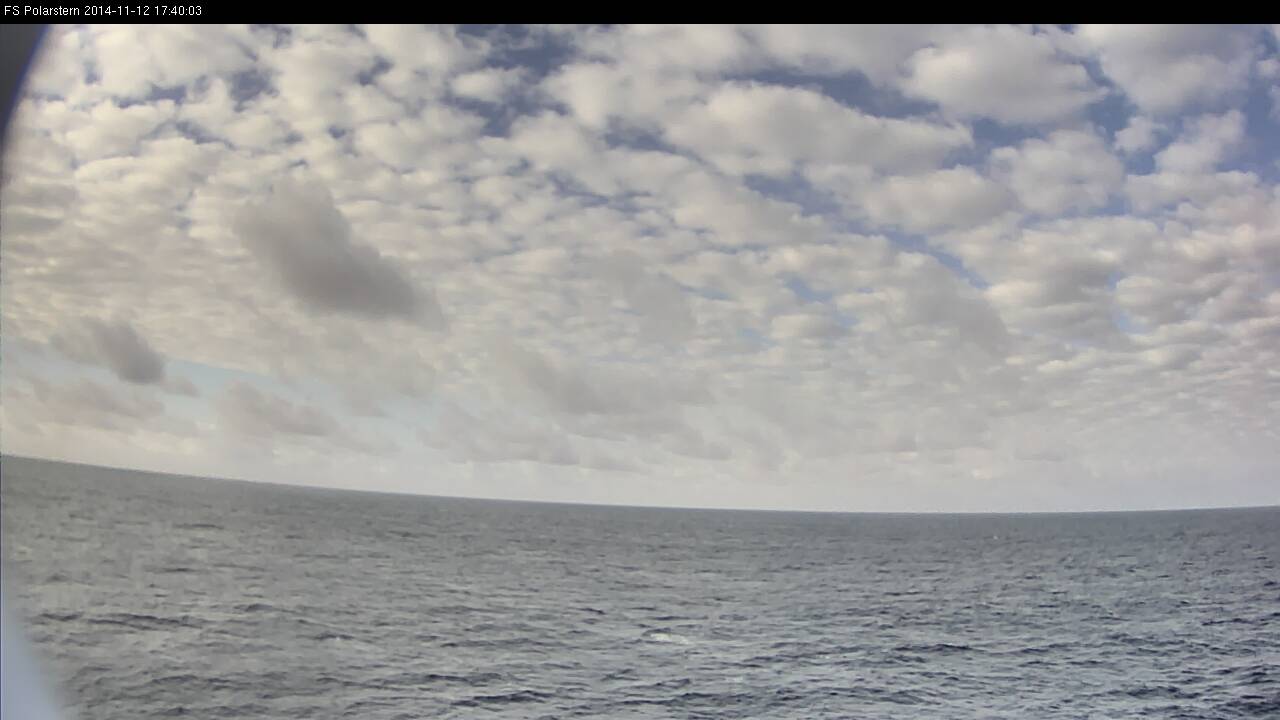
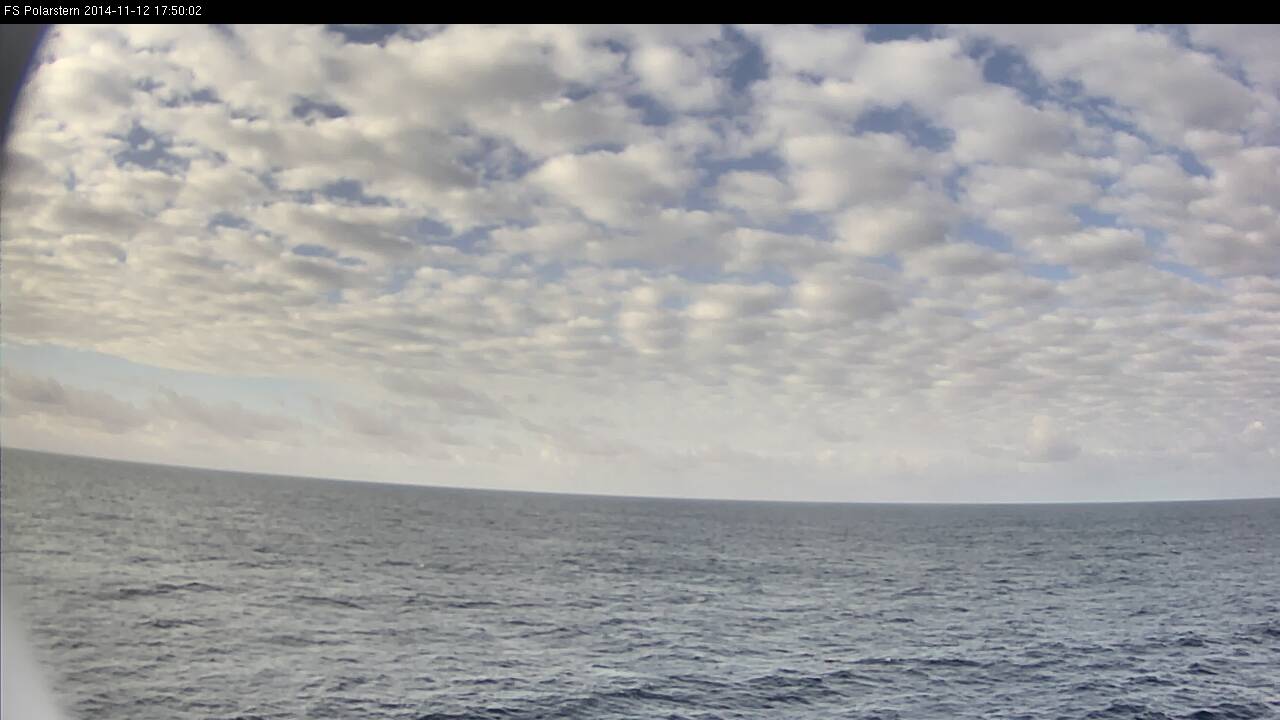
This loop shows all daytime webcam images inside of the ITCZ on 11 Nov 2014 between 07:00 UTC and 19:40 UTC.
Loop 6: Note - click on the loop to go through individual images
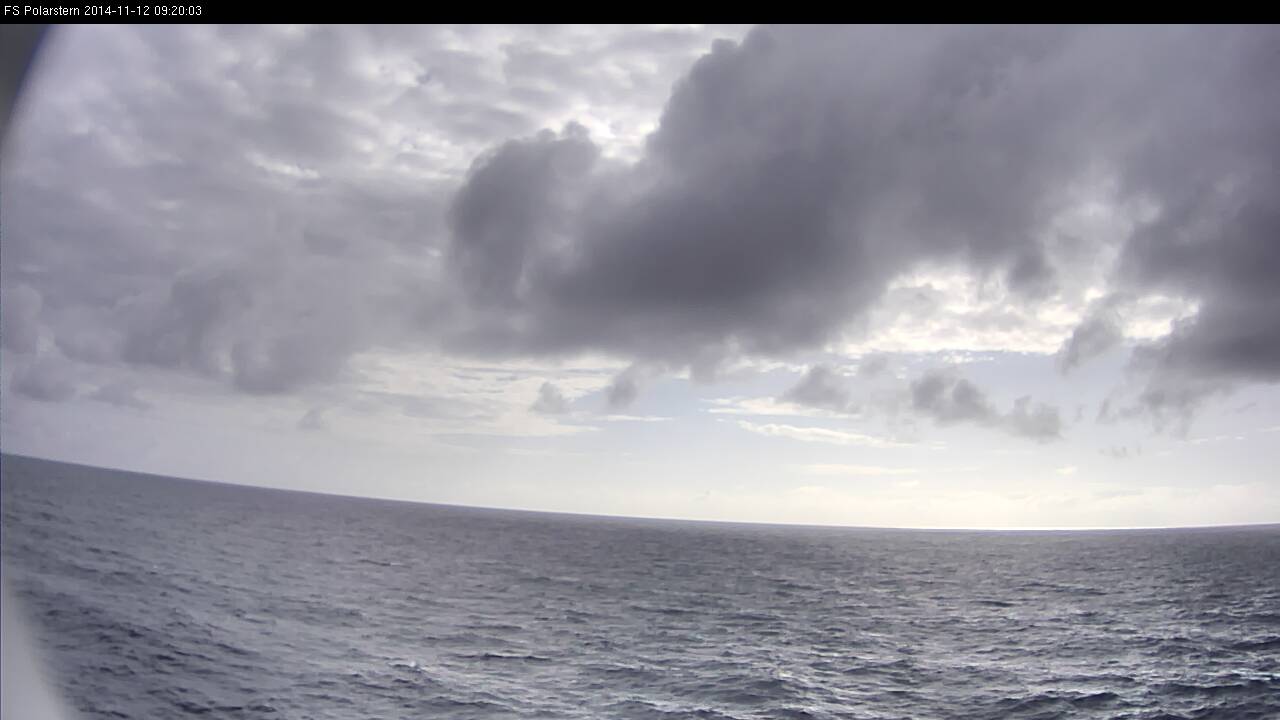
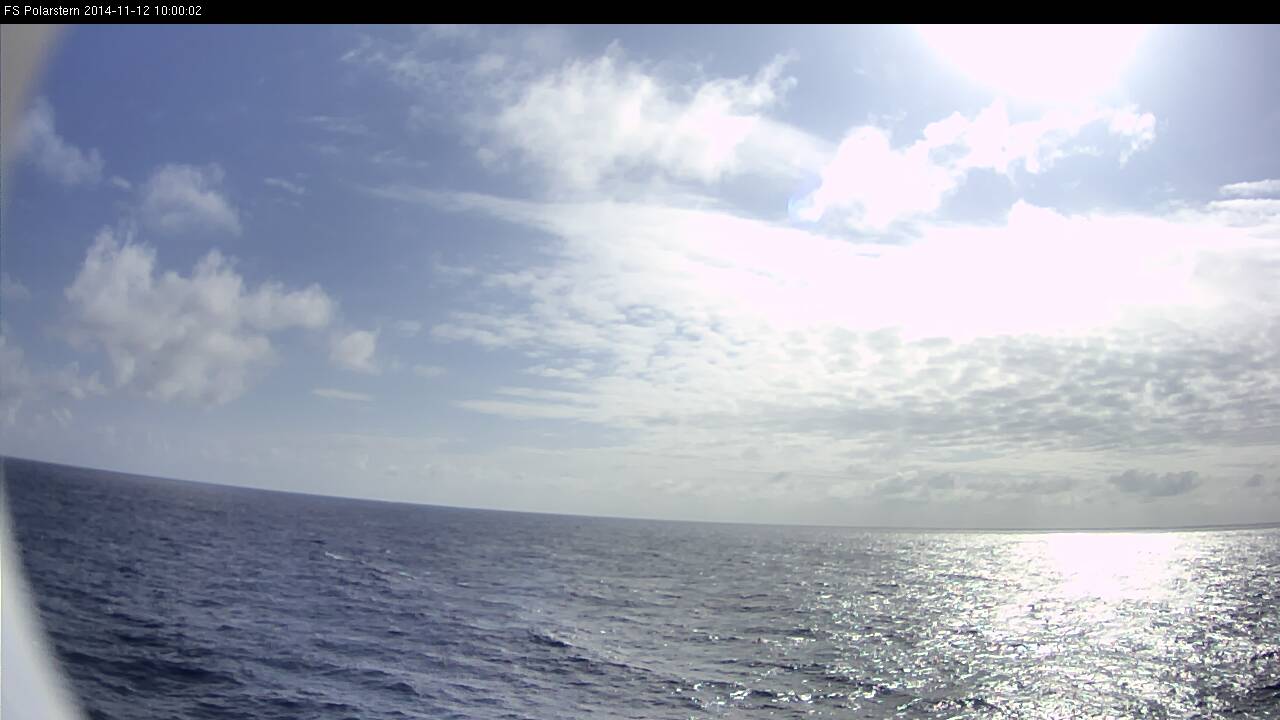
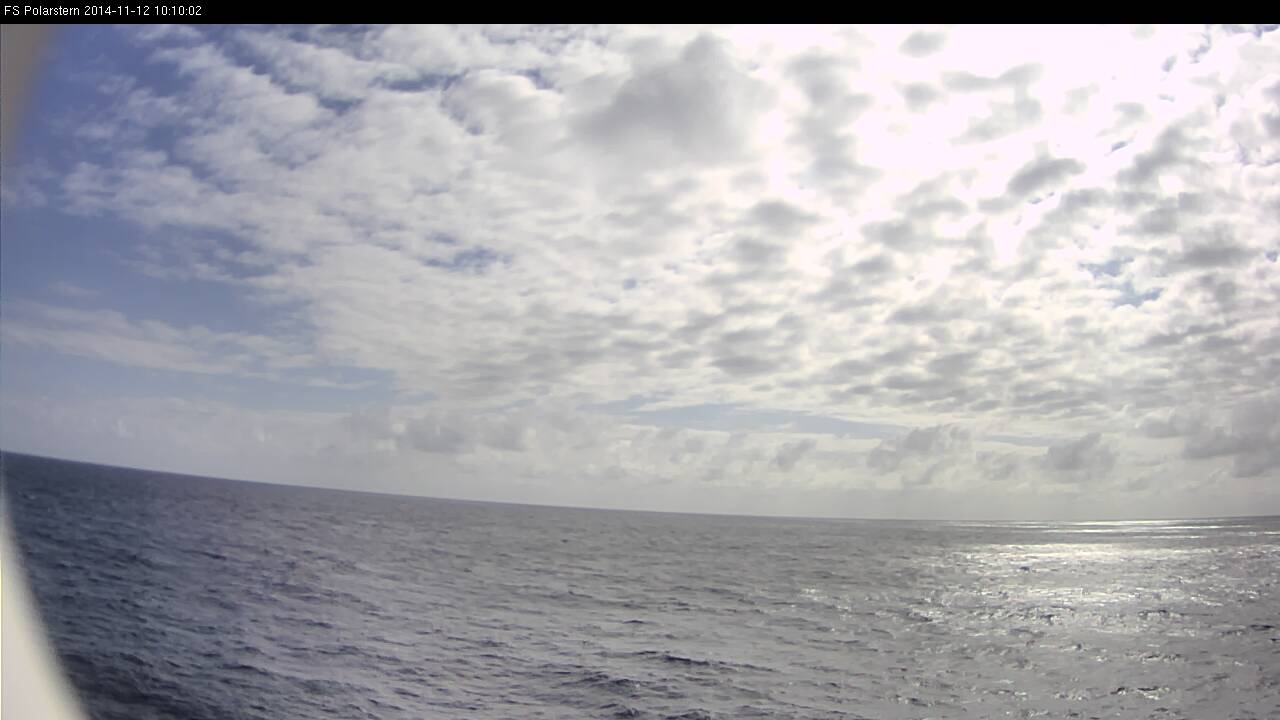
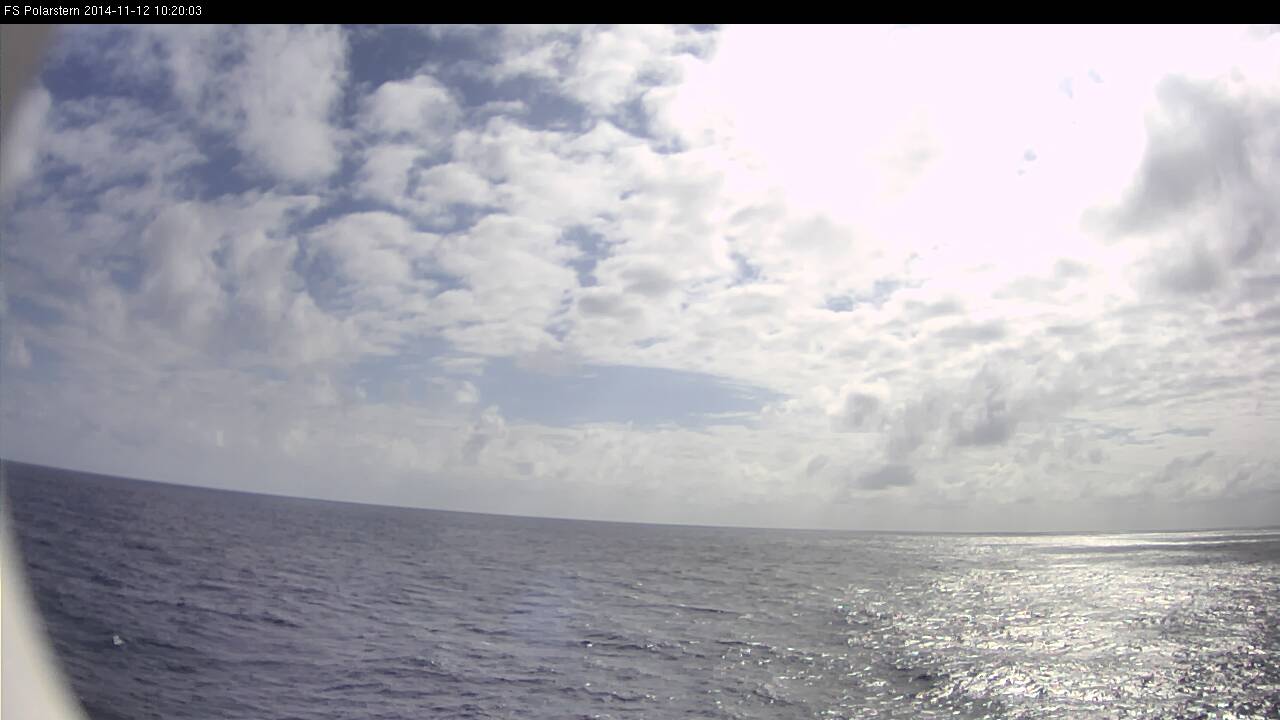
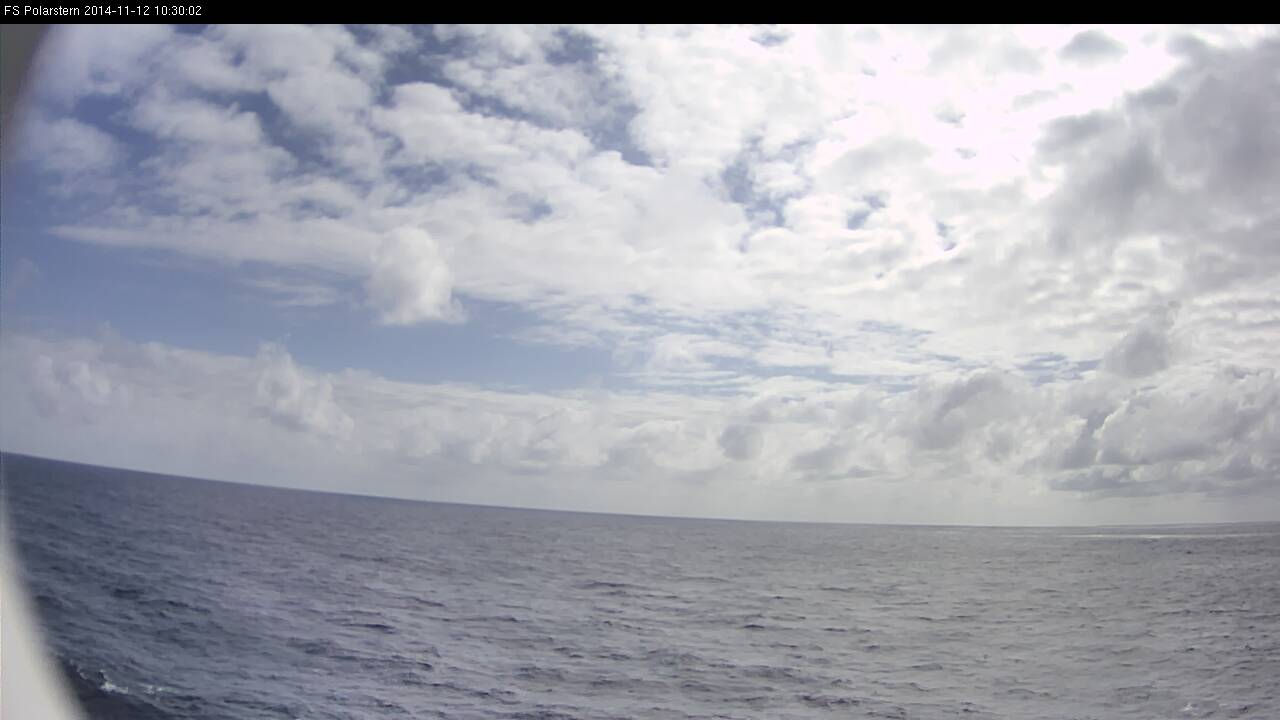
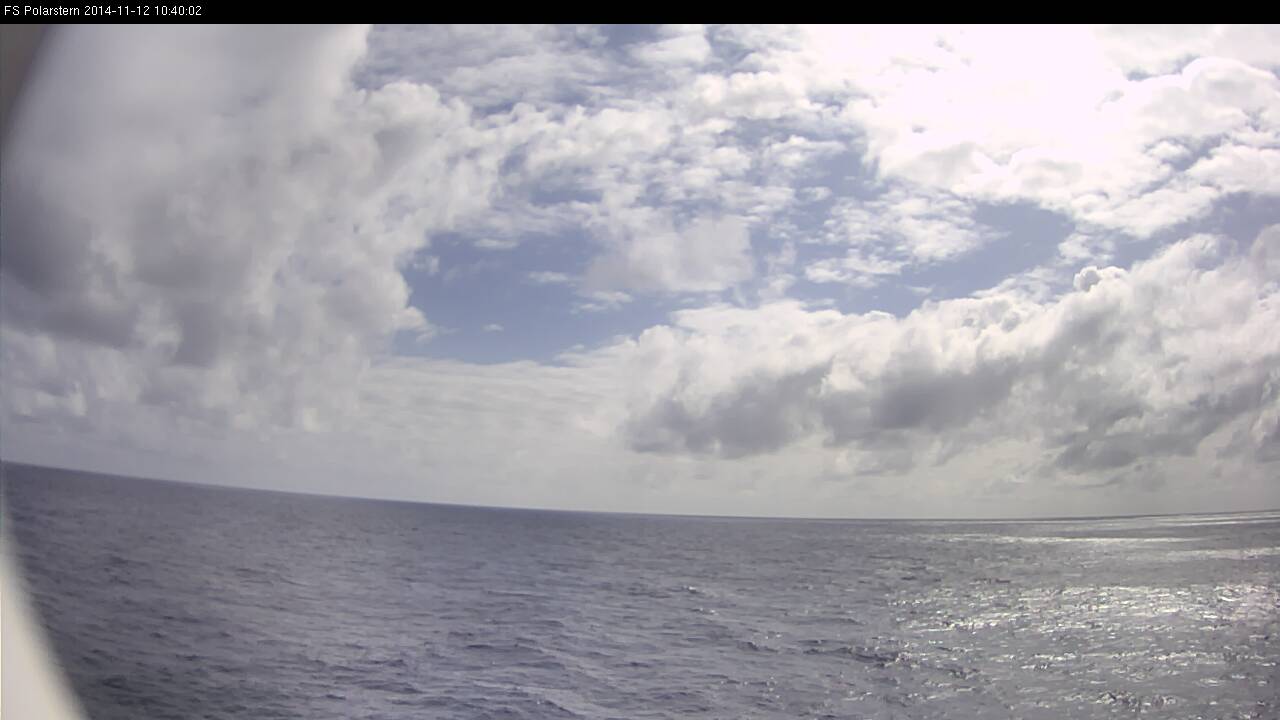
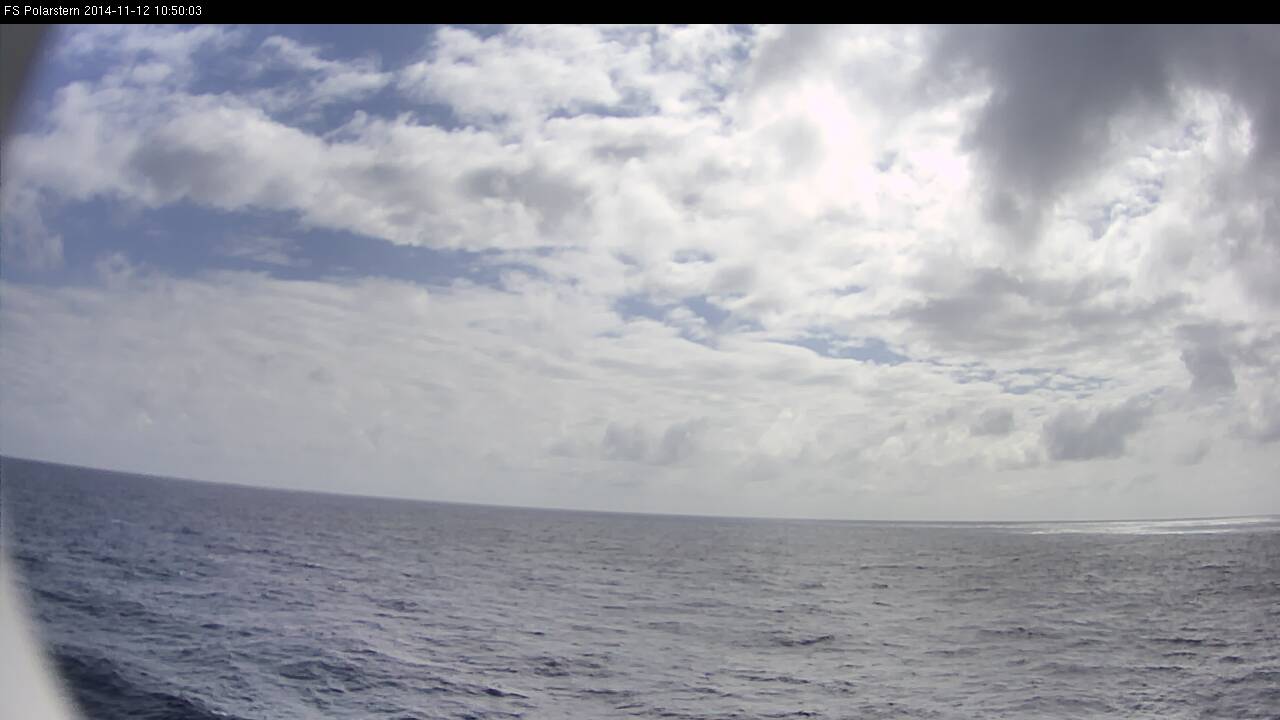
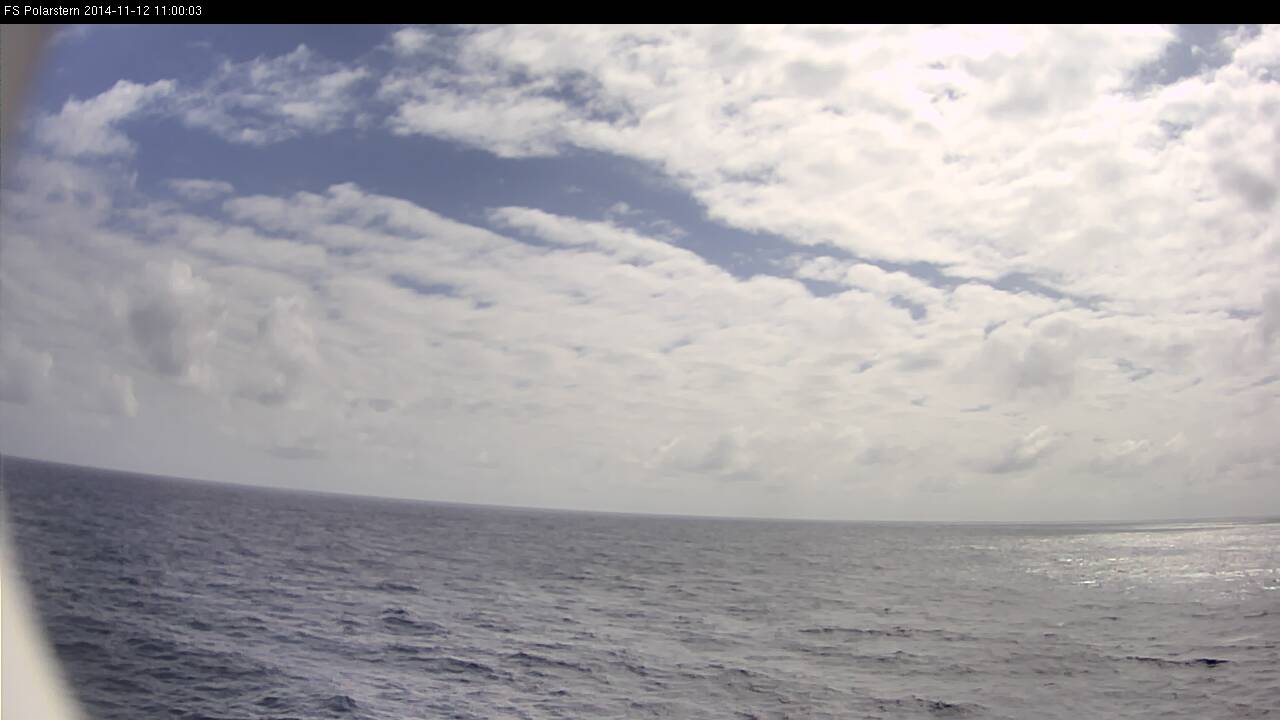
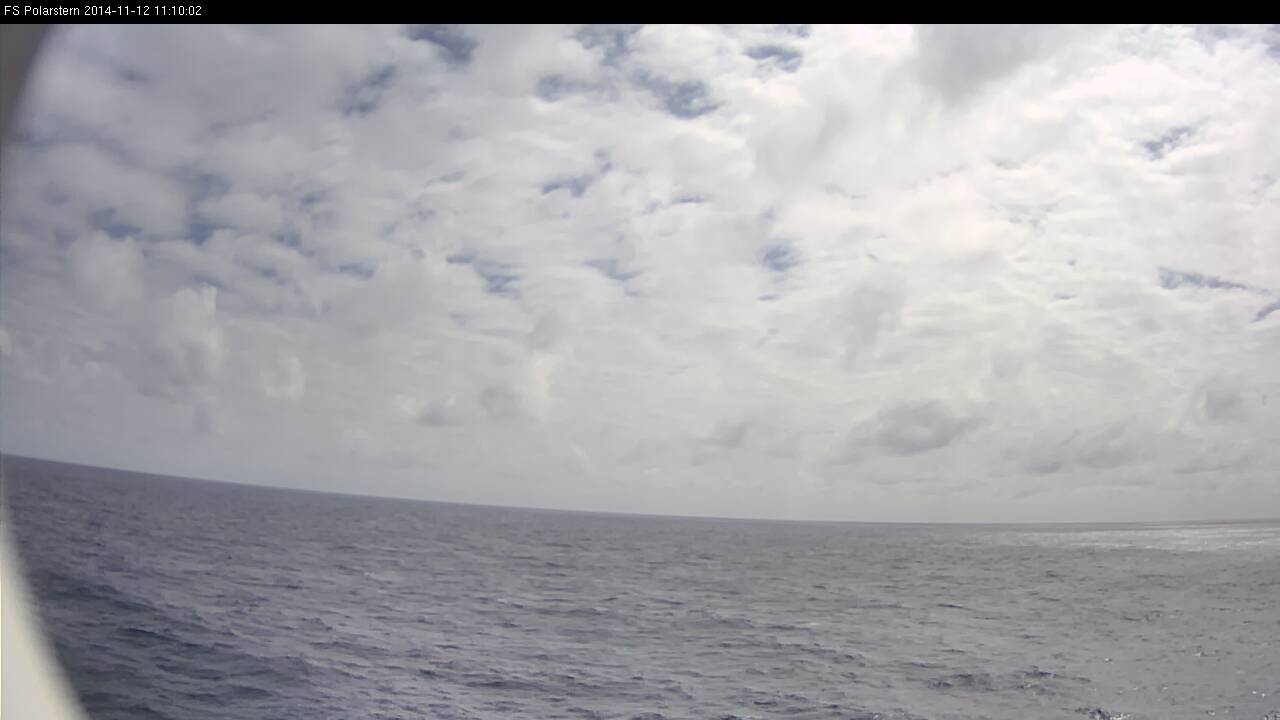
Weather situation on 12 Nov 2014
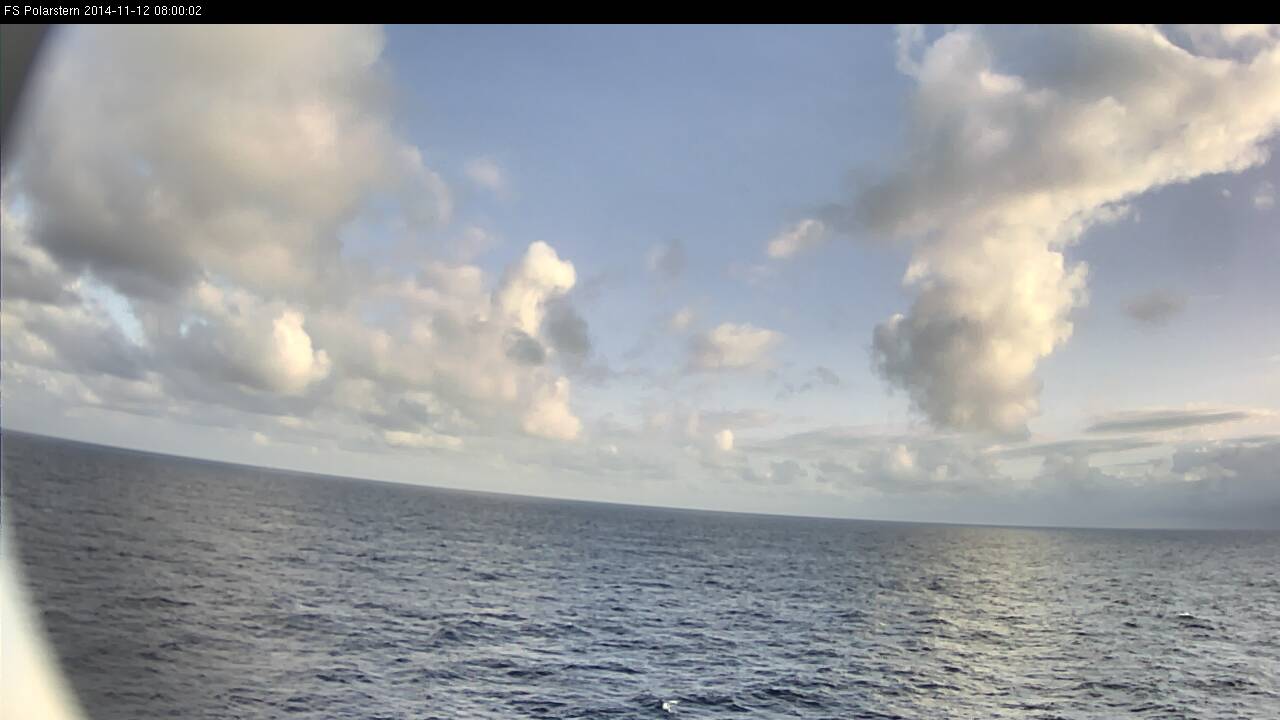
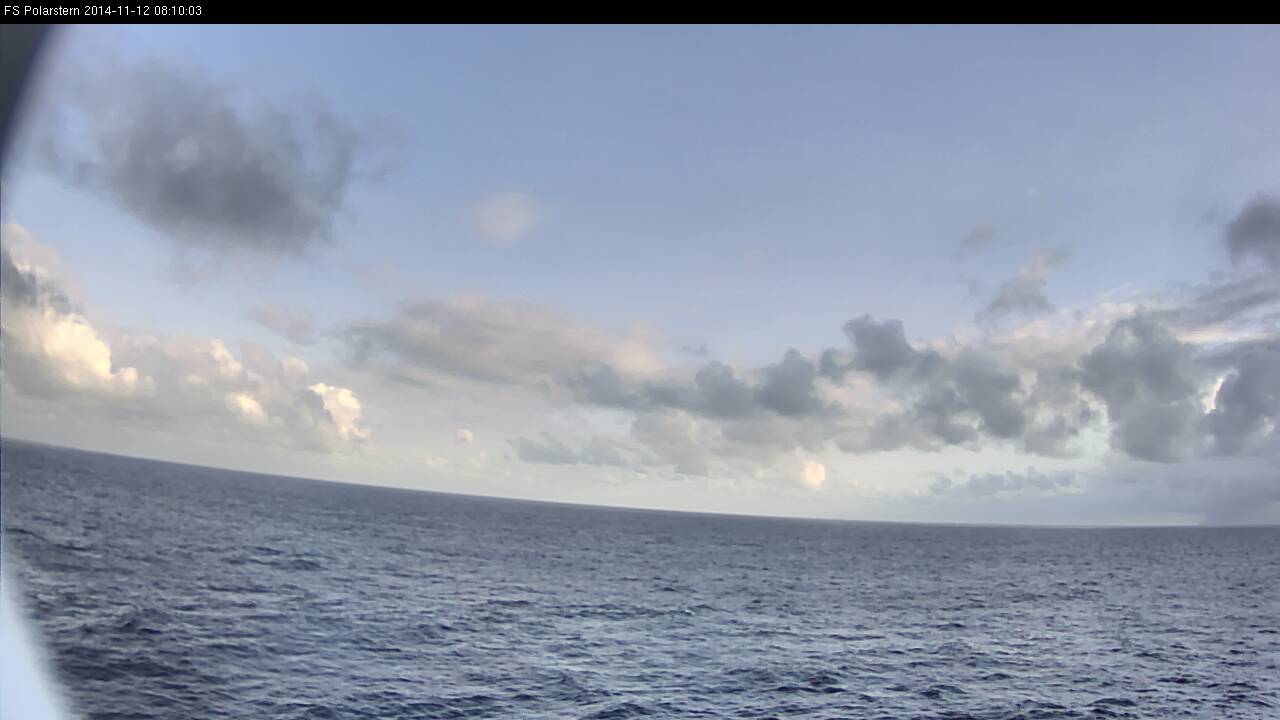
The satellite images show the curvature of the ITCZ very clearly. The Polarstern is now sailing in the southern part of the ITCZ and thunderstorms are still possible. During the day the vessel will reach the southeasterly trade winds with a decreasing probability of showers. The Dust RGB's dark bluish color implies that the airmass is very moist in the lower layers of the troposphere.
See the SYNOP report and the recorded dewpoint at 12 UTC of 23,0°C and an air temperature of 26,8°C.
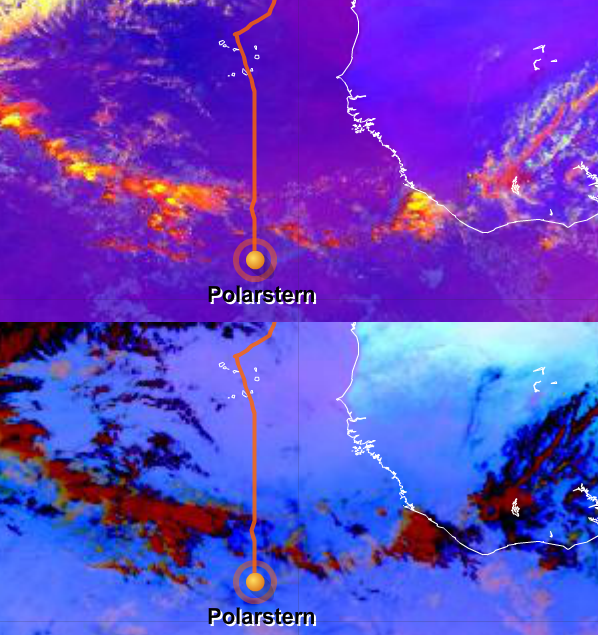
Figure L2-20: 12 Nov 2014, 12:00 UTC. Above: Severe Storms RGB. Below: Dust RGB. Source: EUMeTrain.
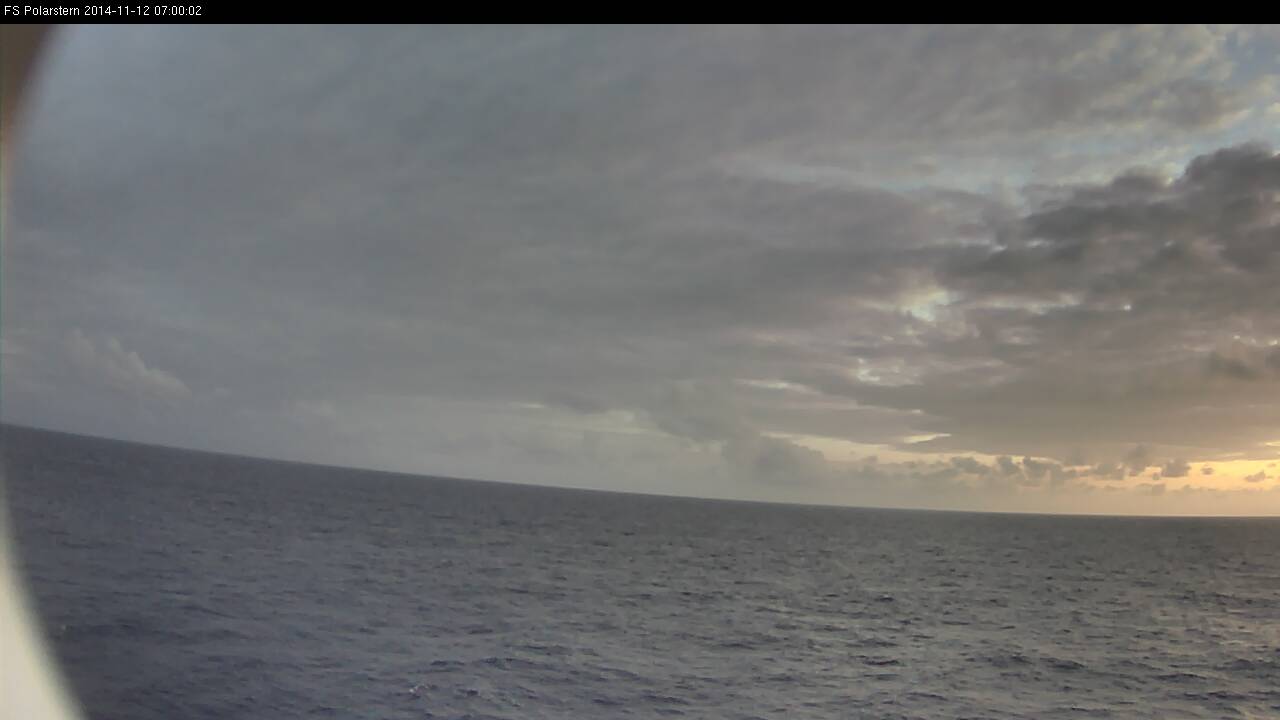
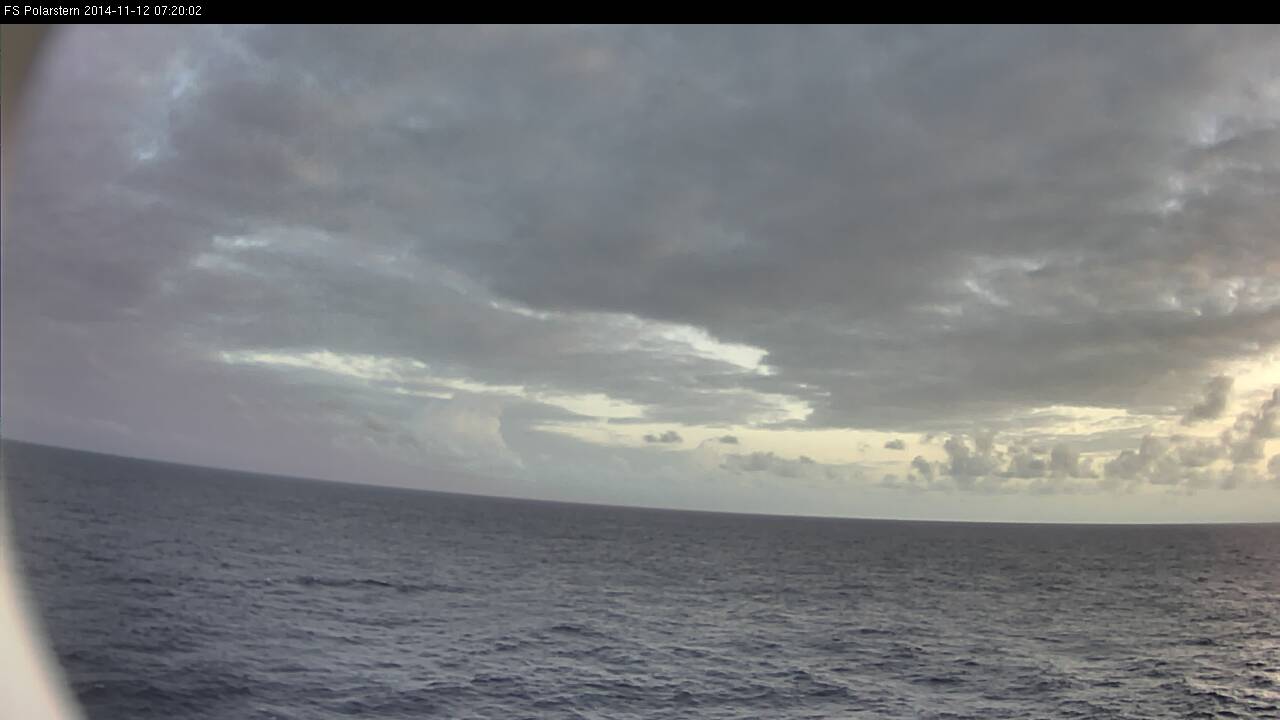
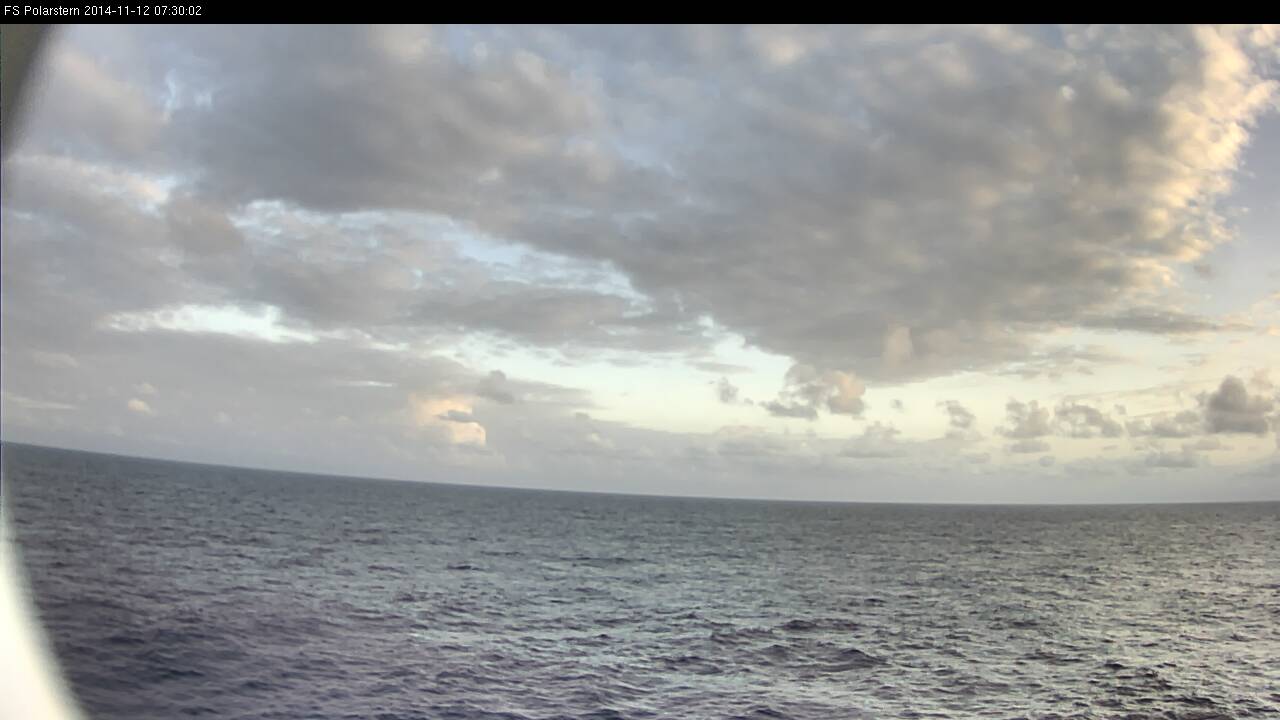
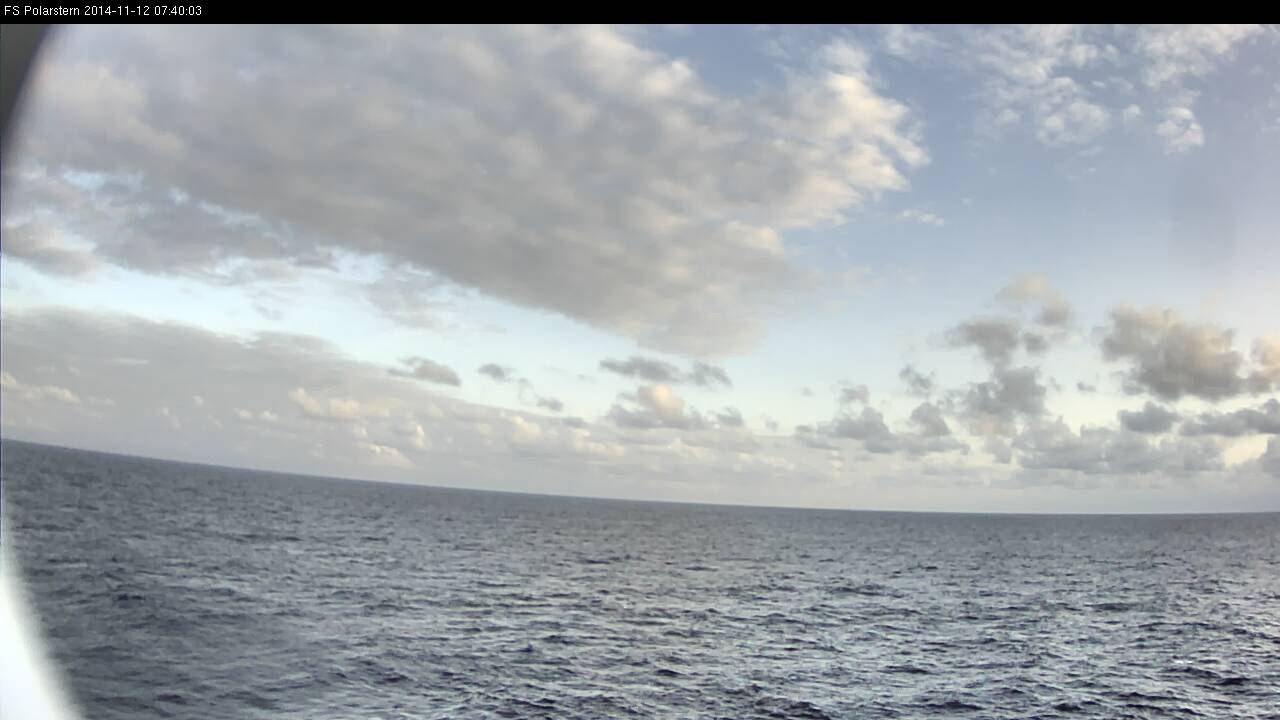
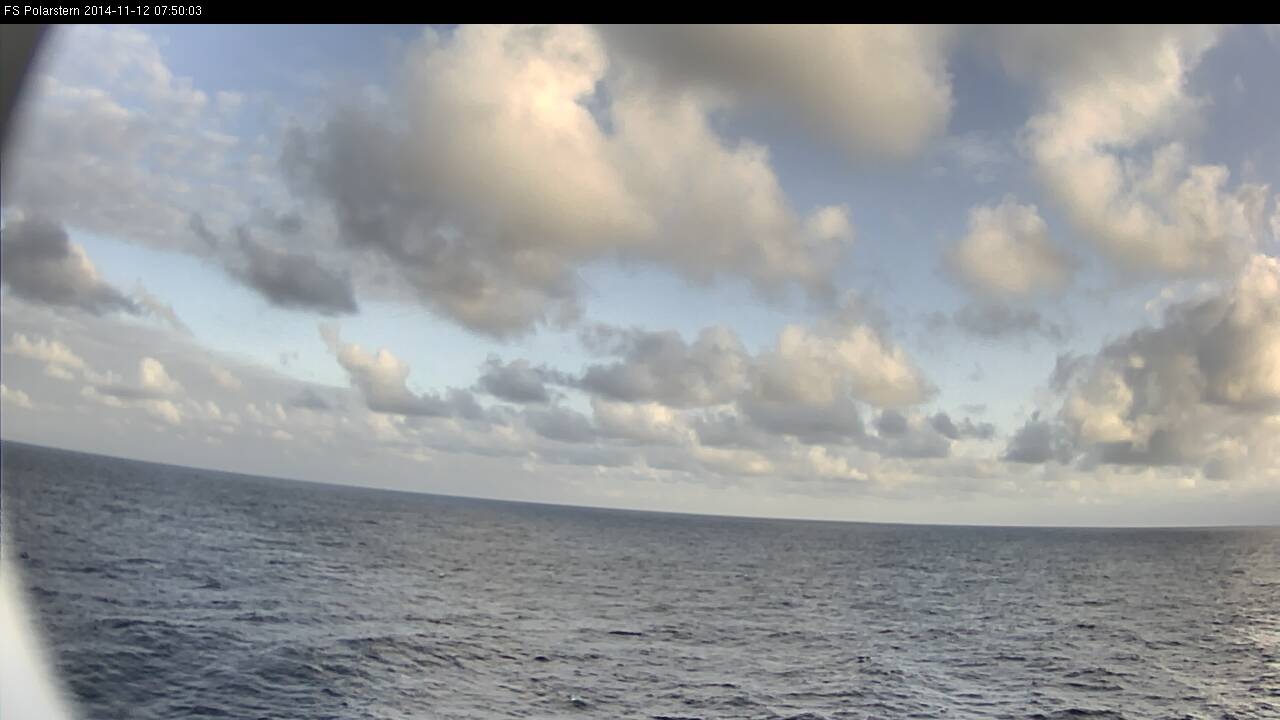
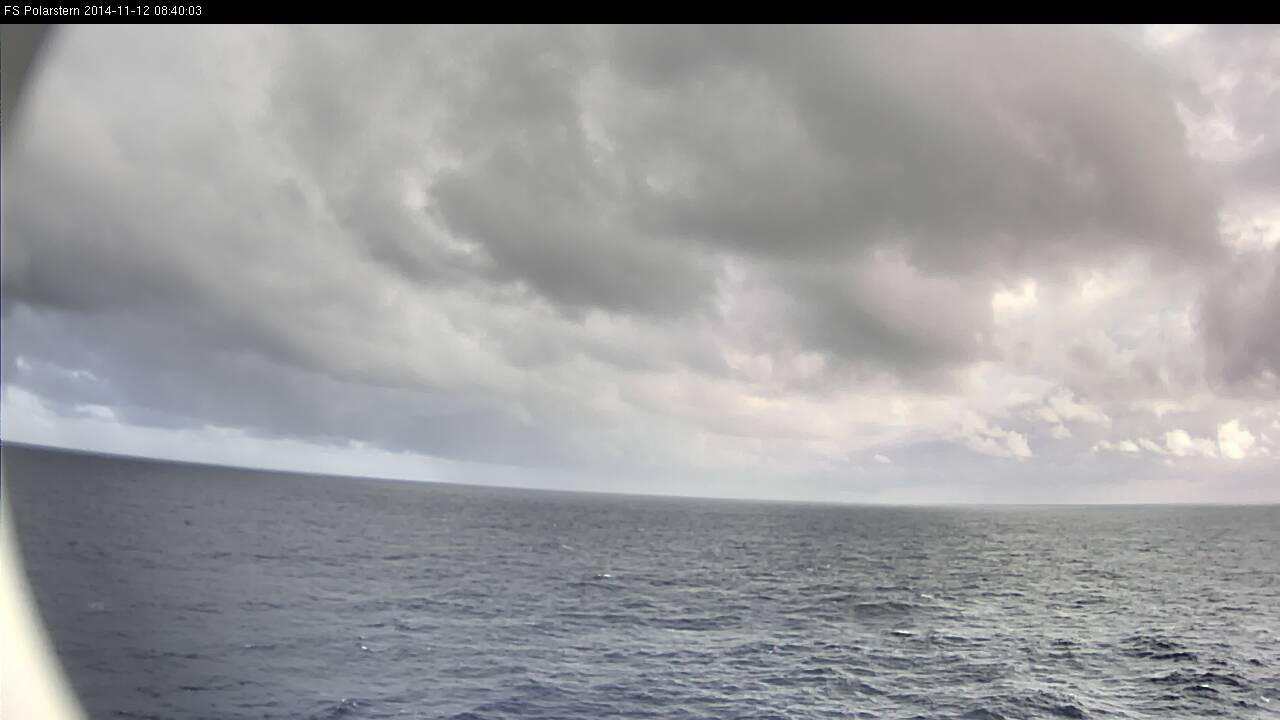
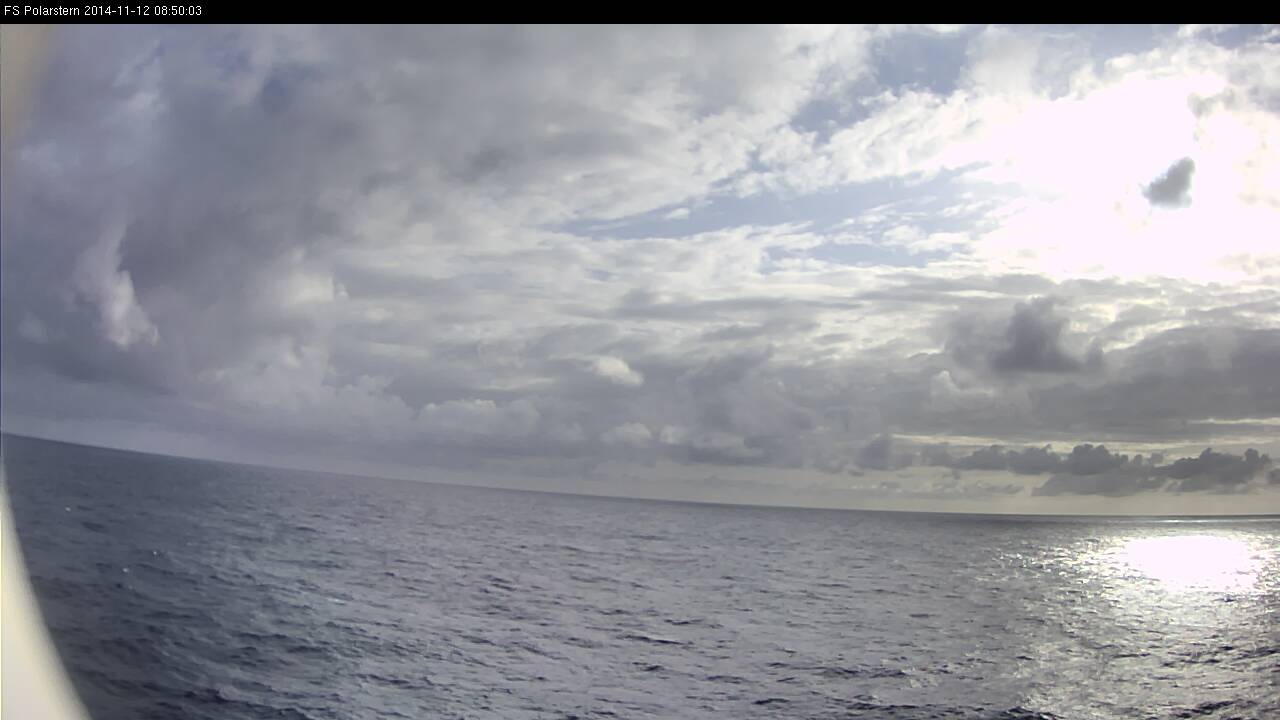
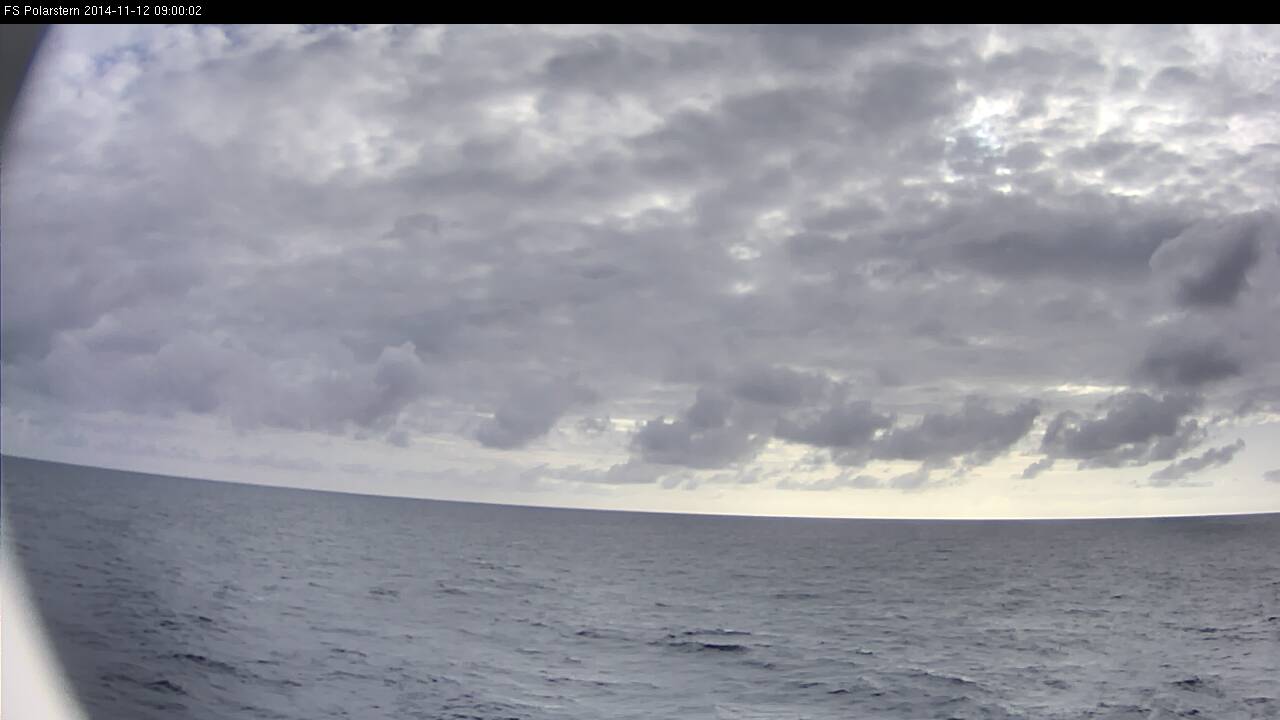
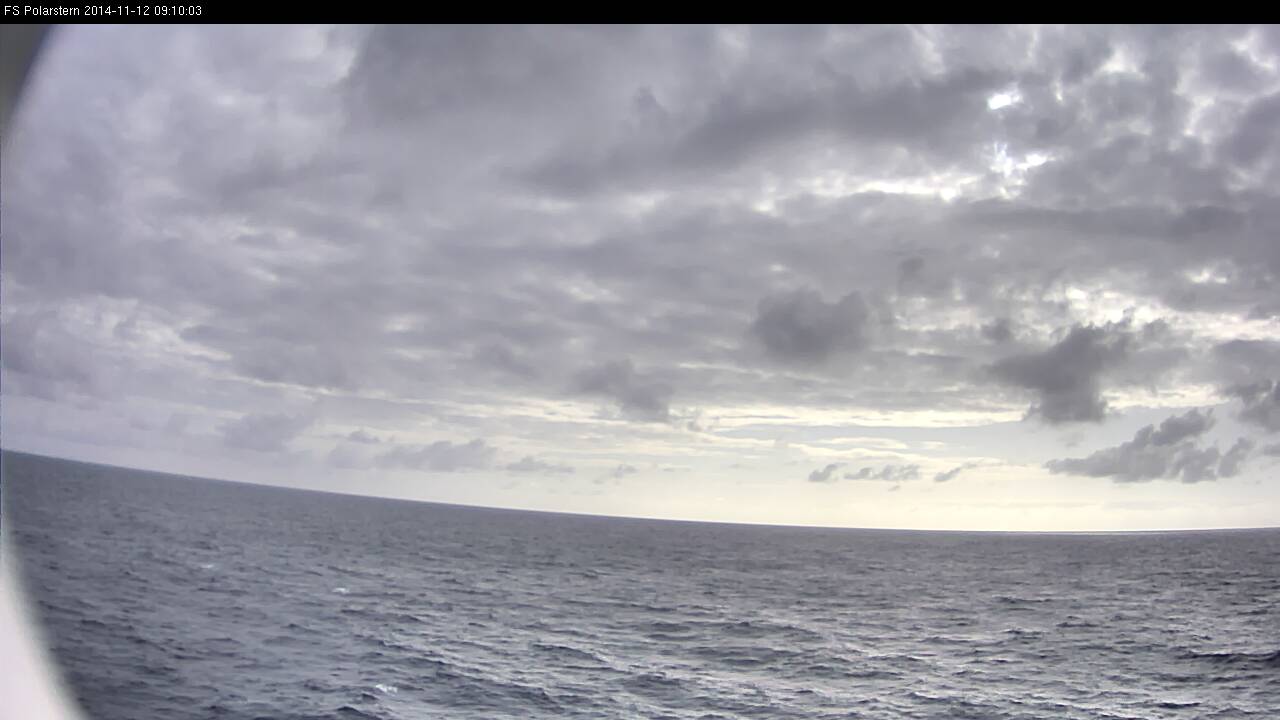
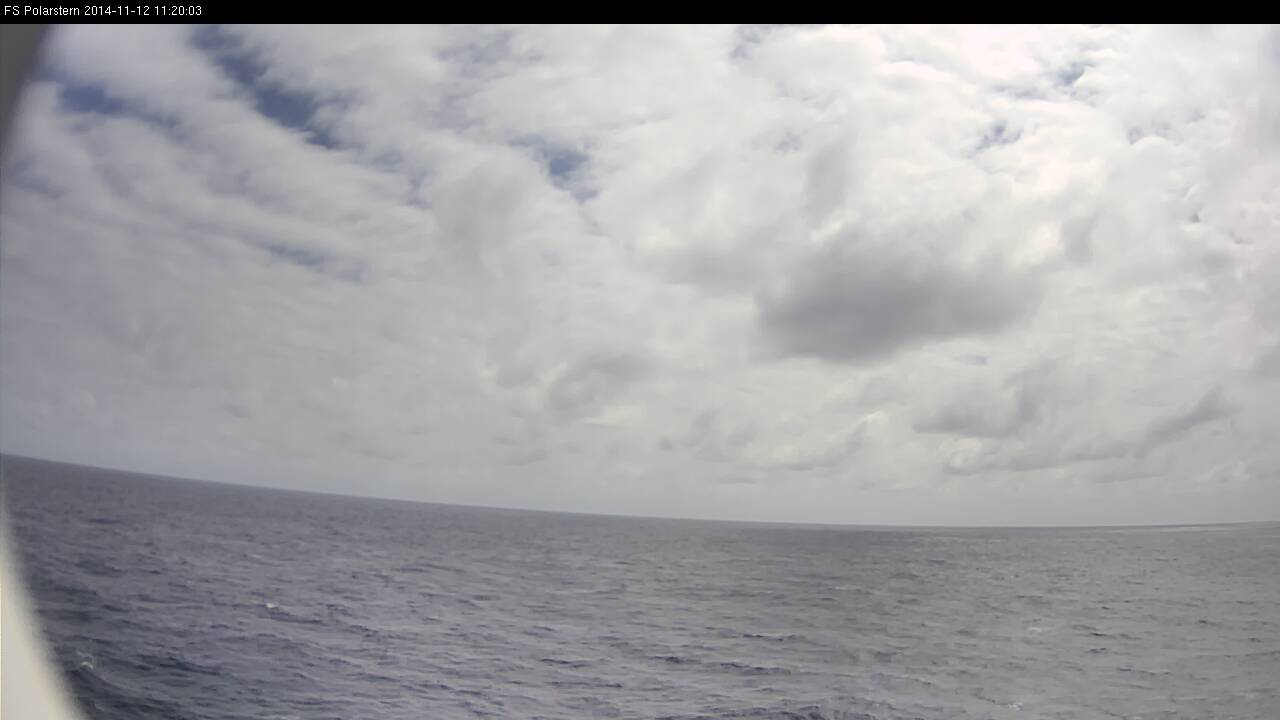
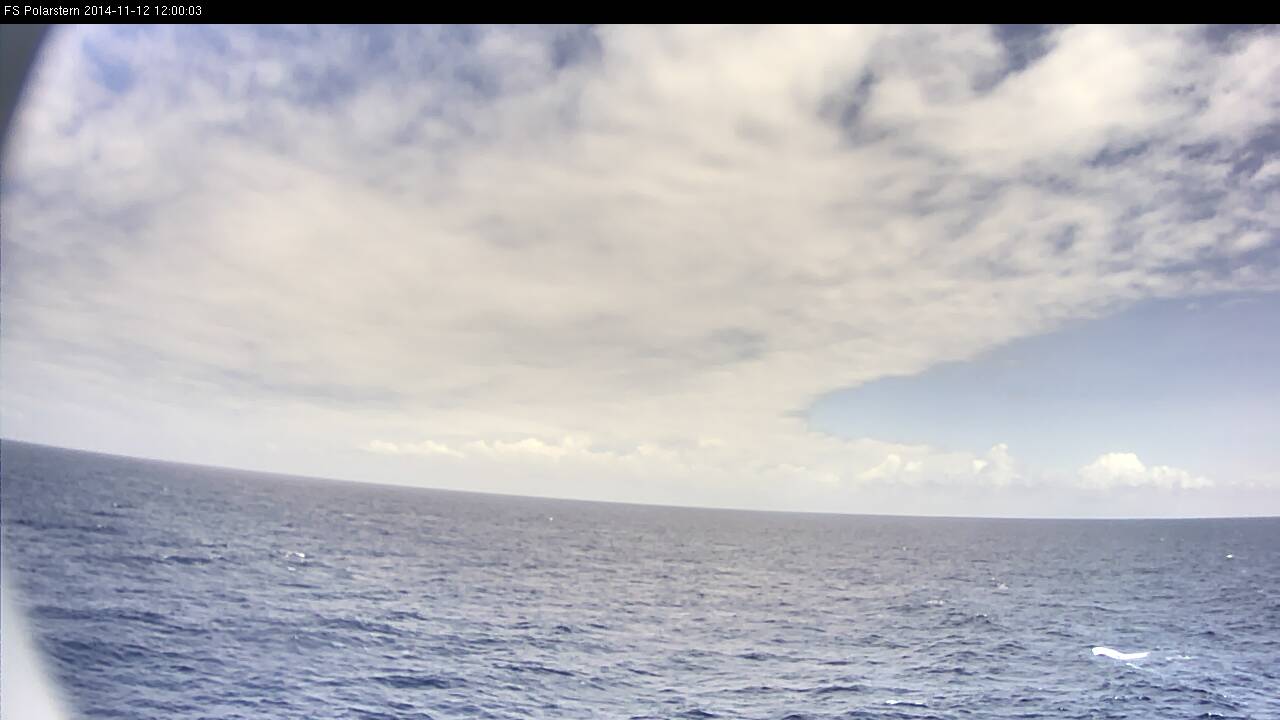
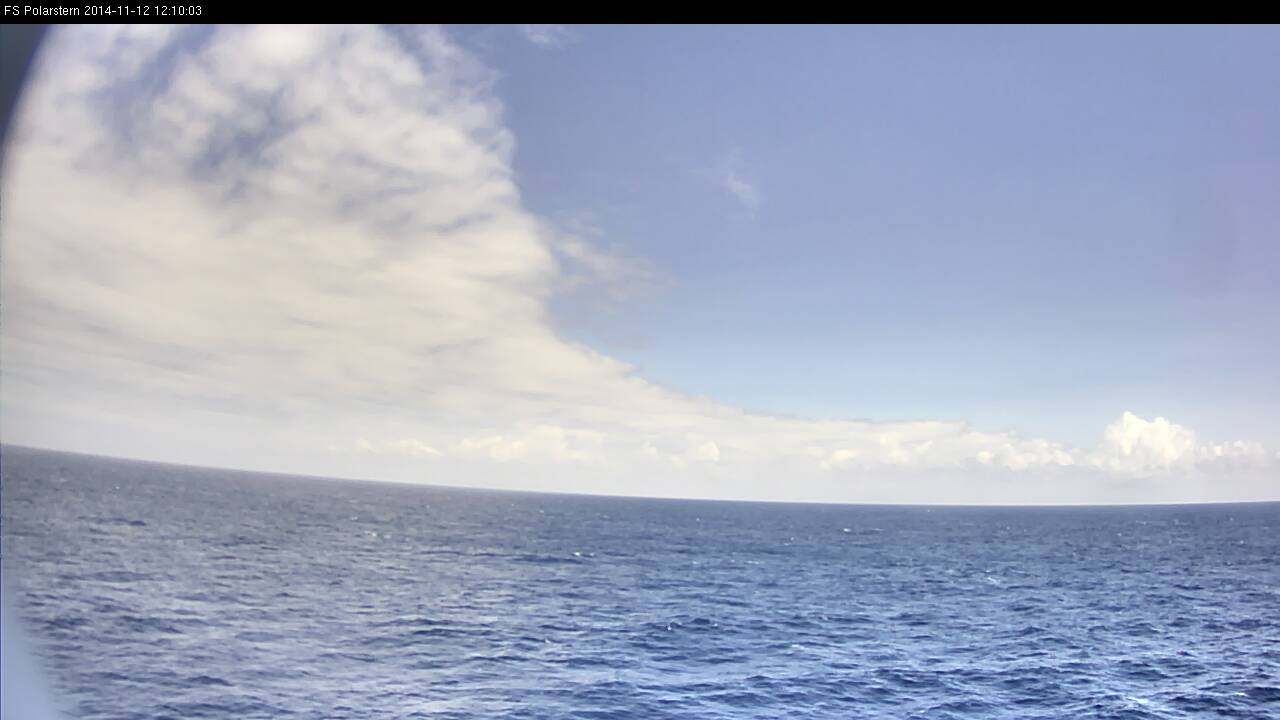
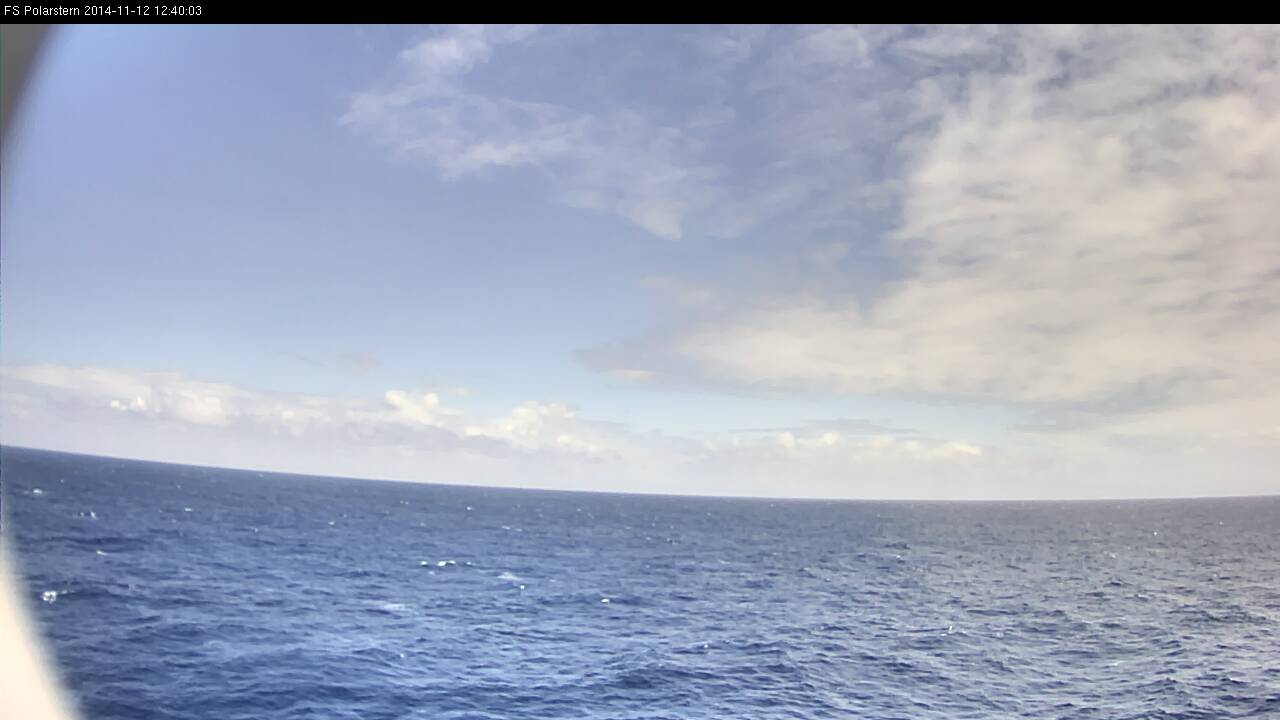
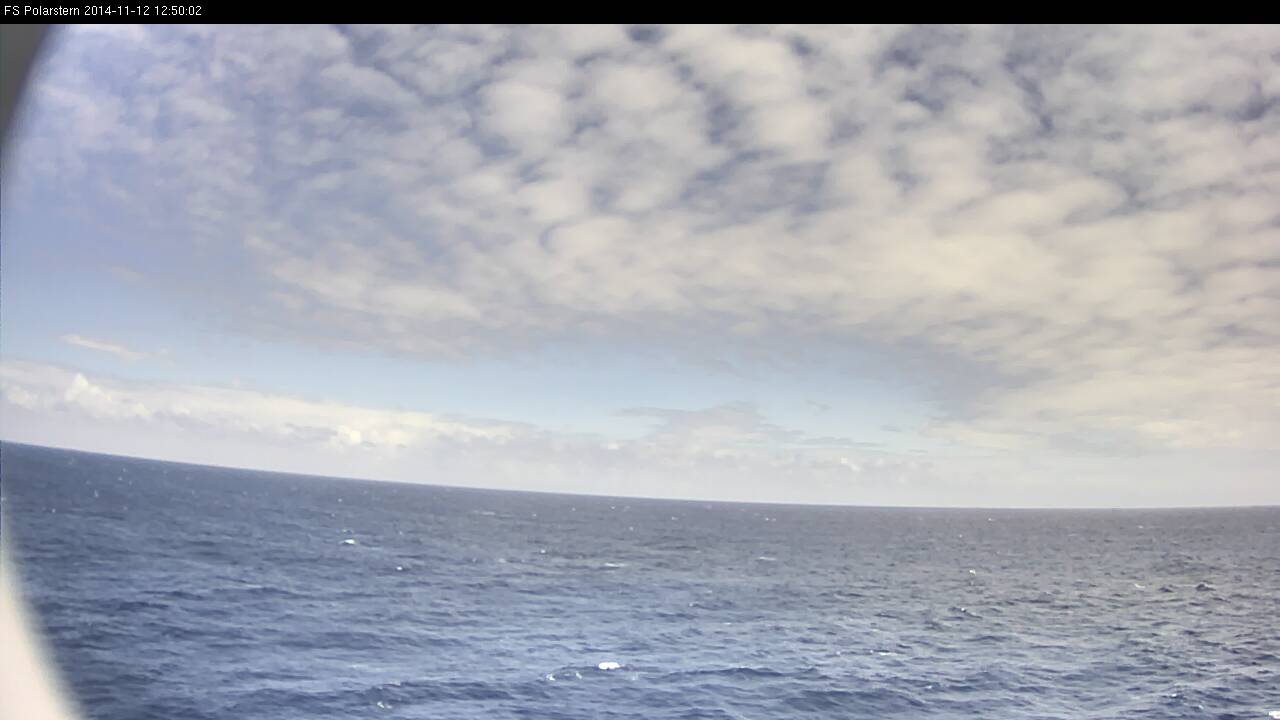
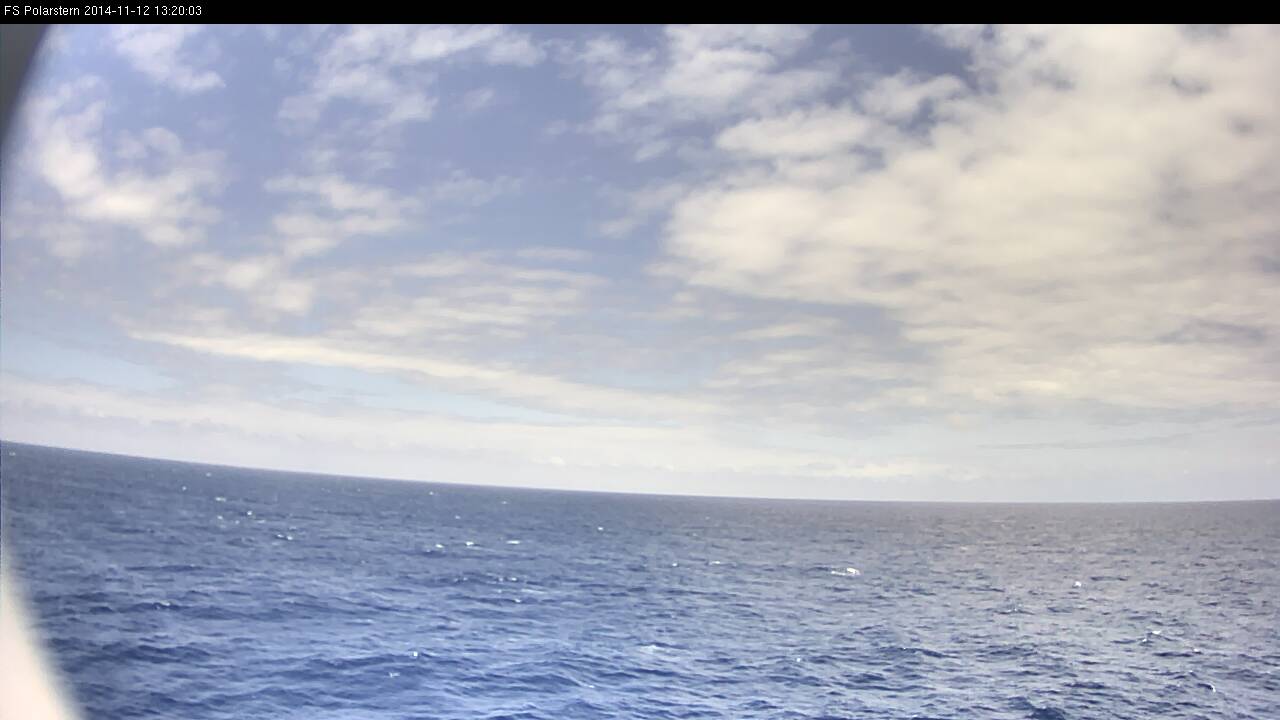
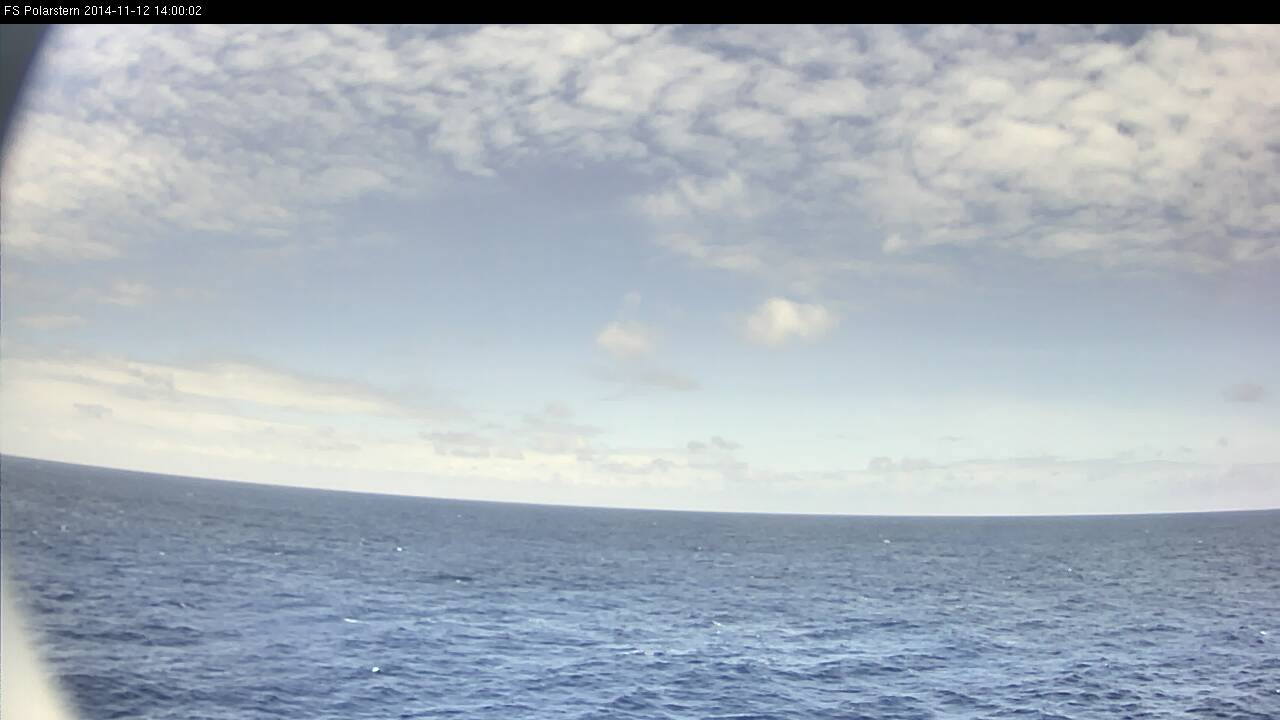
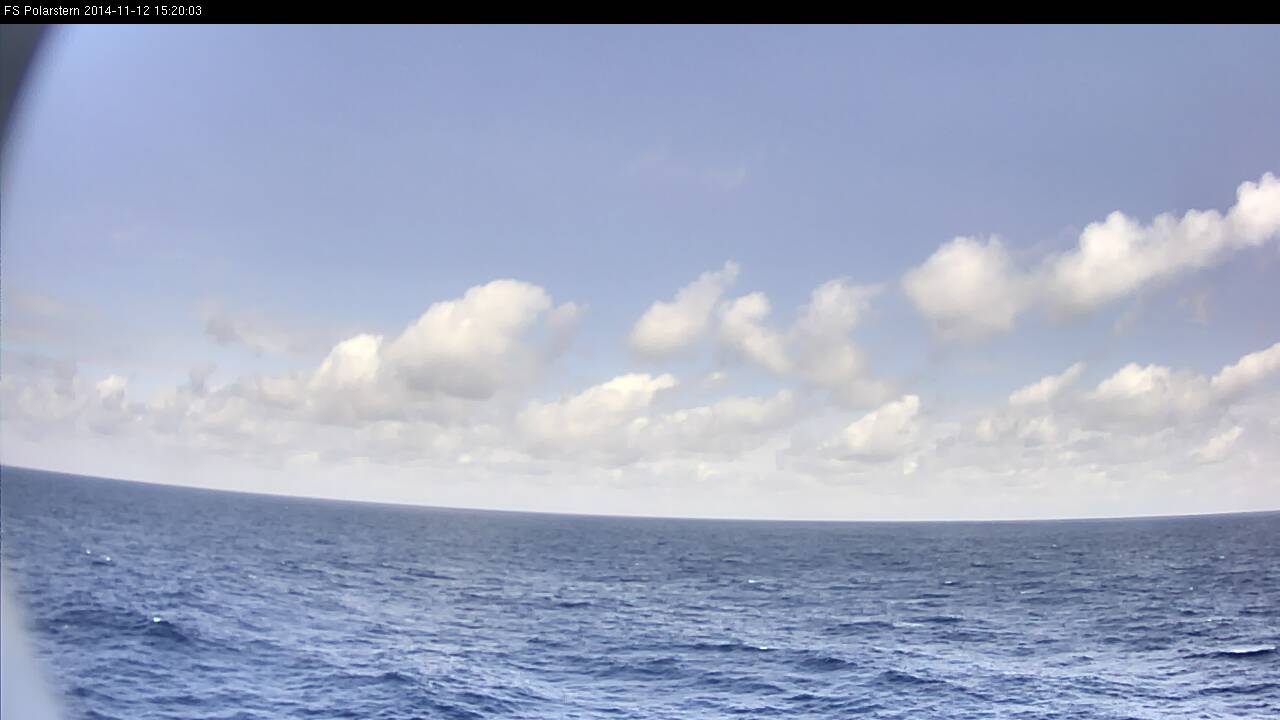
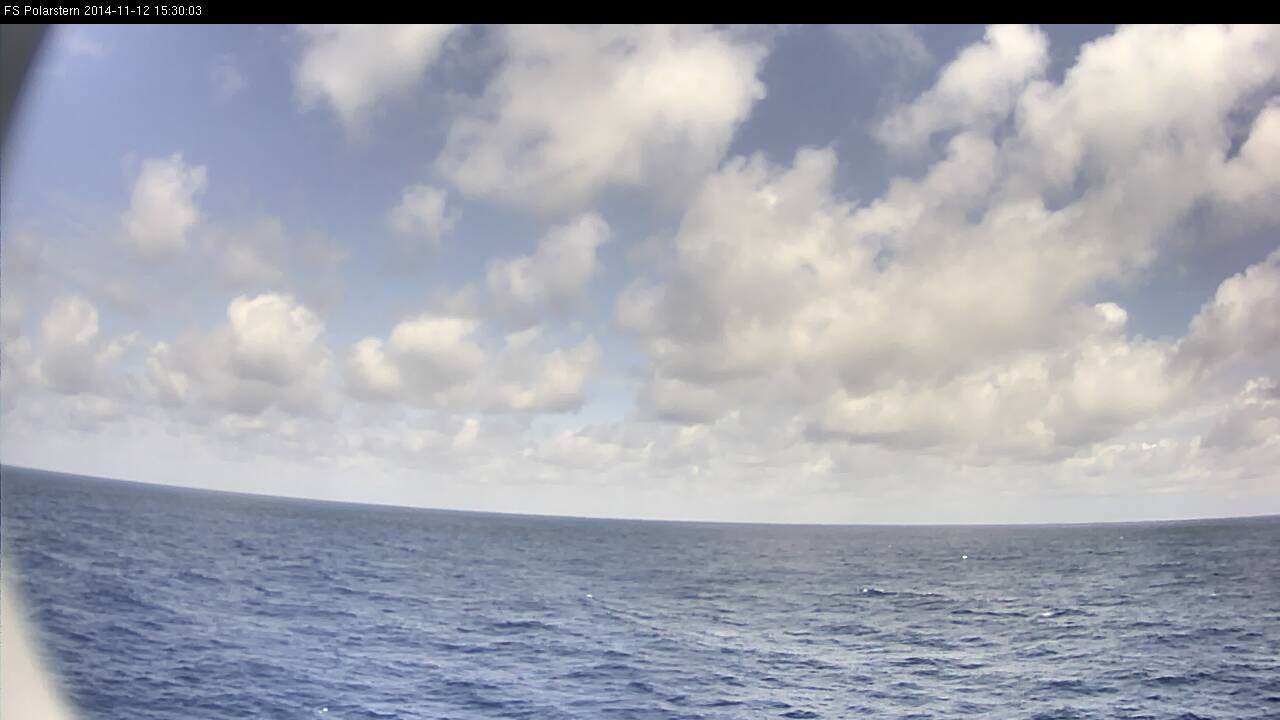
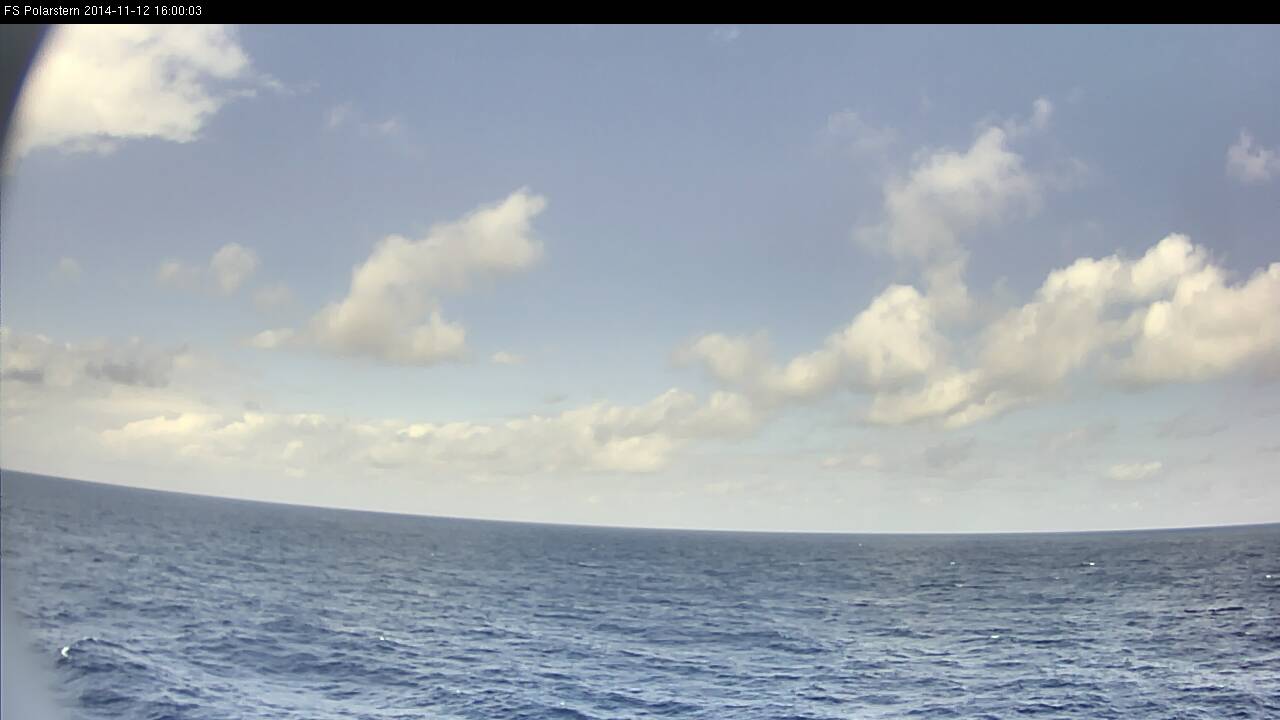
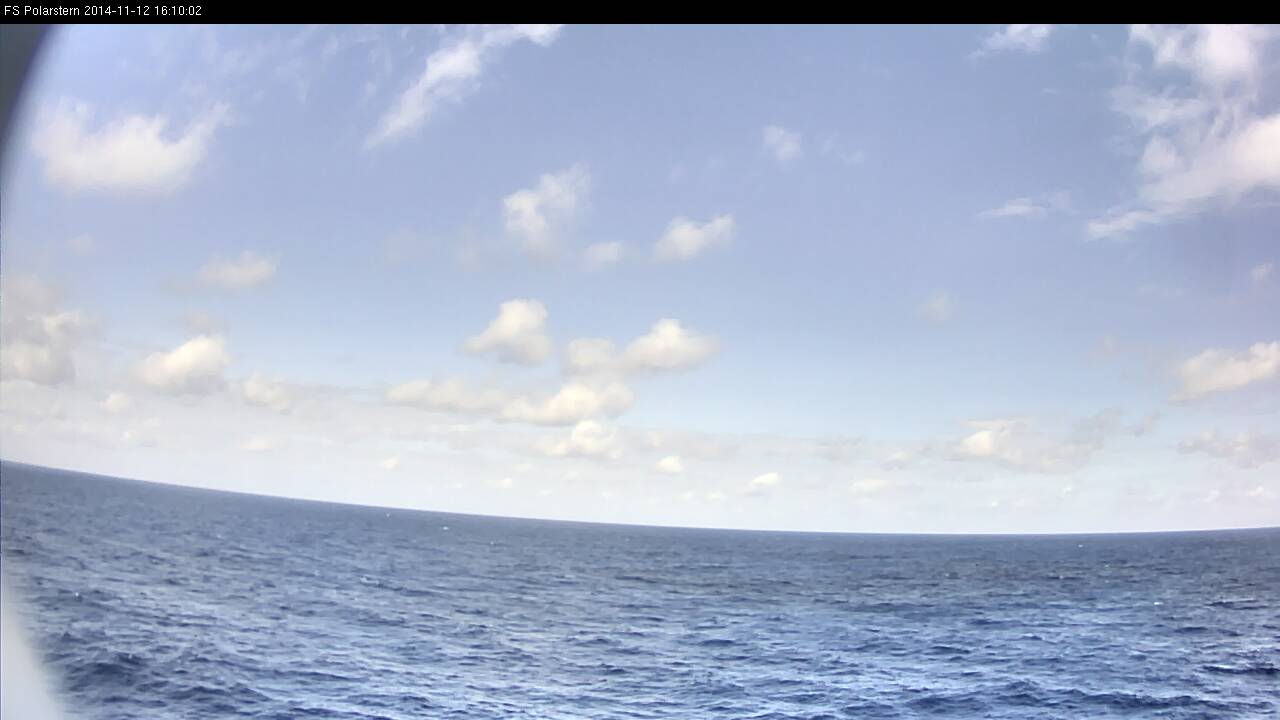
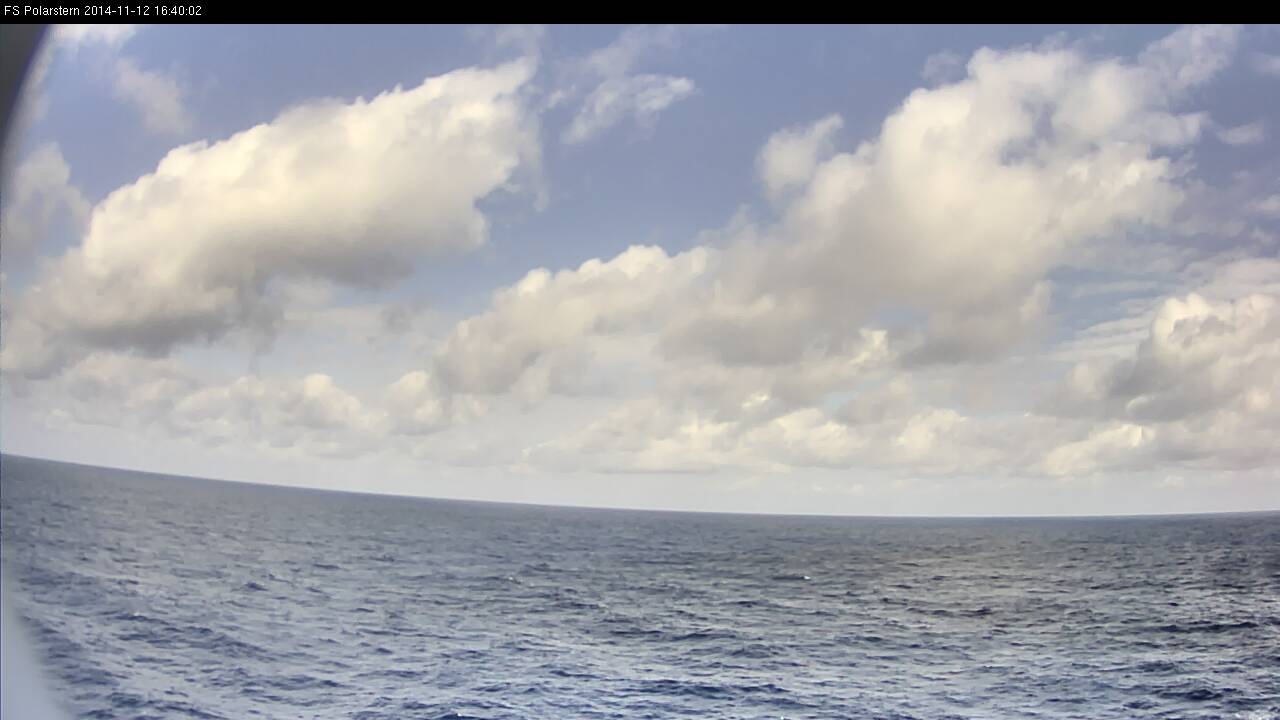
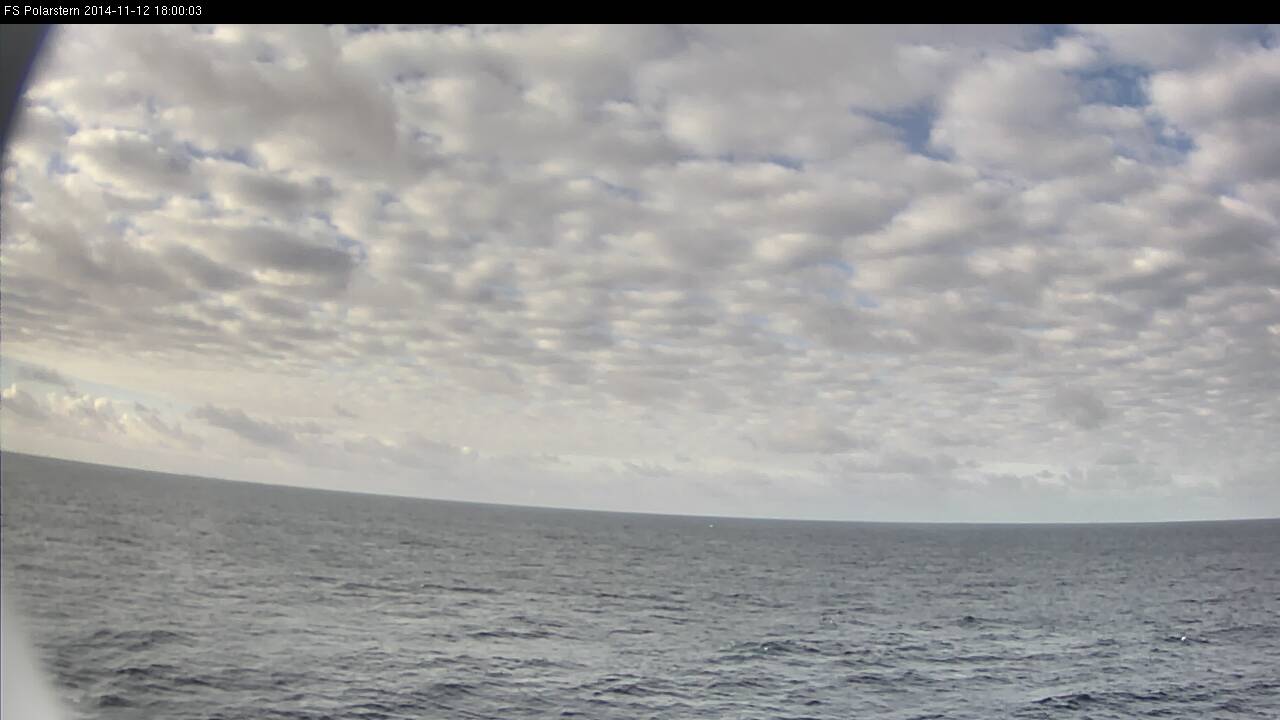
You can compare the webcam image in Fig. L2-21 with the 12:00 UTC SYNOP code, which reports 5/8 cumulus and stratocumulus with bases at different heights and cirrus fibratus in the higher levels.
SYNOP-Report from 12:00 UTC
DBLK 12121 99020 70230 11598 51308 10268 20230 40112 58001 6///1 70182 85801
22242 04274 20402 314// 40703 6//// =

Figure L2-21: 12 Nov 2014, 12:00 UTC. Source: DWD.
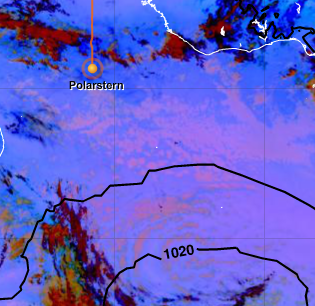
Figure L2-22: 12 Nov 2014, 12:00 UTC. Dust RGB. Source: EUMeTrain.
The Dust RGB in Fig. L2-22 shows the cloud situation of the next days in magenta. Under the influence of sinking air and an inversion, there are typical low water clouds (cumulus, stratocumulus) in the southeastern trade wind zone.

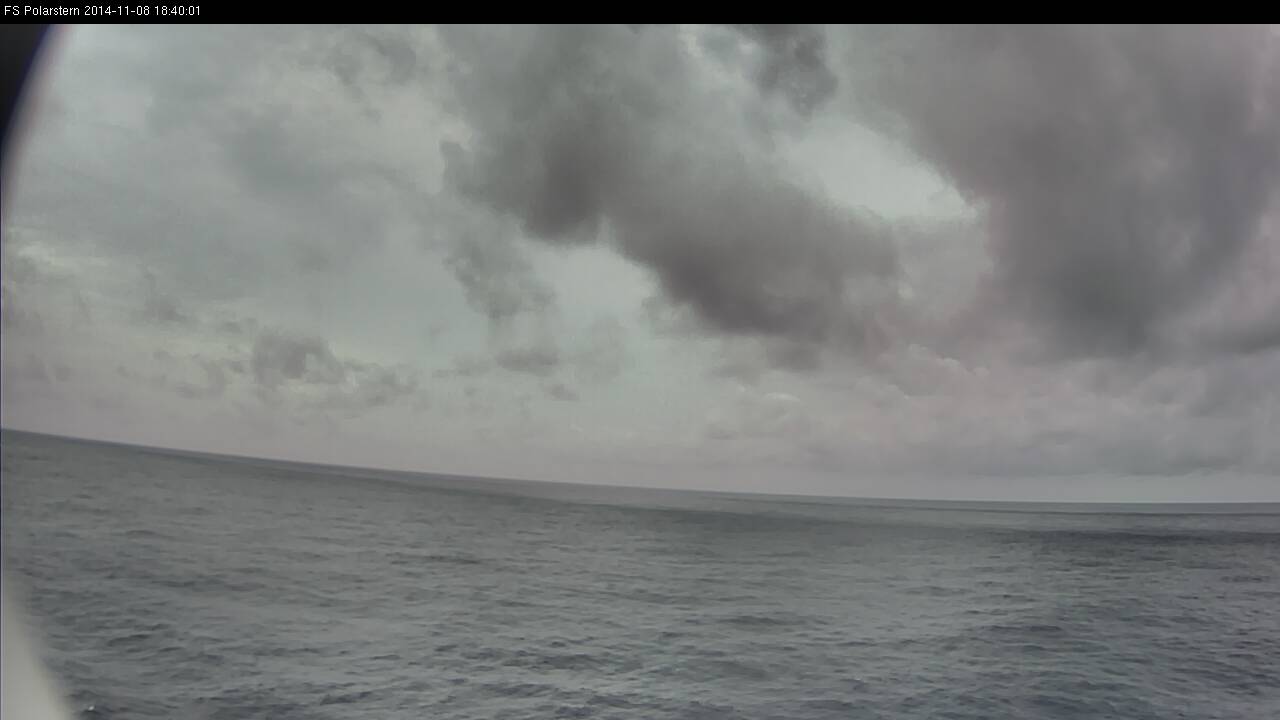
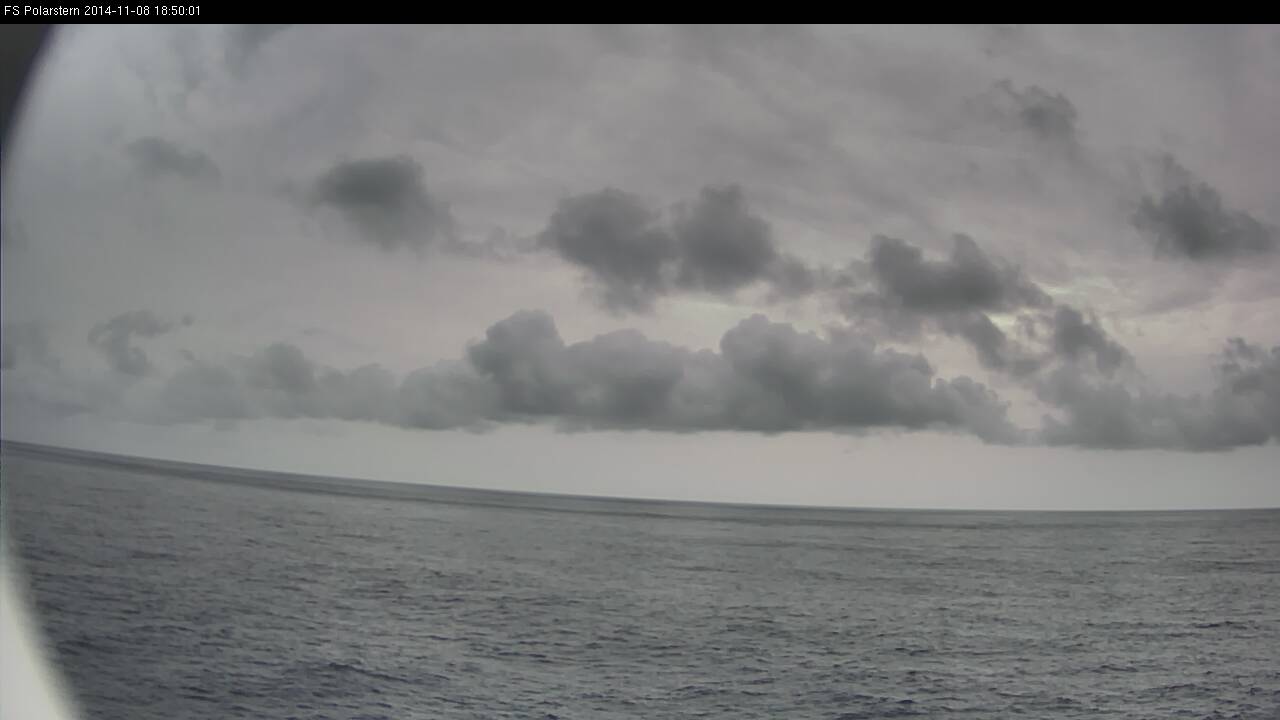
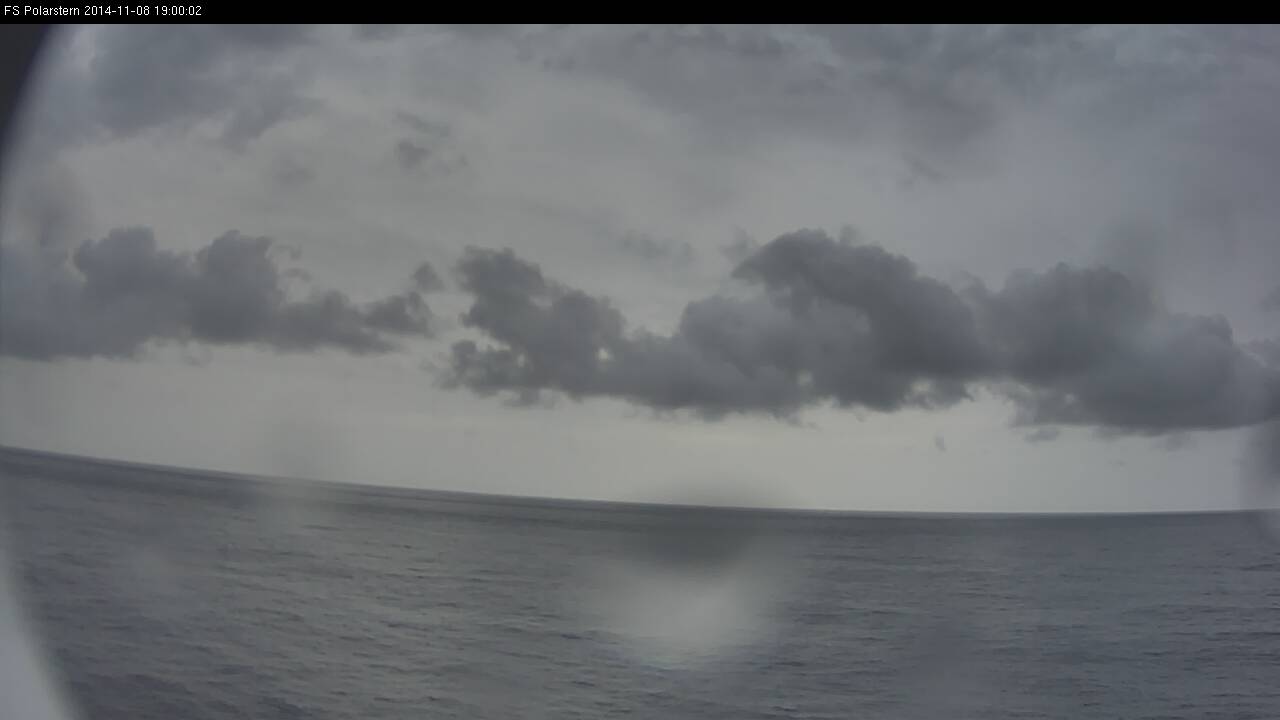
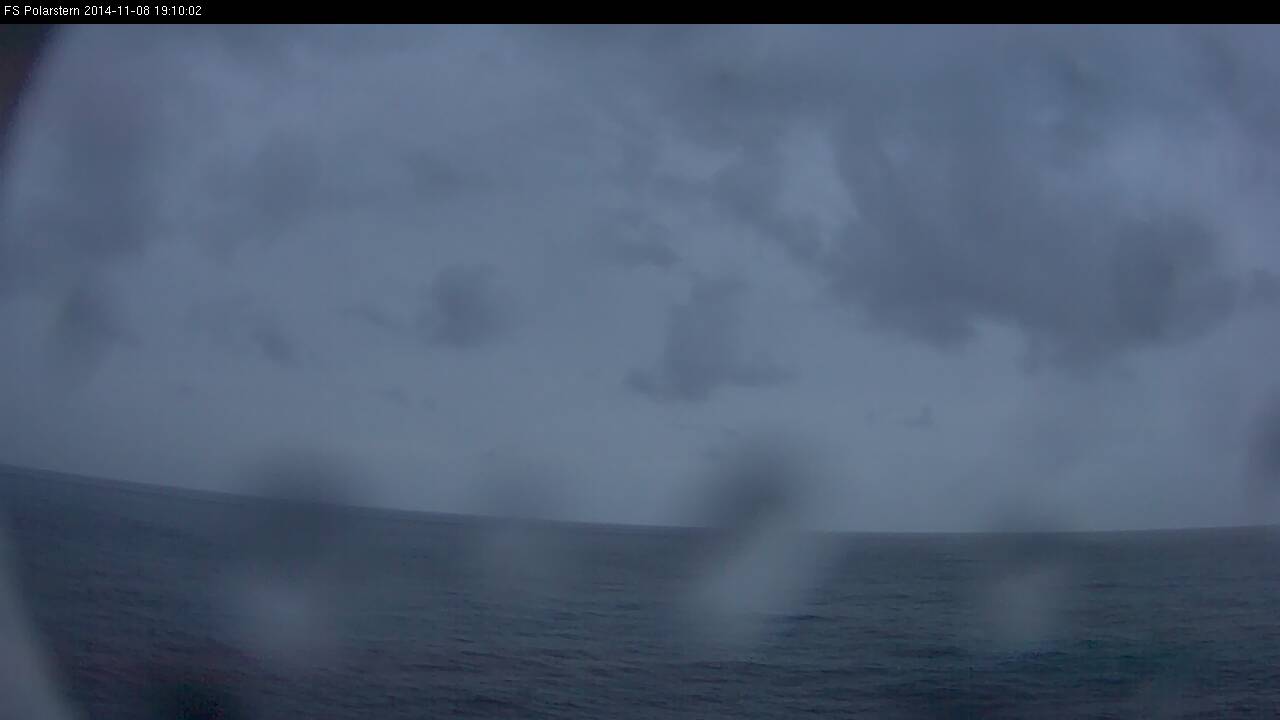
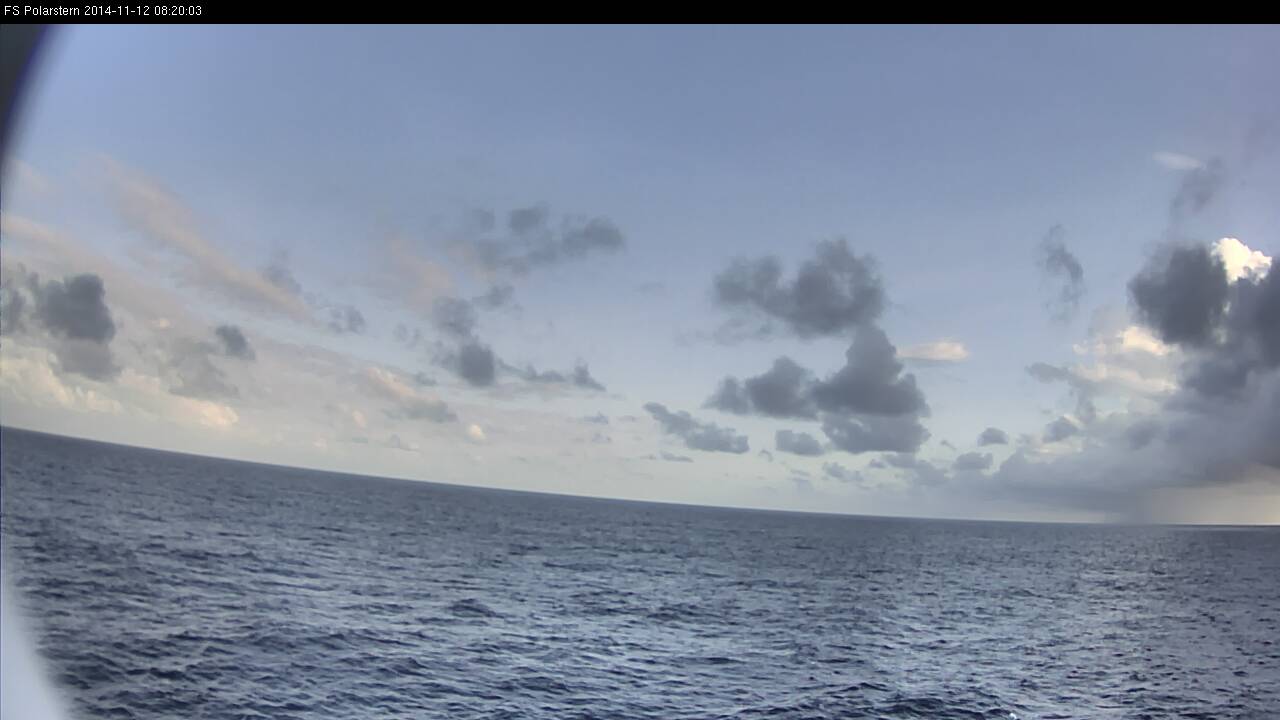
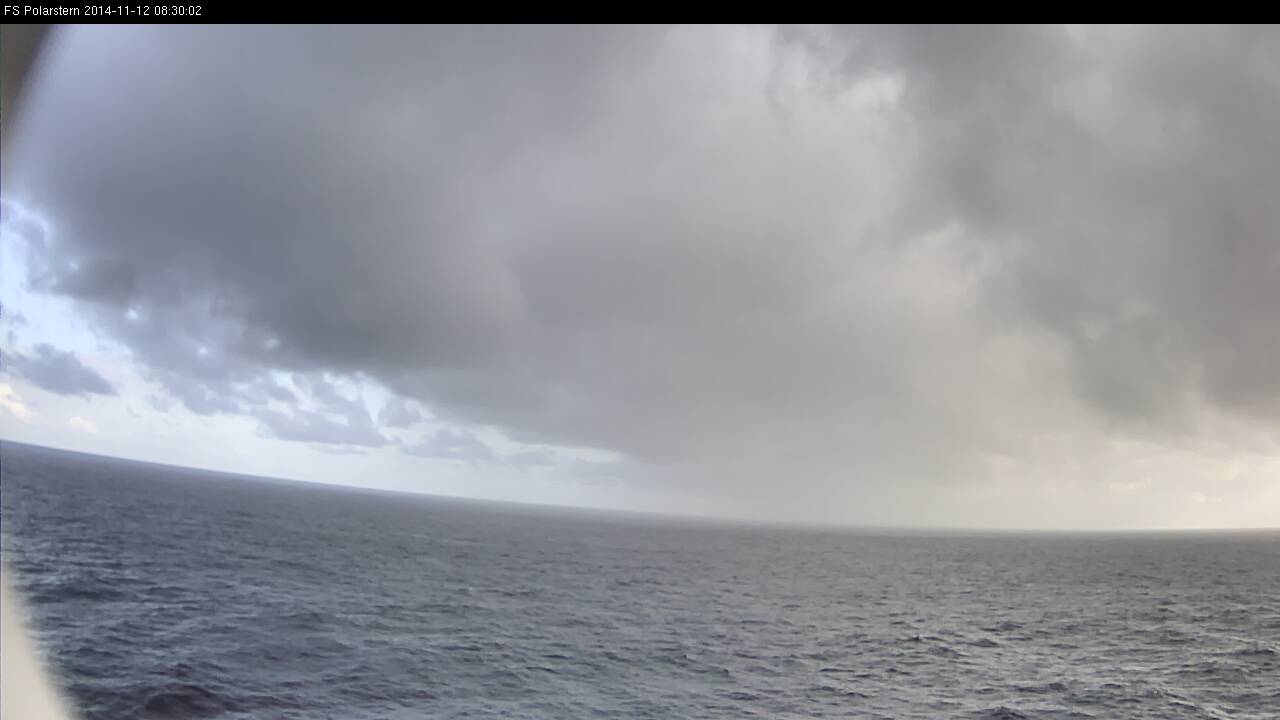
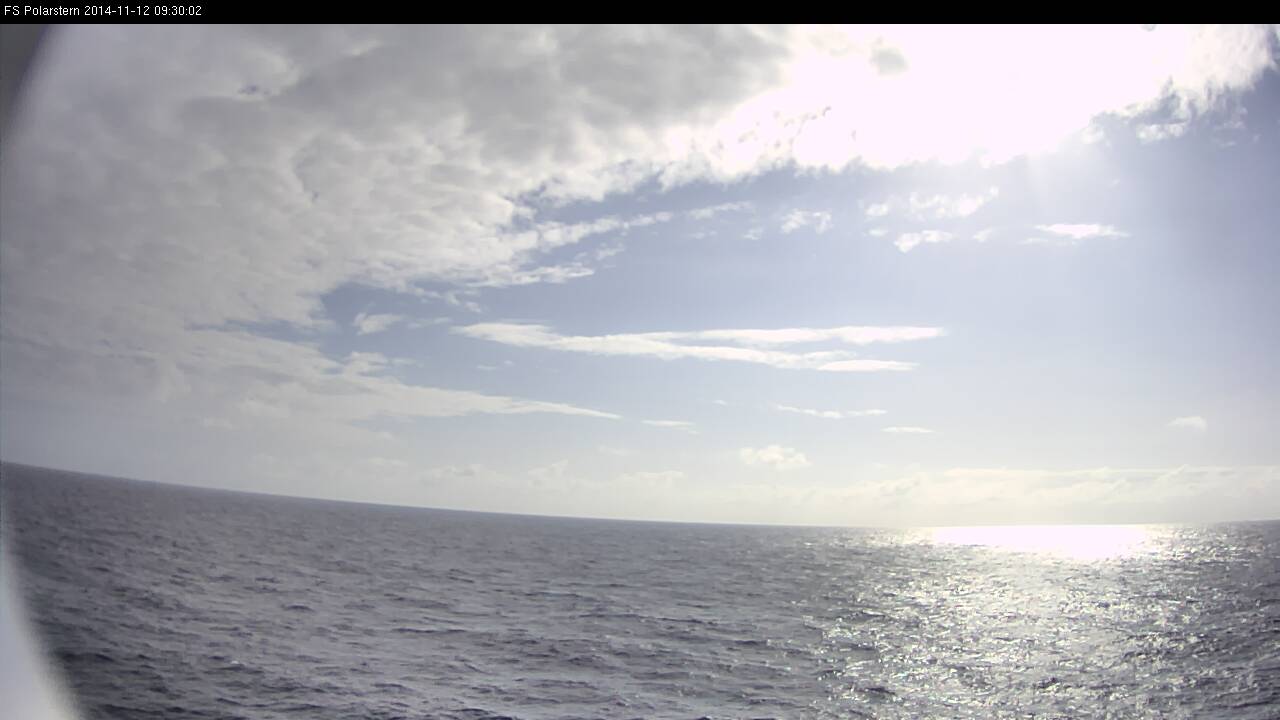
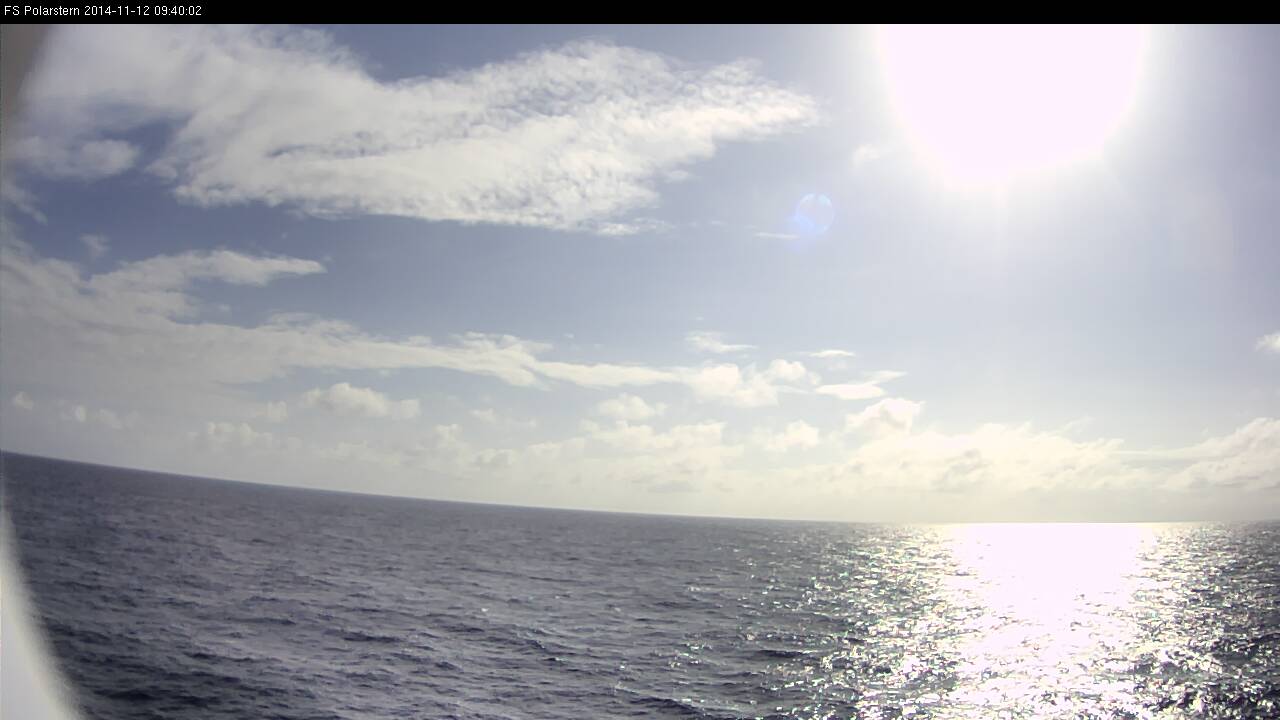
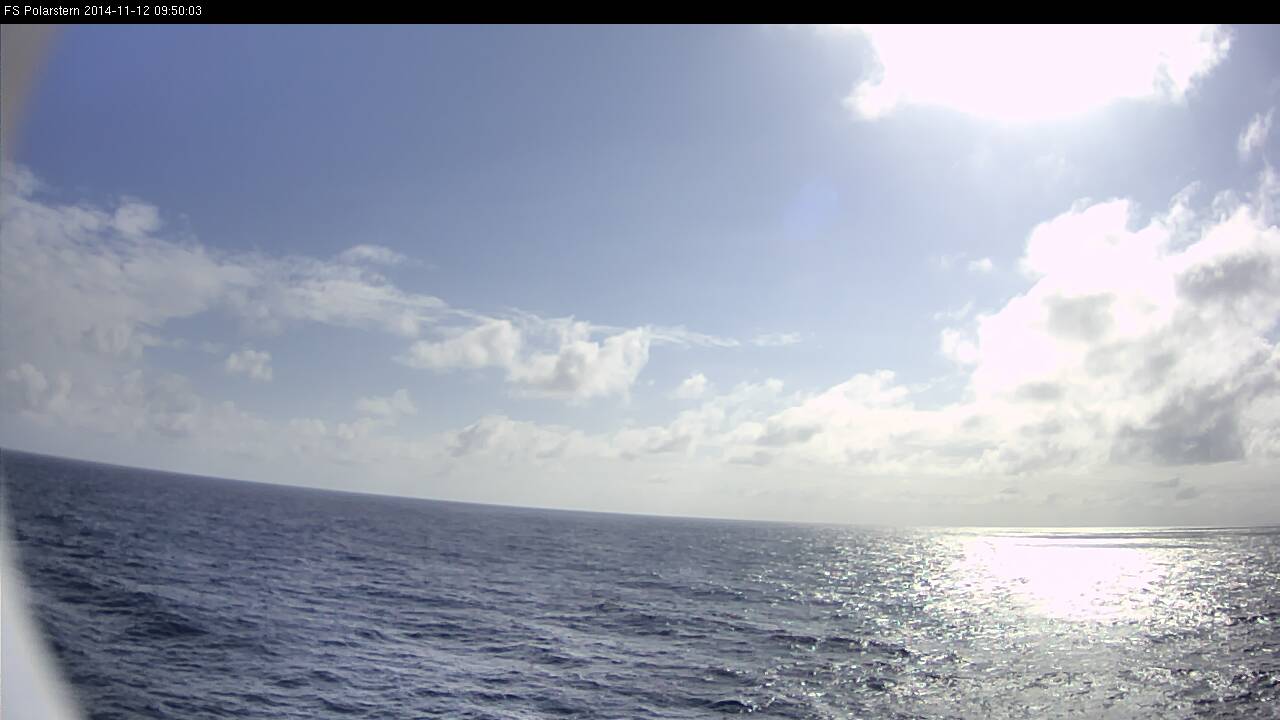
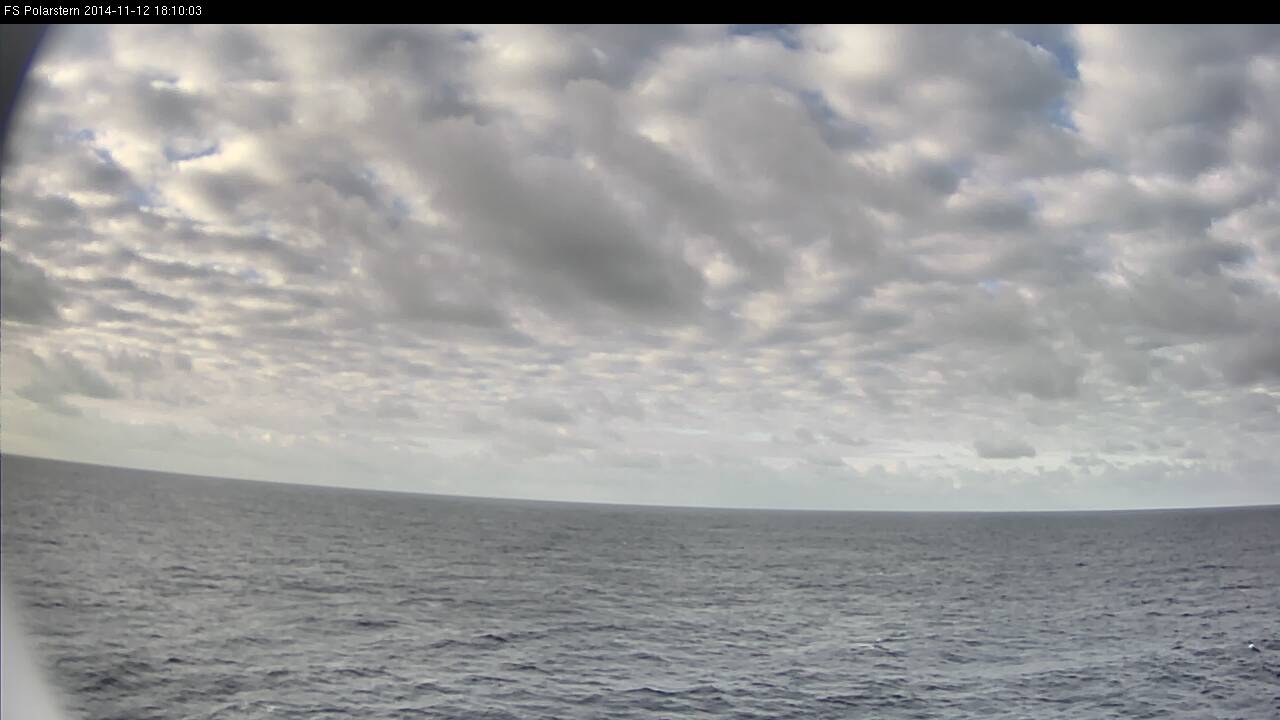
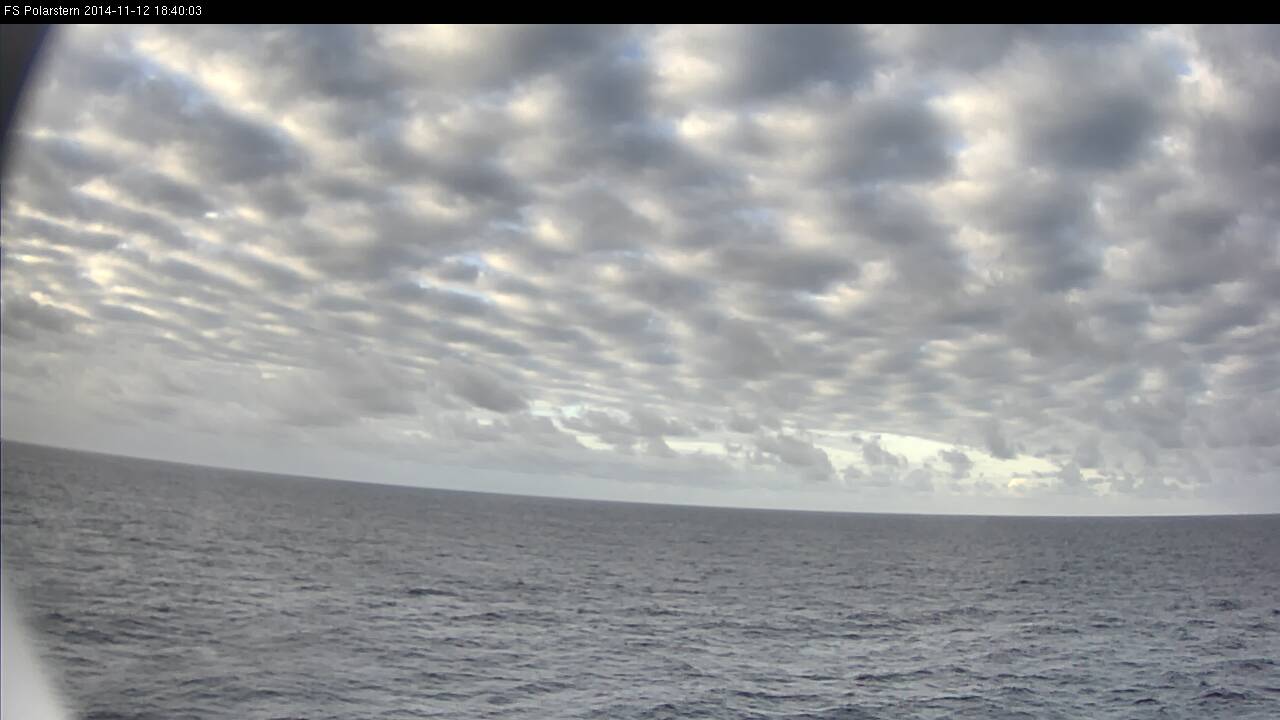
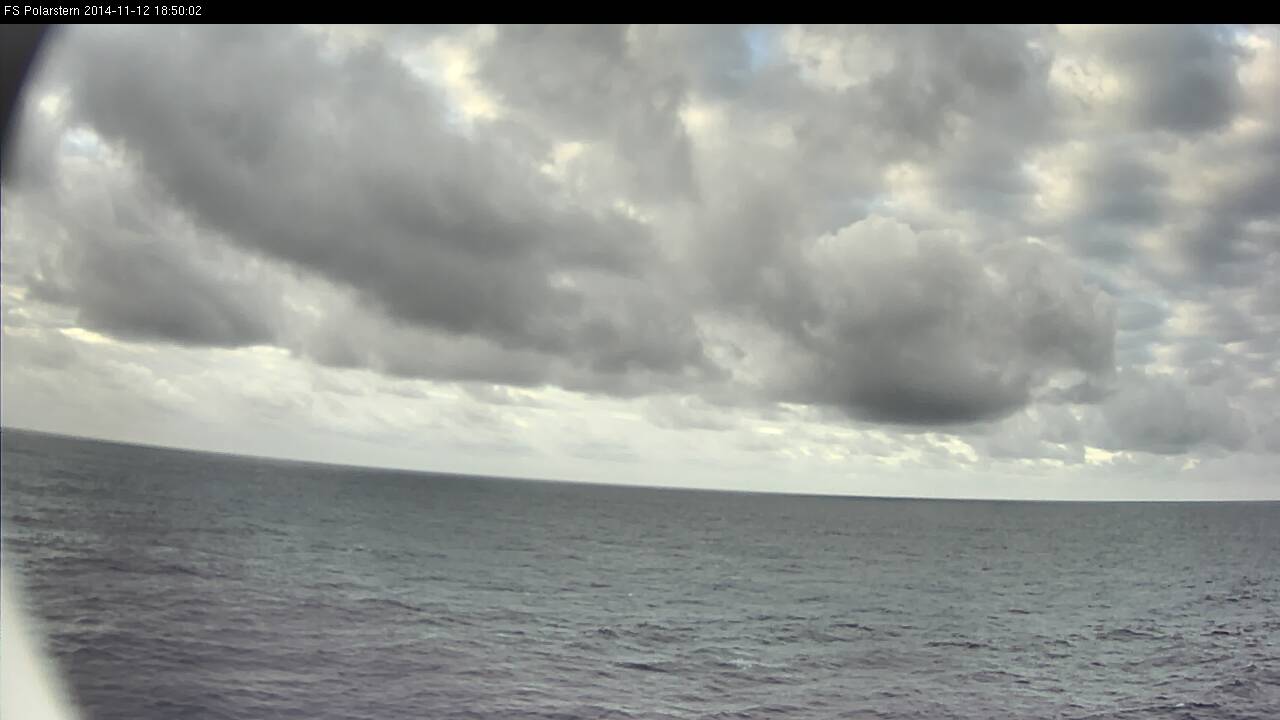
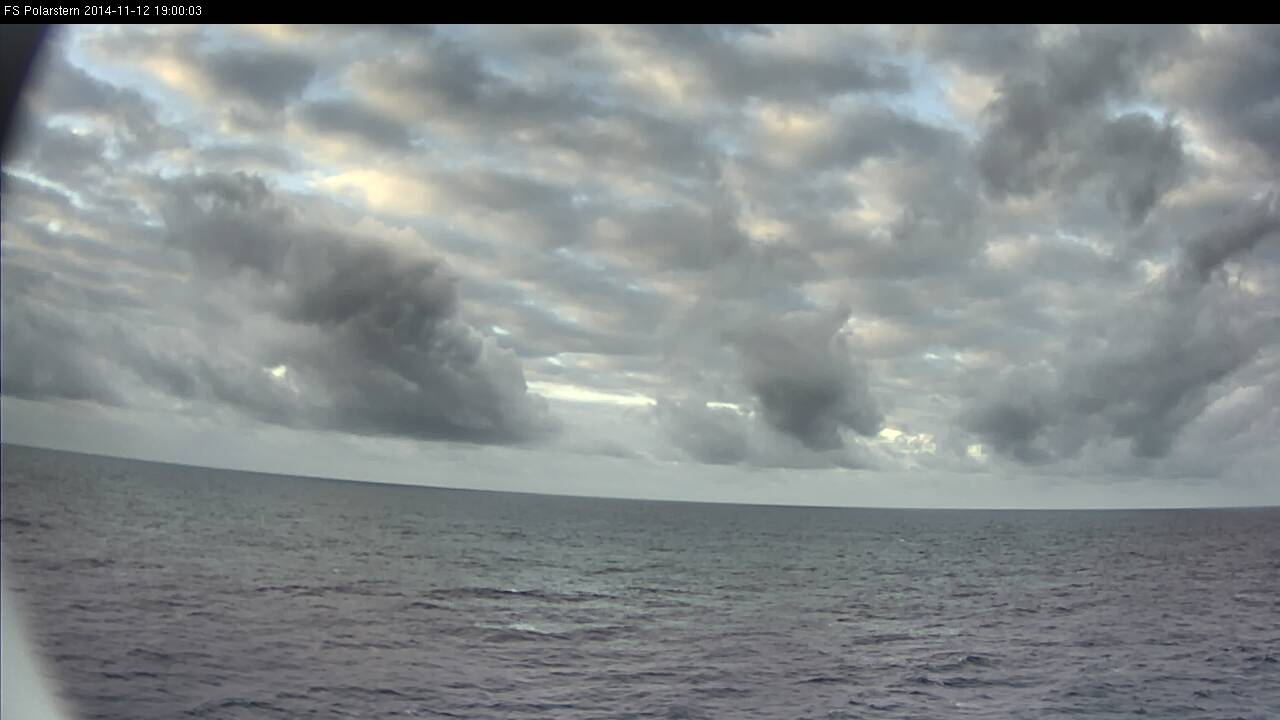
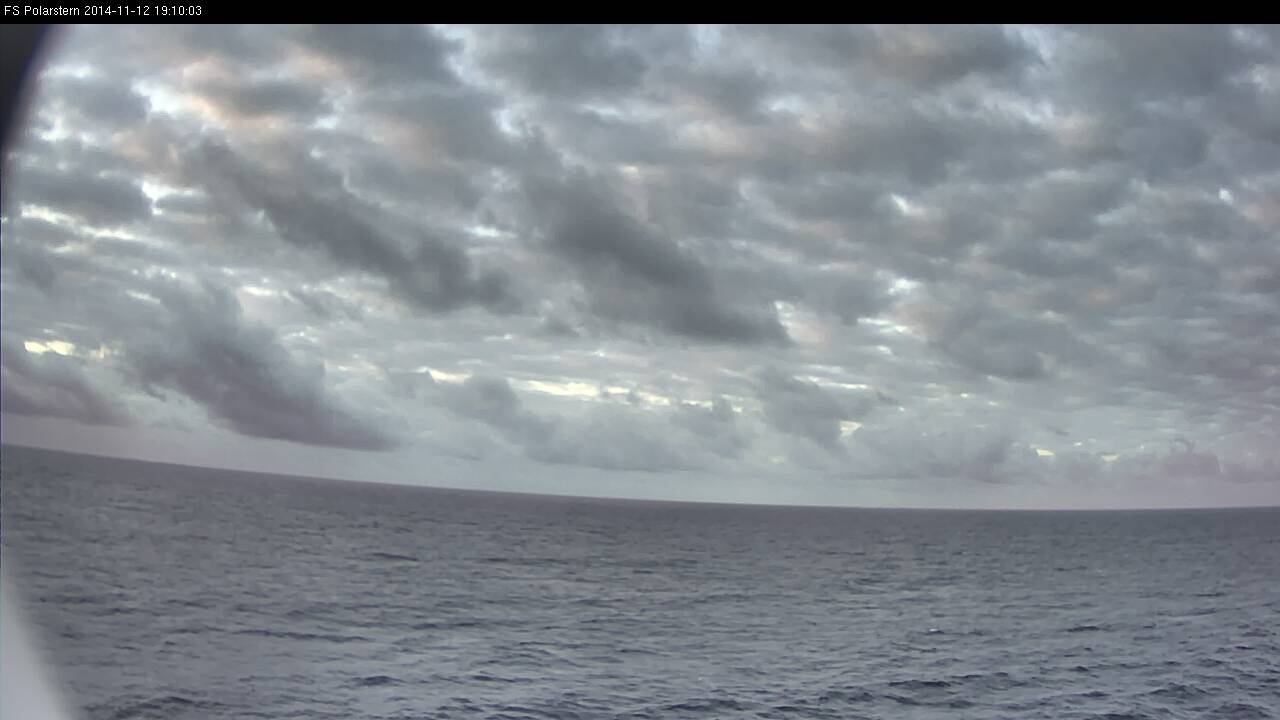
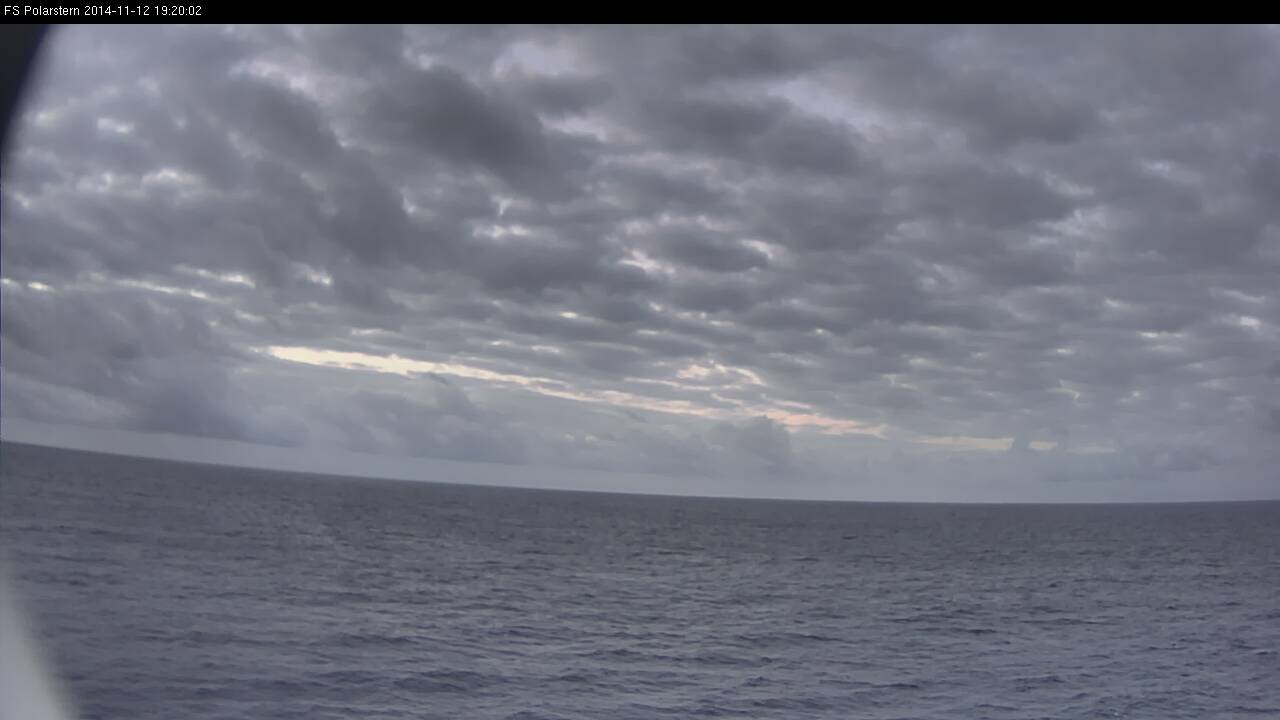
Figure L2-23: 12 Nov 2014, 18:40 UTC.
In the webcam image from 18:40 UTC the cloud situation of the trade wind zone returns. Note the last shower cells in the background.
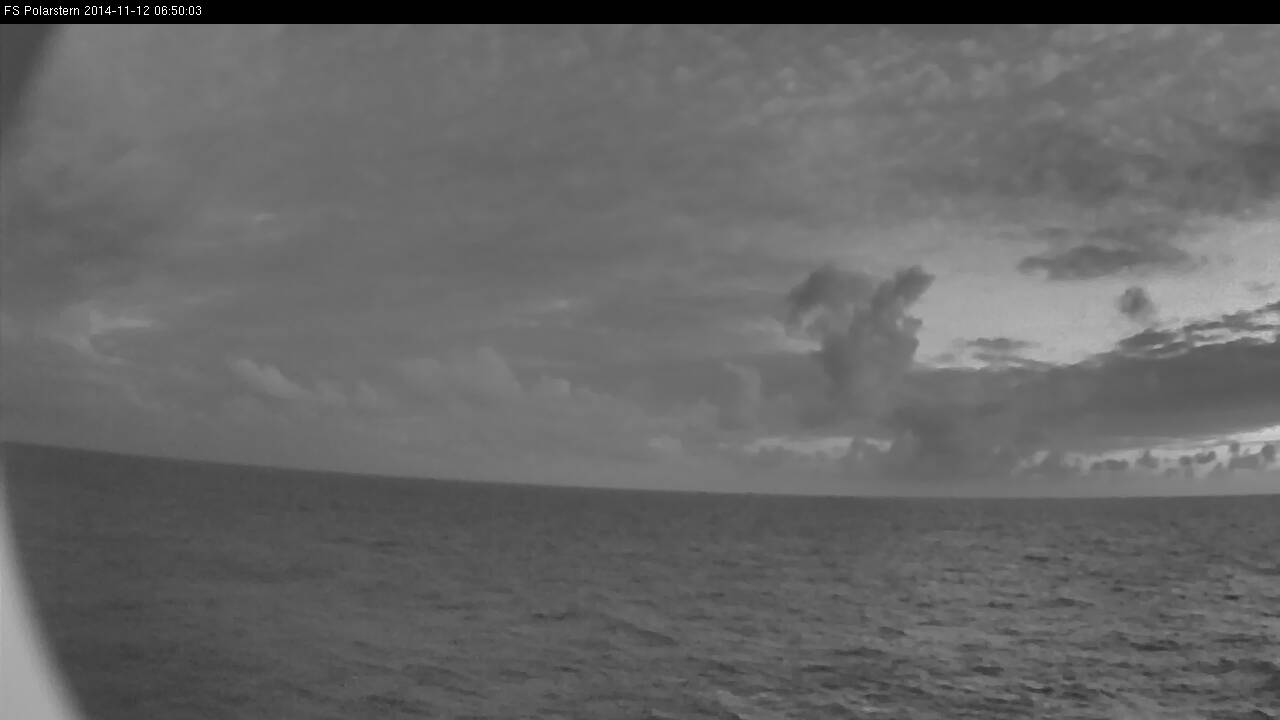
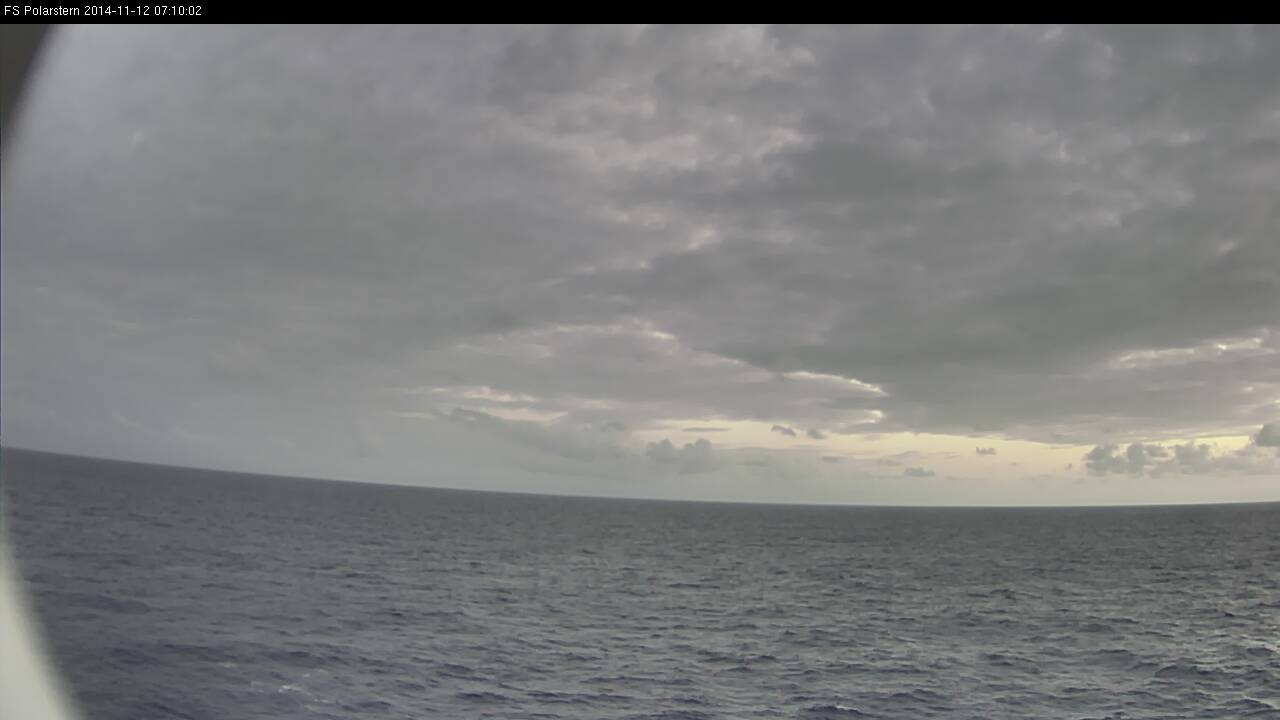
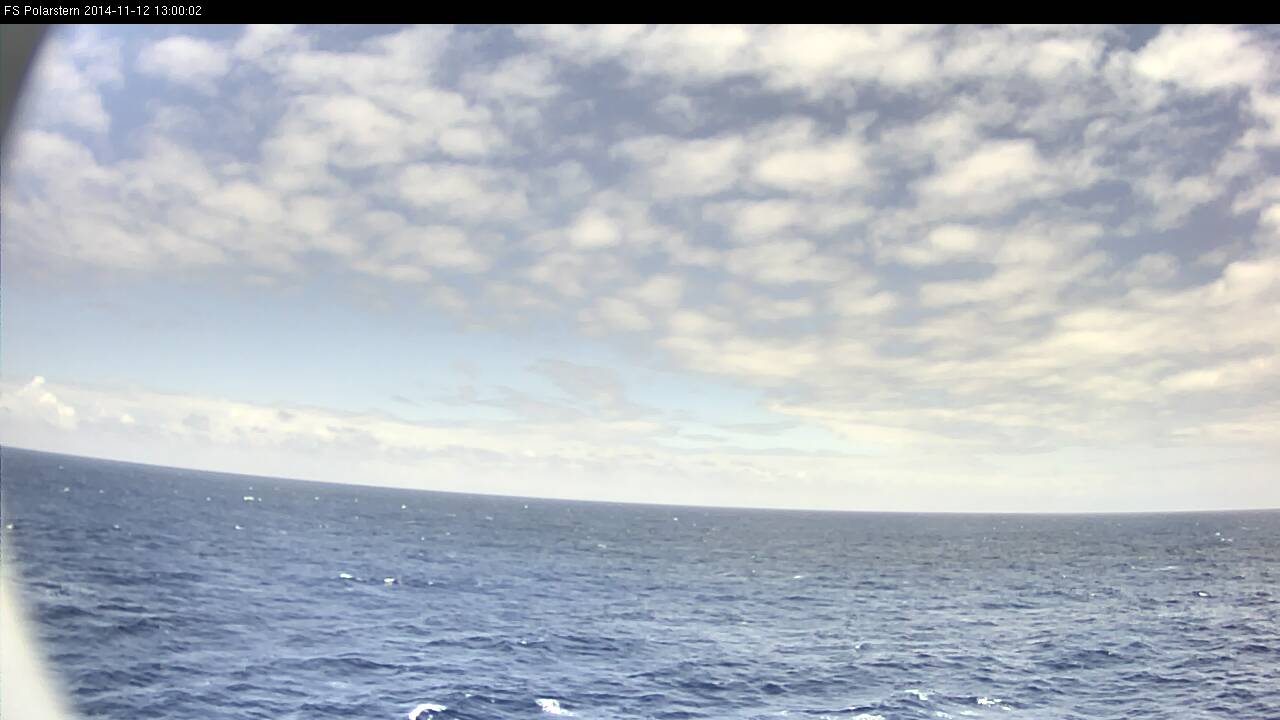
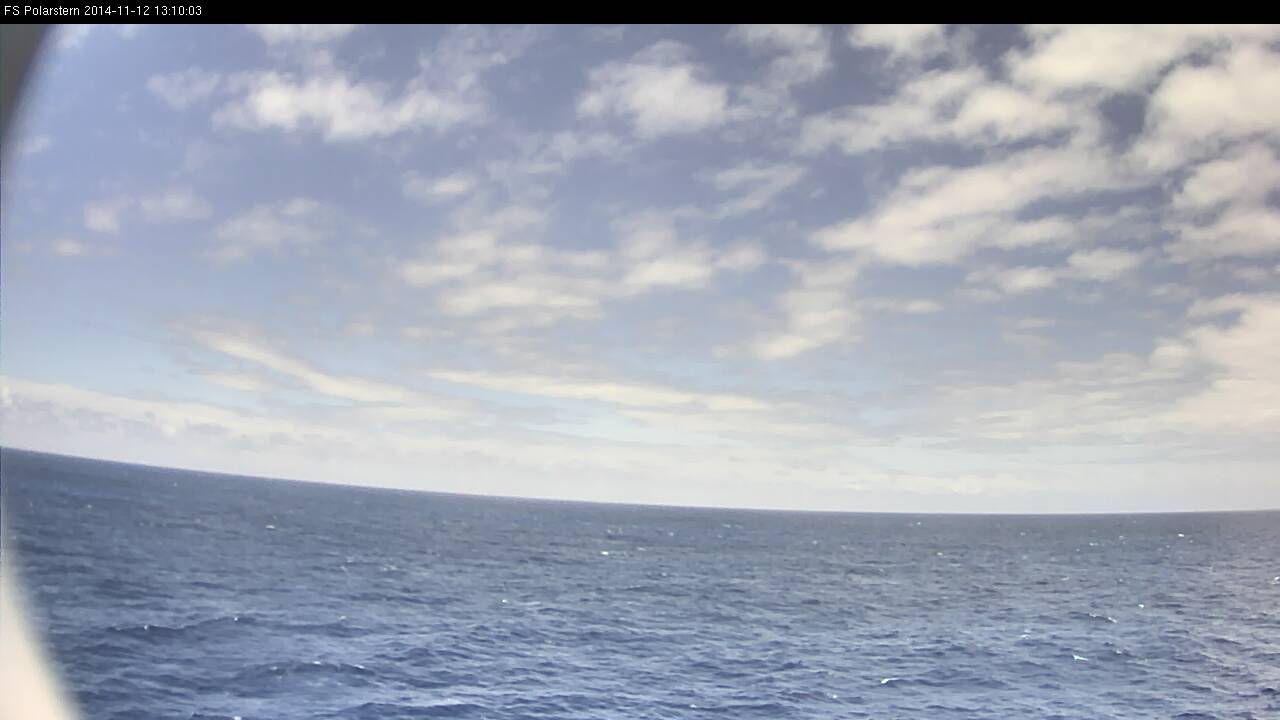
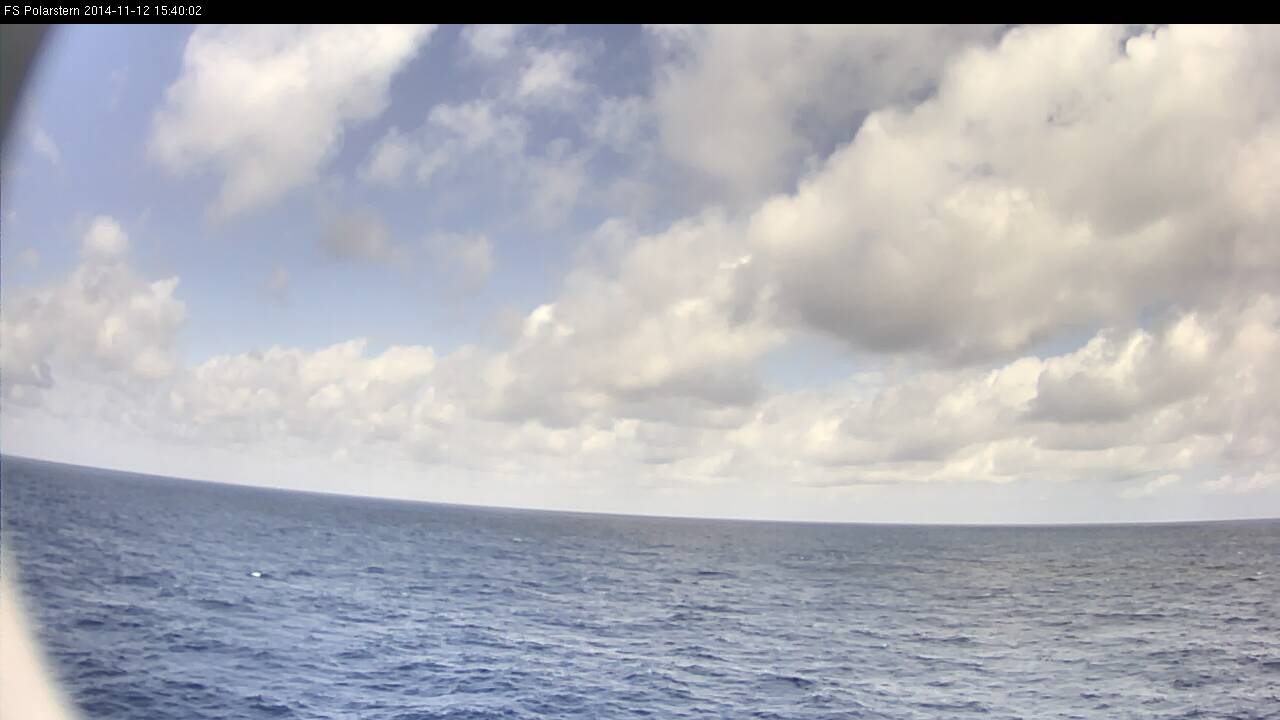
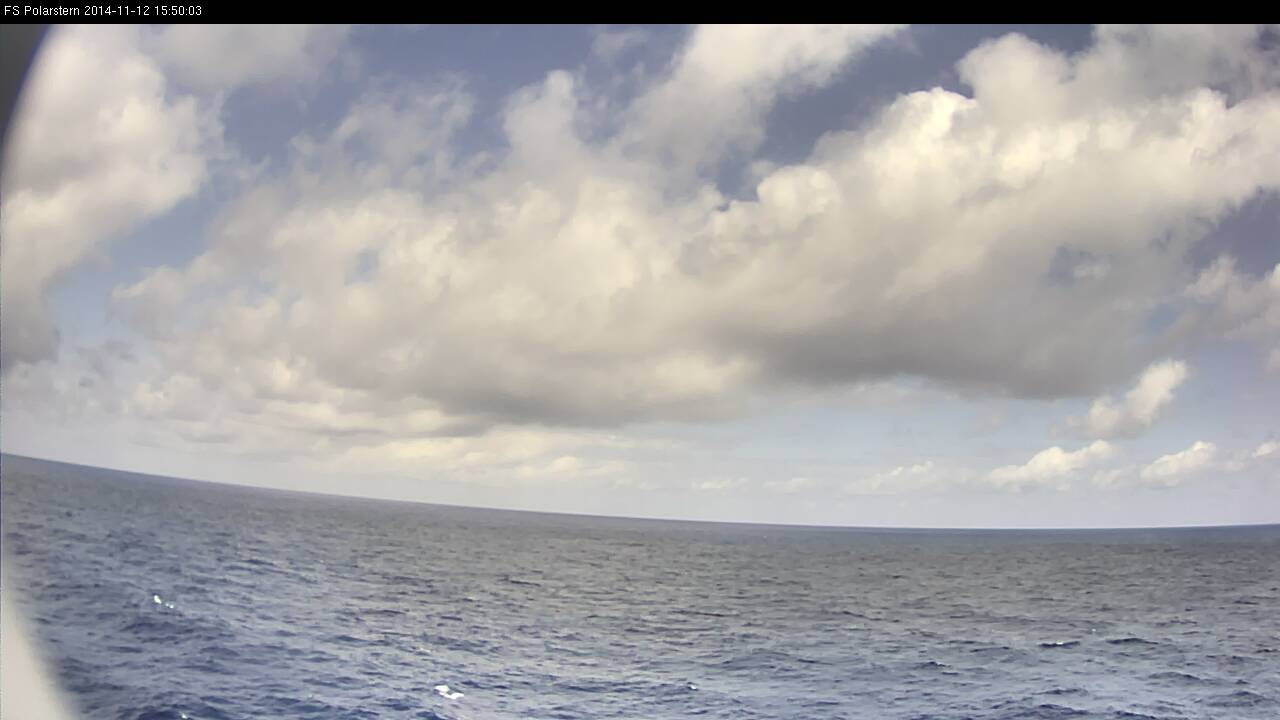
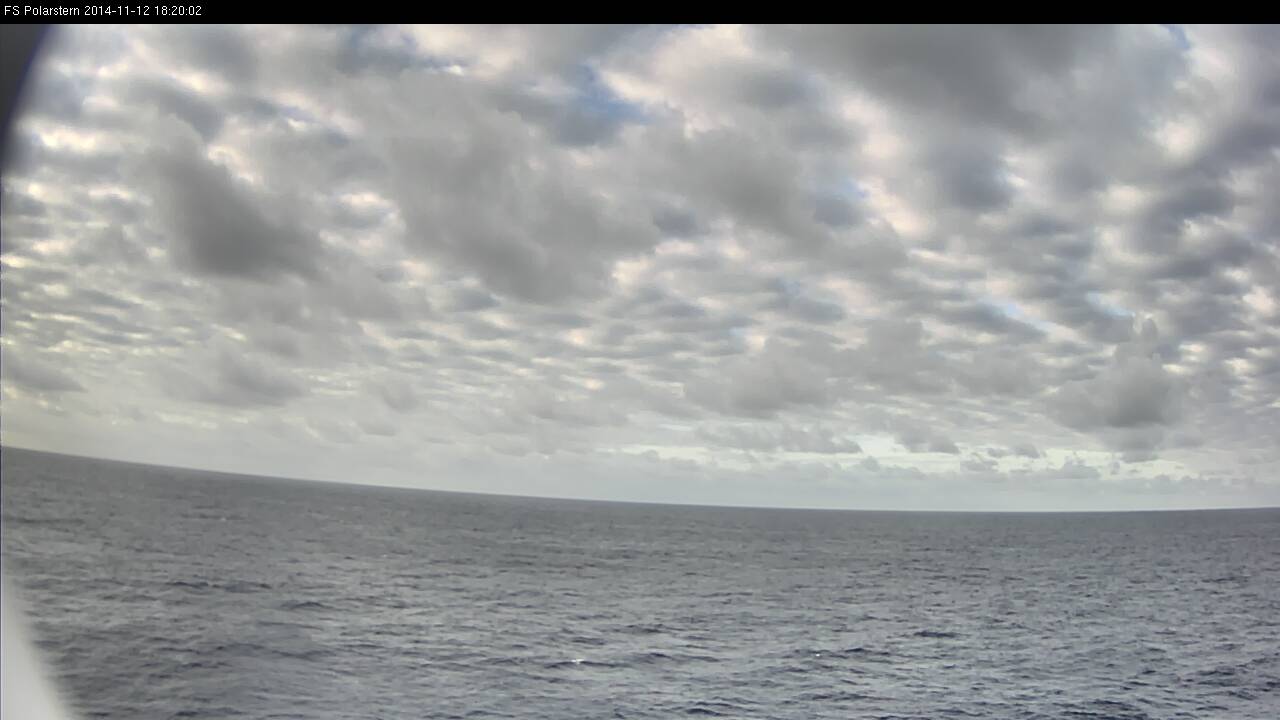
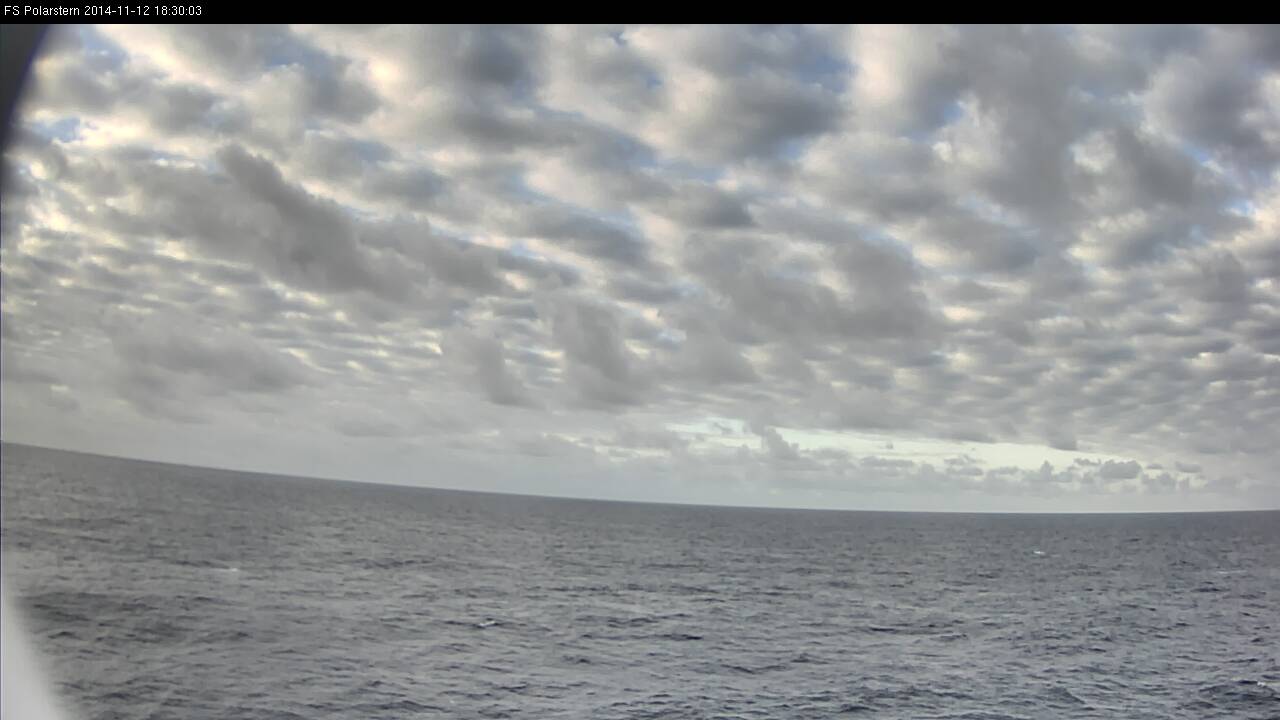
This loop shows all daytime webcam images on 12 Nov 2014 between 06:50 and 19:20 UTC.
Loop 7: Note - click on the loop to go through individual images
Links
Cruise reports from all expeditions. Click on Campaign, which you will find in the opening box of every Polarstern Anchor Dot.
http://www.pangaea.de/PHP/CruiseReports.php?b=Polarstern
Introduction to Tropical Meteorology, 2nd Edition (COMET - Meted)
https://www.meted.ucar.edu/training_course.php?id=18
Tropical Severe Local Storms (COMET - Meted)
https://www.meted.ucar.edu/training_module.php?id=995#.WAIibE2a3IU
Tropical Mesoscale Convective System (Comet - Meted)
https://www.meted.ucar.edu/training_module.php?id=993#.WAIiHU2a3IV
RGB Colour Interpretation Guide (EUMeTrain), Dust RGB
http://eumetrain.org/RGBguide/rgbs.html?page=1&sat=-1&rgb=Dust+RGB&colour=-1&phenom=-1&recent=false
RGB Colour Interpretation Guide (EUMeTrain), Severe Storms RGB or Severe Storms RGB
http://eumetrain.org/RGBguide/rgbs.html?page=1&sat=-1&rgb=Severe+Storms+RGB&colour=-1&phenom=-1&recent=false
Training Module: Operational use of RGBs Part 1 (EUMeTrain)
http://www.eumetrain.org/resources/operational_use_rgb.html
Training Module: Operational use of RGBs Part 2 (EUMeTrain)
http://www.eumetrain.org/resources/operational_use_rgb2.html
Webcast: Scatterometer Winds from ASCAT (EUMeTrain)
http://www.eumetrain.org/resources/scatterometer_winds_2011.html
Webcast: Polarstern and Satellite Data (with ASCAT)
http://www.eumetrain.org/resources/polarstern_and_satellite_data_2012.html
Instructions for the download of EUMeTrain's RGB Analysis tool
http://www.eumetrain.org/RGBguide/instructions.html