Chapter III: Description of the Synoptic Situation
Table of Contents
- Chapter III: Description of the Synoptic Situation
- Synoptic situation
- In-situ observations
- Numerical model output
Synoptic situation
On 1 August 2016, the Azores high was located over Azores and a thermal low was over Iberia and north-west Africa. Until 4 August, the Azores high moved towards the British Isles and intensified. This weather situation lead to warm and dry conditions over Madeira Archipelago and until 10 August the position of those systems allowed a dry and hot air mass from north-west Africa to reach Madeira (Fig. 3.1). On 4 August, at the middle and upper levels, Madeira started to be under the influence of a high pressure system and by 7 August, a low pressure system near the Canary Islands began moving westward until the 10th (Fig. 3.2). Throughout this period, the easterly or north-easterly winds prevailed at low levels and during some periods there were relatively large pressure gradients nearby Madeira, between the low over Canary Islands and the high pressure system near Azores. Fig. 3.3 shows values around 20/30kt (yellow barbs). Occasionally this area of strong winds extended from the surface up to 500 hPa level.
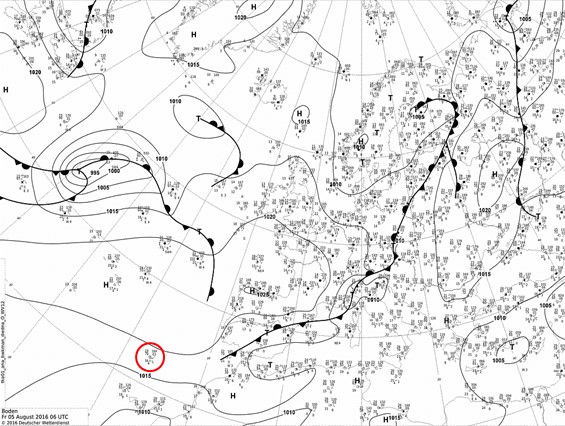
Figure 3.1: Surface analysis on 5 August 2016 at 06:00UTC by DWD. Red circle indicates the location of Madeira Island. Source: http://www1.wetter3.de/Archiv/archiv_dwd.html.
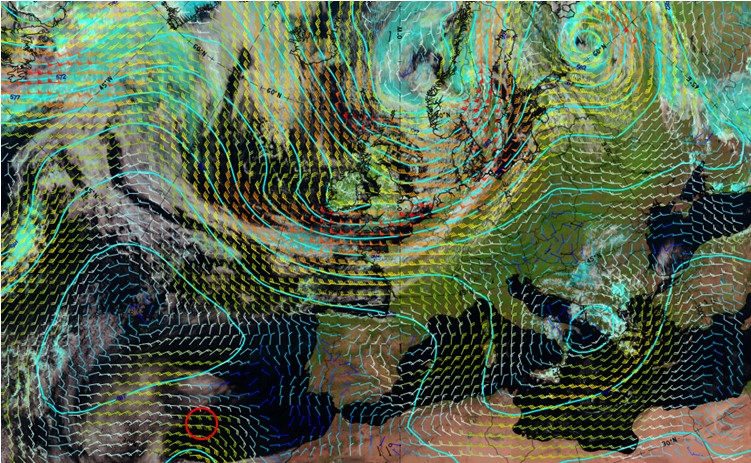
Figure 3.2: Geopotential height (damgp) and wind barbs (kt) at 500hPa (ECMWF) overlaid with Natural Color RGB on 8 August 2016 at 12:00UTC. Red circle indicates the location of Madeira Island. Source: ePort - EUMeTrain.
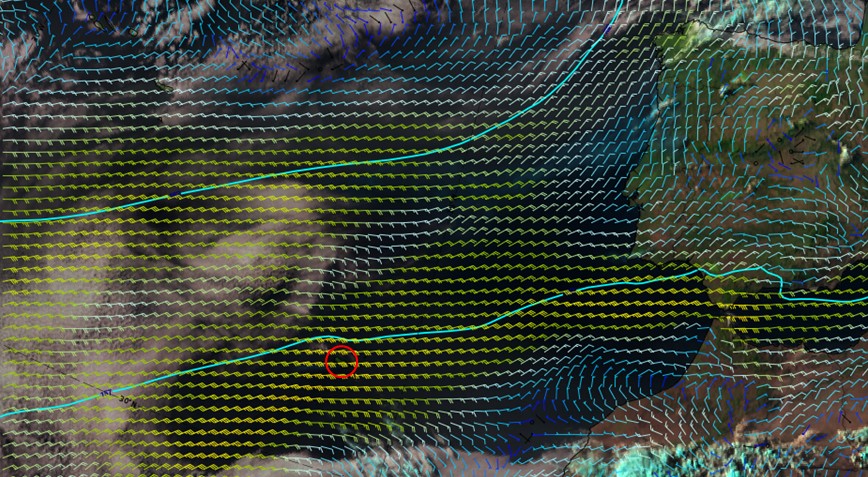
Figure 3.3: Geopotential height (dam) and wind barbs (kt) at 850hPa (ECMWF) overlaid with Natural Color RGB on 8 August 2016 at 18:00UTC. Red circle indicates the location of Madeira Island. Source ePort.
The south-east coast of Madeira Island, in the lee of the mountains, experienced warming and drying conditions from 4 to 10 August, with air temperature reaching 37 °C during the day and 34 °C during the night and relative humidity falling below 15% in Funchal Observatório. At this station, temperatures were observed to rise after sunset on 4 August, with a complementary decrease in relative humidity. From 8 to 10 August, the relatively warm and dry conditions persisted. Both events were accompanied by strong winds from the north-east.
In-situ observations
To better describe the event, observational data from some automatic weather stations were used. The data included measurements of temperature, relative humidity, wind (speed and direction) and gust. The position of these stations in relation to the major topographic features is shown in fig. 3.4 and additional information in table 3.1.
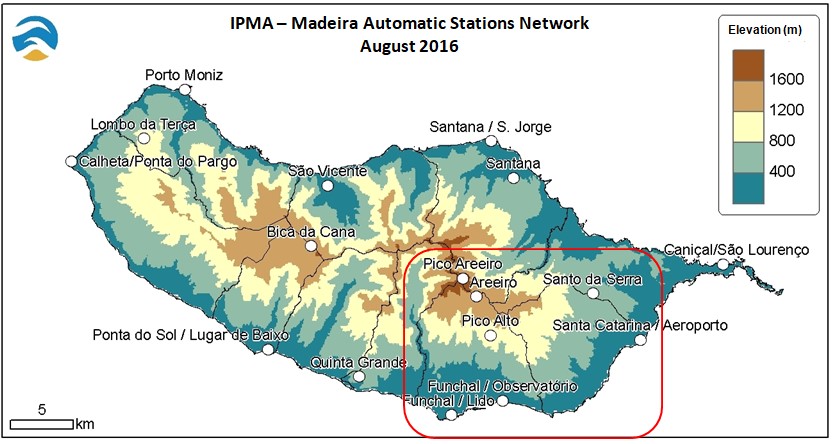
Figure 3.4: Madeira Automatic Stations network. Red square indicates the study area.
Table 3.1 - Weather Stations Metadata
| WMO ID n° | Weather Station Name | Elevation (m) | Latitude | Longitude |
|---|---|---|---|---|
| 08974 | Pico Areeiro | 1799 | 32°44'N | 16°55'W |
| 08973 | Areeiro | 1590 | 32°43'N | 16°54'W |
| 09972 | Pico Alto | 1118 | 32°42'N | 16°54'W |
| 08522 | Funchal Observatório | 58 | 32°38'N | 16°53'W |
| 08521 | Santa Catarina | 58 | 32°41'N | 16°46'W |
Temperature (fig. 3.5) and relative humidity (fig. 3.6) during this weather situation were consistent with two possible foehn events, from 4 to 6 August and 8 to 10 August. To distinguish foehn conditions at stations, three observational criteria were used: surface winds blowing from the direction of the mountains, an abrupt rise in air temperature and an accompanying reduction in atmospheric moisture.
The evolution of these parameters at lee stations were not the same, particularly for the first event, as near the coast (Funchal and S. Catarina) the changes happened earlier and were more obvious than at higher altitudes (Areeiro, Pico do Areeiro and Pico Alto). The second event lasted longer and occurred during the wildfires. Fig. 3.7 to 3.14 provide detailed data on the evolution of temperature, relative humidity and wind for Funchal. For this station, in both events, the observations of temperature and relative humidity exhibited anomalous maxima and minima and coincided with strong winds from the north-east, i.e. from the direction of the mountains.
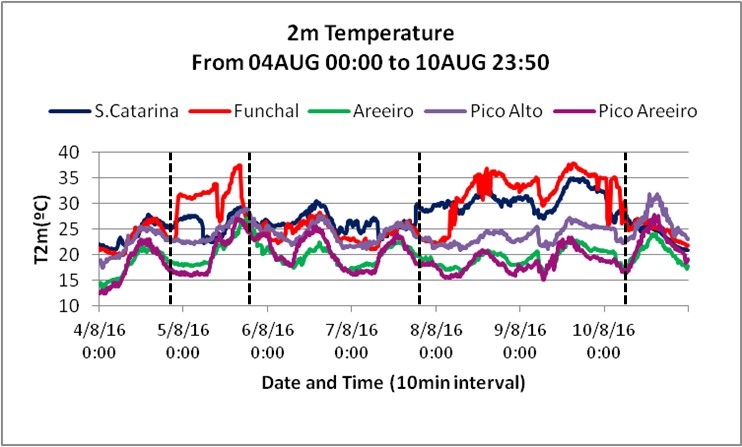
Figure 3.5: Time series of temperature at S.Catarina, Funchal, Areeiro, Pico Alto and Pico do Areeiro from 040000 to 102350 UTC. The dashed black vertical lines indicate the period when foehn-like conditions were most pronounced.
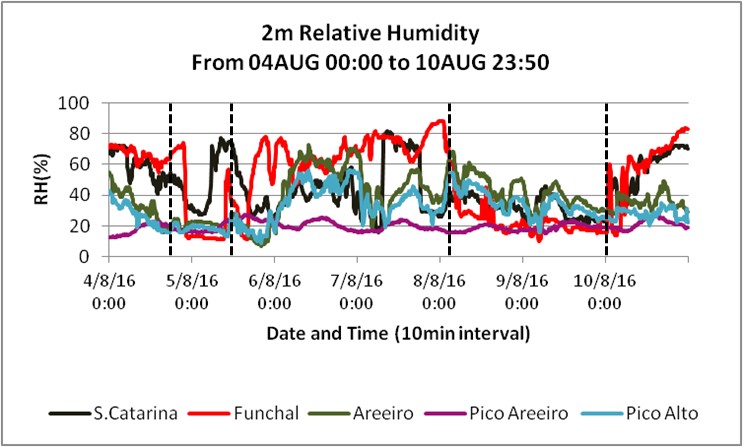
Figure 3.6: Time series of relative humidity at S.Catarina, Funchal, Areeiro, Pico Alto and Pico do Areeiro from 040000 to 102350 UTC. The dashed black vertical lines indicate the period when foehn-like conditions were most pronounced.
From 4 to 5 August, variations in temperature, relative humidity and wind were almost simultaneous and lasted about 12 hours (fig. 3.7 to 3.10)
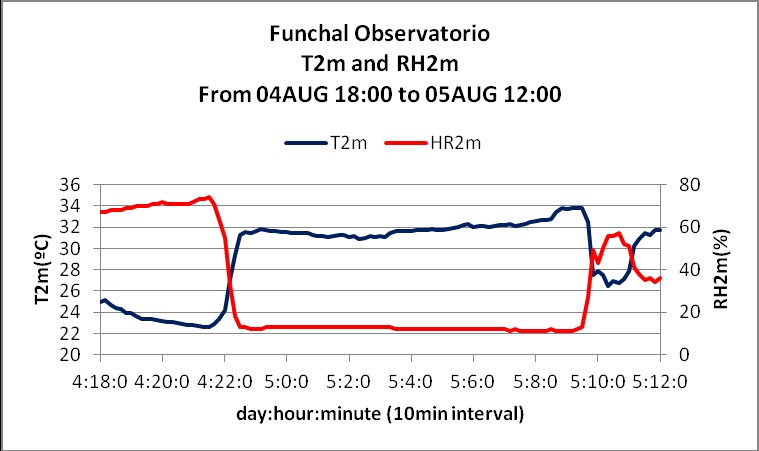
Figure 3.7: Time series of relative humidity and temperature at Funchal from 041800UTC to 051200UTC.
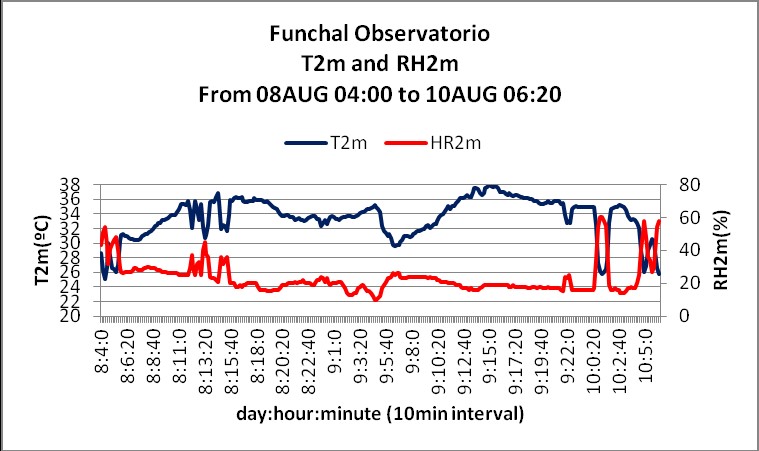
Figure 3.8: Time series of relative humidity and temperature at Funchal from 080400UTC to 100620UTC.
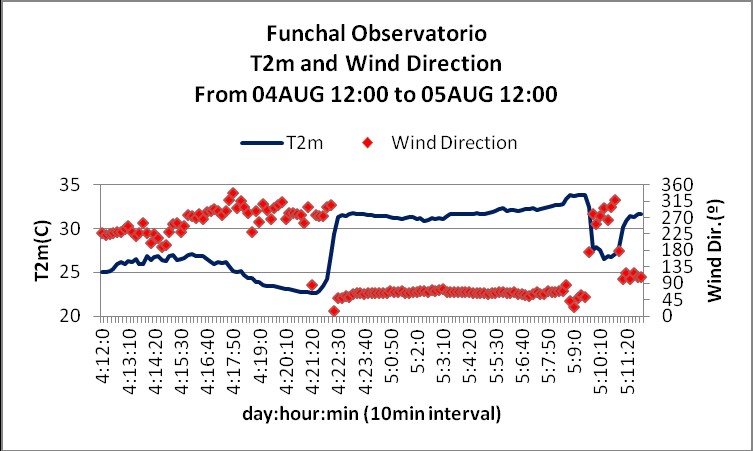
Figure 3.9: Time series of temperature and wind direction at Funchal from 041200UTC to 051200UTC.
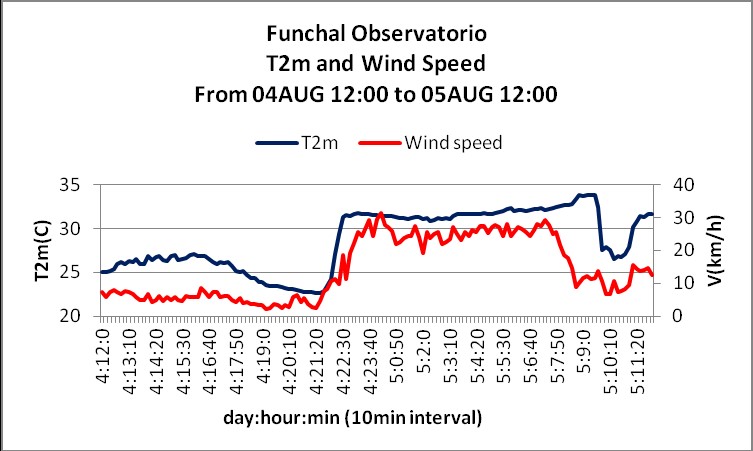
Figure 3.10: Time series of temperature and wind speed at Funchal from 041200UTC to 051200UTC.
The second event, from 8 to 10 August, lasted 48 hours but had some discontinuities in the foehn pattern. During these breaks, the wind blew from west or south-west, which in this weather station means cooler air at lower levels (fig. 3.11 to 3.14).
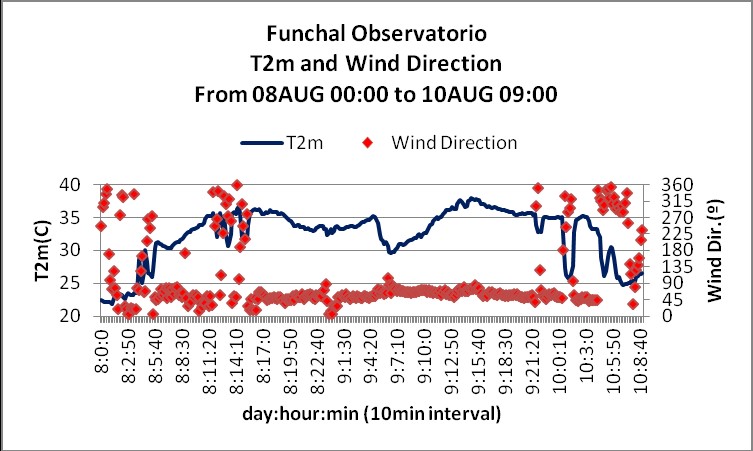
Figure 3.11: Time series of temperature and wind direction at Funchal from 080000UTC to 100900UTC.
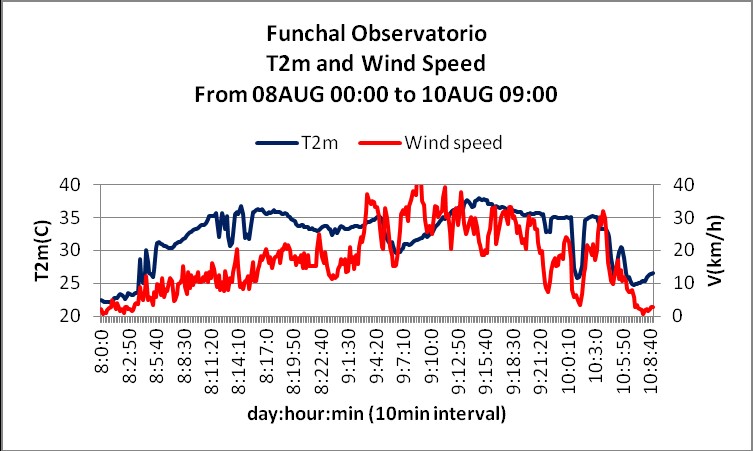
Figure 3.12: Time series of temperature and wind speed at Funchal from 080000UTC to 100900UTC.
Numerical model output
The numerical models used in this study were ECMWF and AROME which are of course quite different, the resolution being 9 km for the first and 2.5 km for the latter. Furthermore. the two other important differences for this case study are the orography and the land-sea mask for Madeira Archipelago. The real orography indicates that the highest mountain is 1862 m, while for ECMWF it is 709 m and for AROME 1611 m (fig. 3.15). Nevertheless, both models showed a generally good performance, with AROME giving more detail as expected.
The blocking of low-level air is known as one of the mechanisms for foehn formation and the Froude and M number results from AROME are consistent with this situation (table 3.2). These numbers were computed for two locations along the cross section, i.e. D80 and D95 (D is the distance, fig. 3.15).
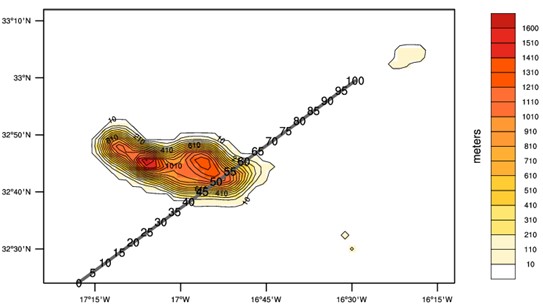
Figure 3.13: AROME Orography in plane and cross section along NE-SW direction.
The non-dimensional mountain height is defined by Jiang et al (2005) as:
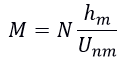
where hm is the model mountain height, N is the Brunt-Väisälä frequency (average below hm) and Unm is the cross-mountain wind speed (average below hm). The model mountain height, hm, is the mean model orography given by:
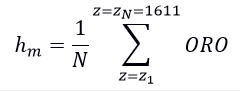
hm = 1055 m with z1=700 m (average height of the ridge above 700 m, represents about 43% of Madeira Island (fig. 3.16).
hm = 1417 m with z1=1300 m (average height of the ridge above 1300 m, includes 11 grid-points (fig. 3.16).
The Fr number used in table 3.2 is defined as:
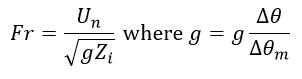
where Zi is the inversion base height, Δθ is the magnitude of the potential temperature difference across the inversion, θm is the mean potential temperature below the inversion base and Un is the cross-mountain wind speed (average below Zi).
The maximum value of N set the level of the inversion, thus allowing to know the base and the top of it.
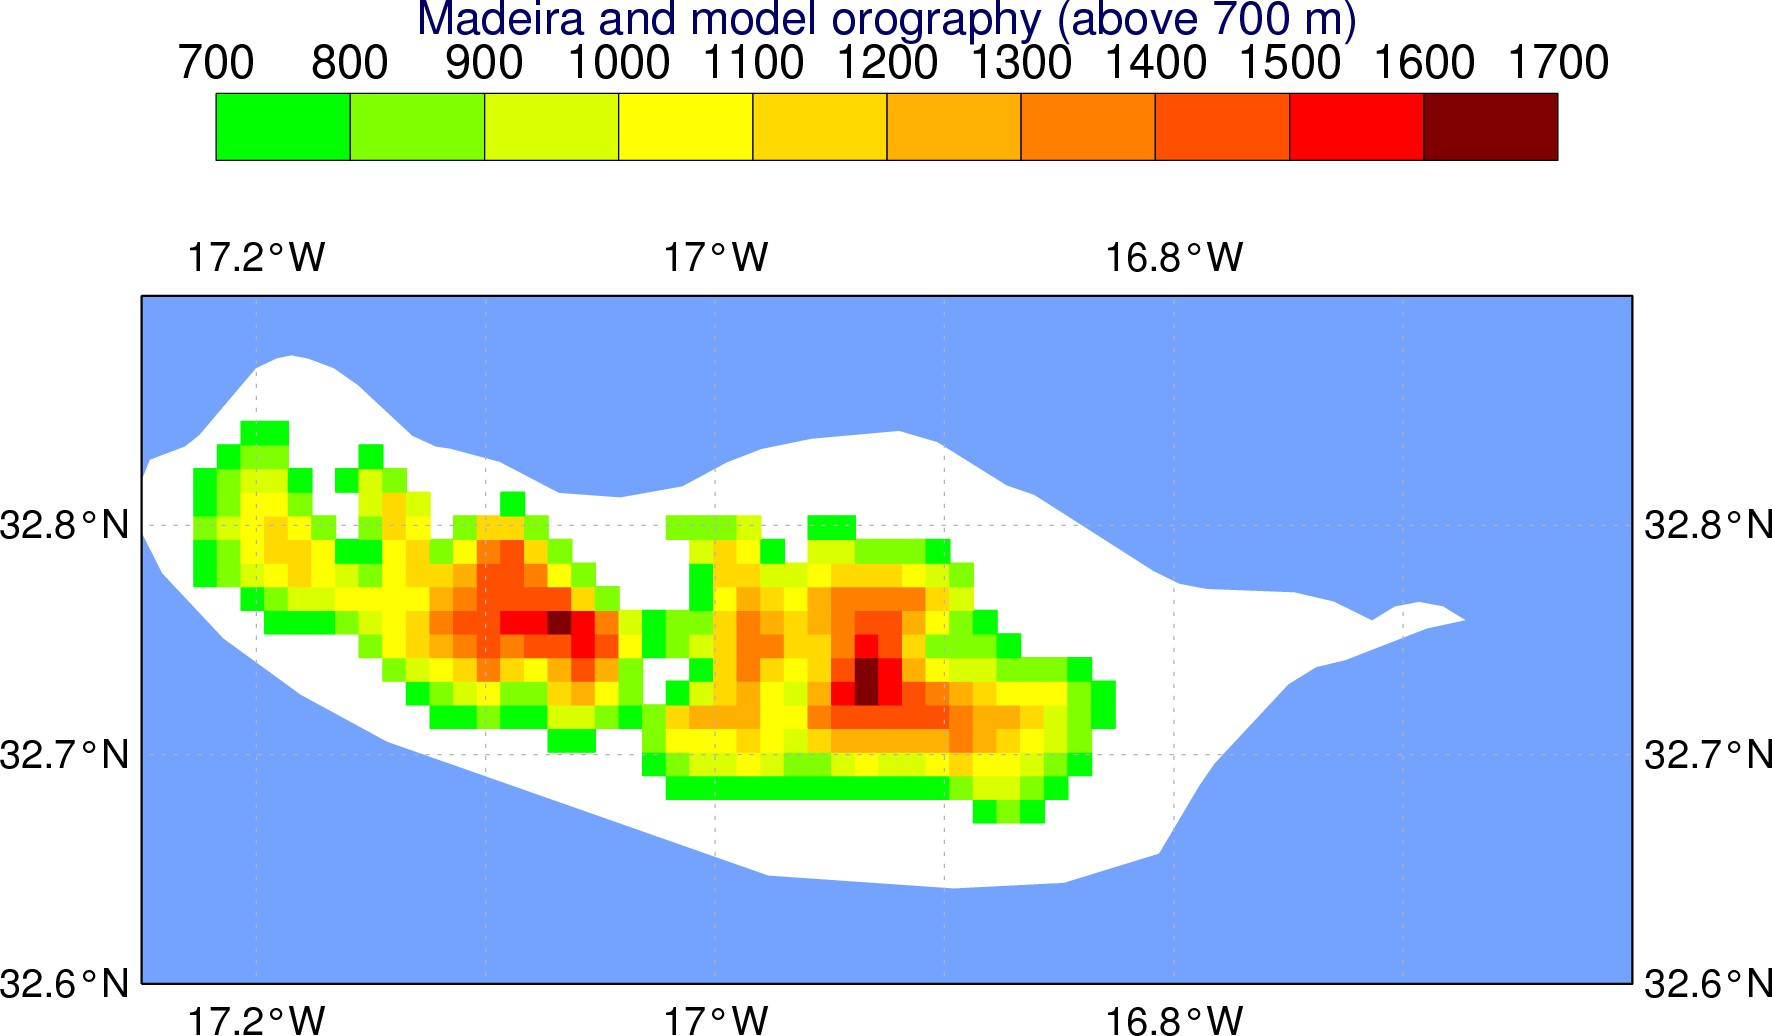
Figure 3.14: AROME orography above 700 m in Madeira Island.
Table 3.2 - Froude and 1/M numbers from AROME output. The values of hm were chosen according to model's orography.
| Zi | Fr | 1/M (hm = 1417 m) |
1/M (hm= 1055 m) |
|
|---|---|---|---|---|
| D80 (cross-section) | 502 | 0.43 | 0.47 | 0.58 |
| D95 (cross-section) | 490 | 0.64 | 0.54 | 0.7 |
The values < 1 for both Fr and 1/M are consistent with a subcritical flow in a statically stable atmosphere. In this situation, a region of deceleration flow is expected, in which the air is blocked and must go around the mountain or be turned back.
In fig. 3.17 to 3.20, the AROME output for one of the foehn events is shown and the cross-section is represented in fig. 3.15.
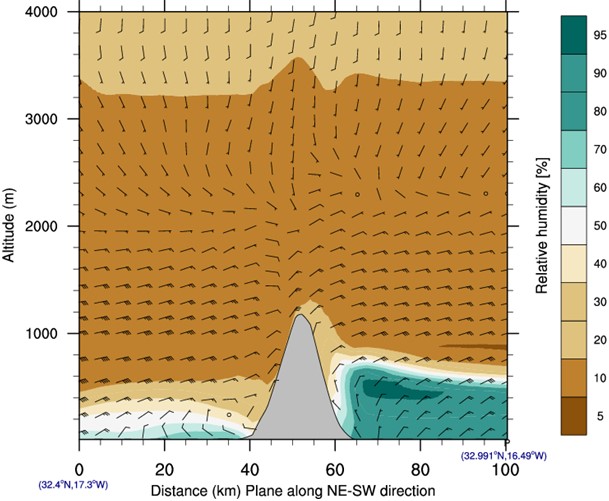
Figure 3.15: Vertical cross-section derived from AROME (direction in fig. 3.15) for relative humidity (%) and wind (kt) at 050300UTC from 050000UTC run.
The first foehn event most evident in the data from Funchal occurred during the night of 4 to 5 August. At that time the intercept of the isentropes (θ < 304 K and Z < 750m) with the mountain suggests flow blocking to the north (fig. 3.18) and the tilting of the isentropes indicates the warmer air at the lee side. Fig. 3.17 also indicates an area of cool and moist low-level air on the windward side of the mountain and a much drier on the opposite side. The data also suggest light winds (~5kt below 750m) on the windward side, which can represent the area of stagnant air. One interesting feature seen in the cross section is a topographically induced vertically propagating wave at the time the foehn-like conditions were observed. The isentropes represented in fig. 3.18 indicate also a sharper descent over the lee slope, which is consistent with subsidence.
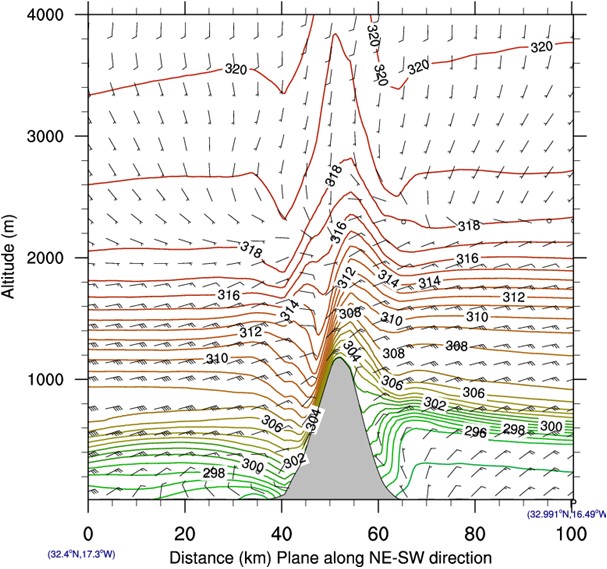
Figure 3.16: Vertical cross-section derived from AROME (direction in fig. 3.15) for potential temperature (K) and wind (kt) at 050300UTC from 050000UTC run.
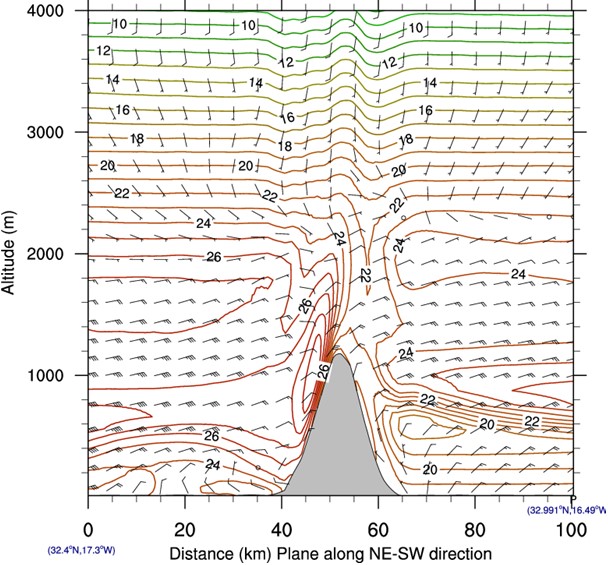
Figure 3.17: Vertical cross-section derived from AROME (direction in fig.3.15) for temperature (Celsius) and wind (kt) at 050300UTC from 050000UTC run.
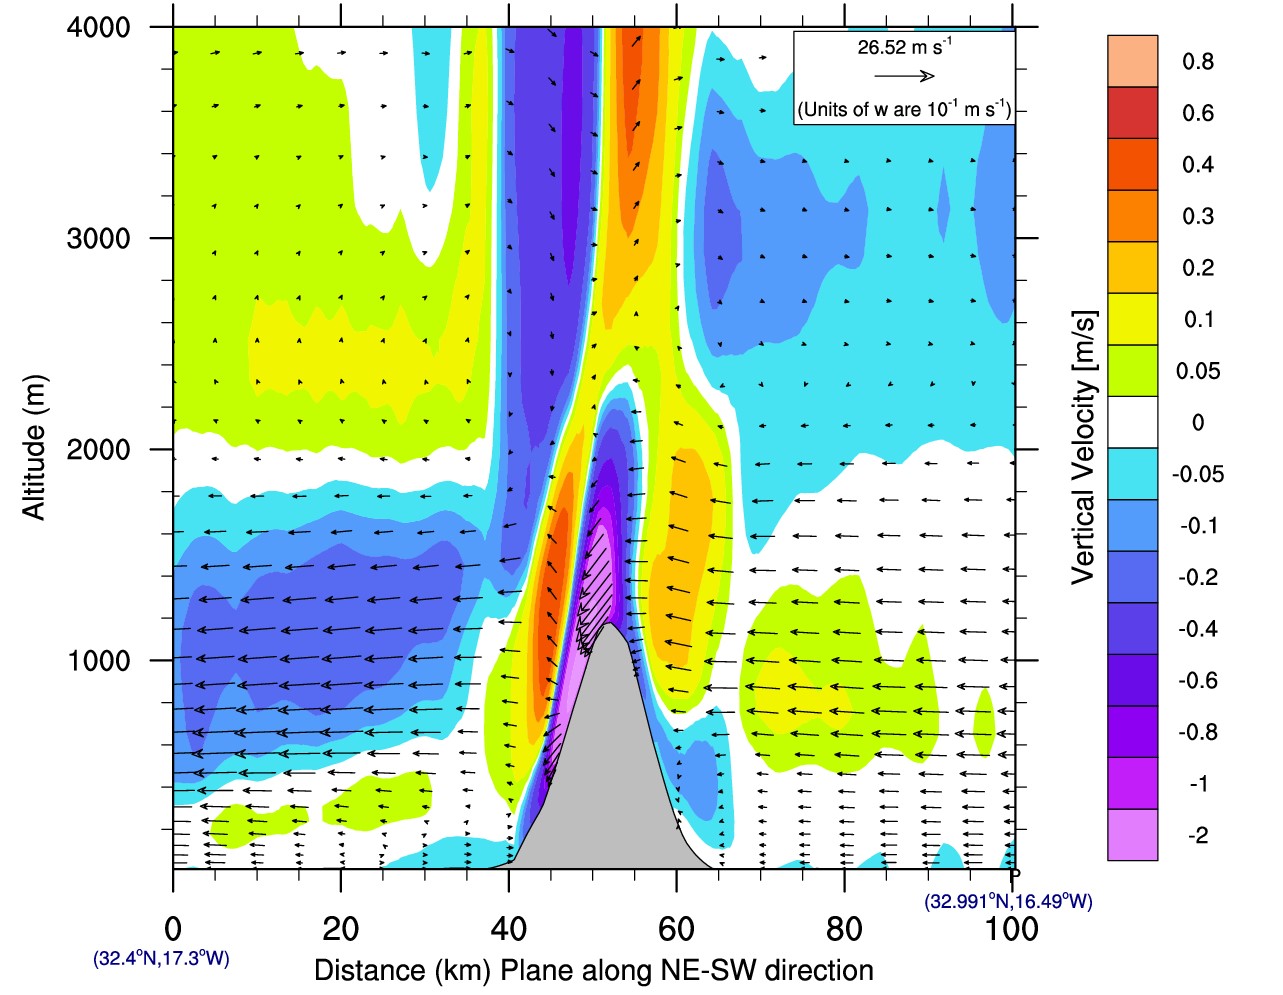
Figure 3.18: Vertical cross-section derived from AROME (direction in fig. 3.15) for vertical velocity (shaded) and cross-barrier wind (arrows) at 050300 UTC from 050000 UTC run.
In fig. 3.20, the vertical velocity shows subsidence or negative values at the lee side of the mountain (purple colours) and at the upwind side below ~700 m (blue colours) and these values are consistent with the cross-barrier wind arrows shown.
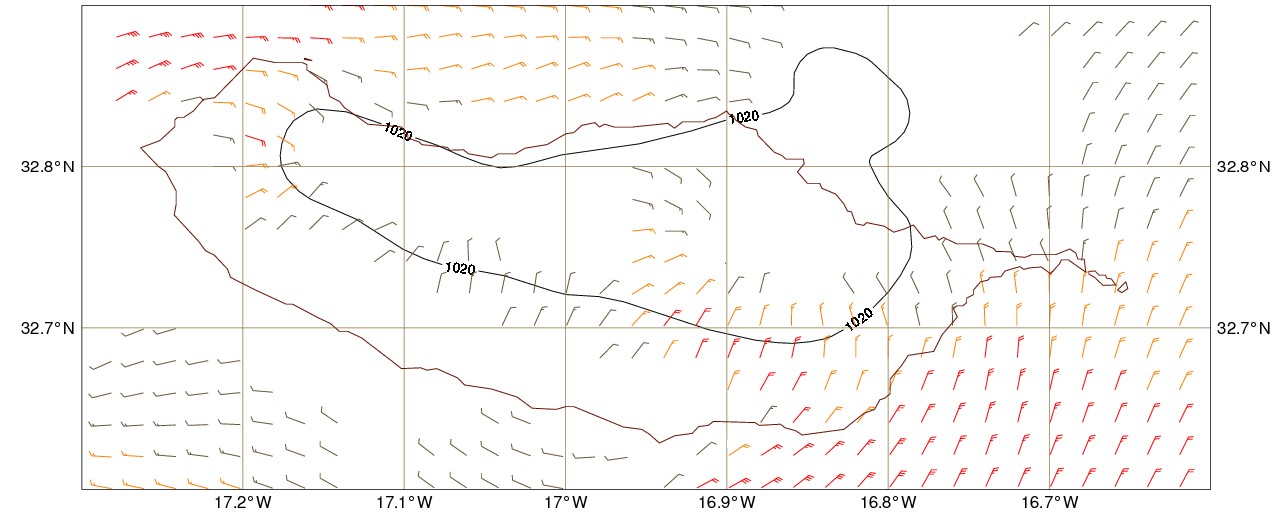
Figure 3.19: Mean sea level pressure (hPa) and surface wind (barbs) derived from AROME at 050300UTC from 050000UTC run.
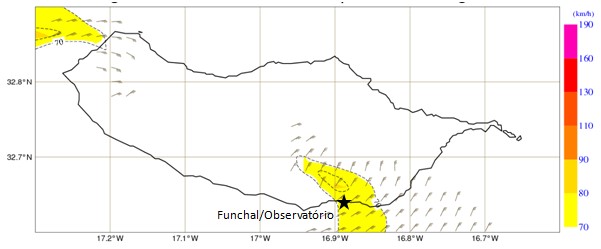
Figure 3.20: Wind gust (barbs and gust speed in shaded in km/h) derived from AROME at 050300UTC from 050000UTC run. The star shows the location of weather station Funchal/Observatório.
In fig. 3.21 and 3.22, AROME shows, in the south-east area of Madeira Island, an increase in both wind speed and gust speed. The maximum wind gust detected by Funchal Observatório during this 3 hour period was around 62 km/h.