Satellite fire products
The Fire Radiative Power (FRP [MWatts]) is a product derived from satellite that records information about the location, timing and the amount of radiant heat energy released per unit time from the burning vegetation and/or organic soils present within a pixel. From 8 to 10 August 2016, several hot spots were detected in the area of Madeira Island.
The FRP product, available from the LSA SAF (http://lsa-saf.eumetsat.int/), is derived every 15 min at the native SEVIRI pixel spatial resolution and across the full SEVIRI imaging disk. It is based on the Wooster et al. (2003) "MIR radiance method" of FRP derivation adapted for use with geostationary systems. The same method is used within the Collection 6 EOS-MODIS Fire Products (MOD14 and MYD14) generated by NASA.
The high temporal frequency of MSG observations allows to detect a fire at a very early stage and to monitor its development.
The location of the fires as detected by the LSA SAF FRP product for Madeira Island from 8 to 10 August is shown in fig. 4.7.
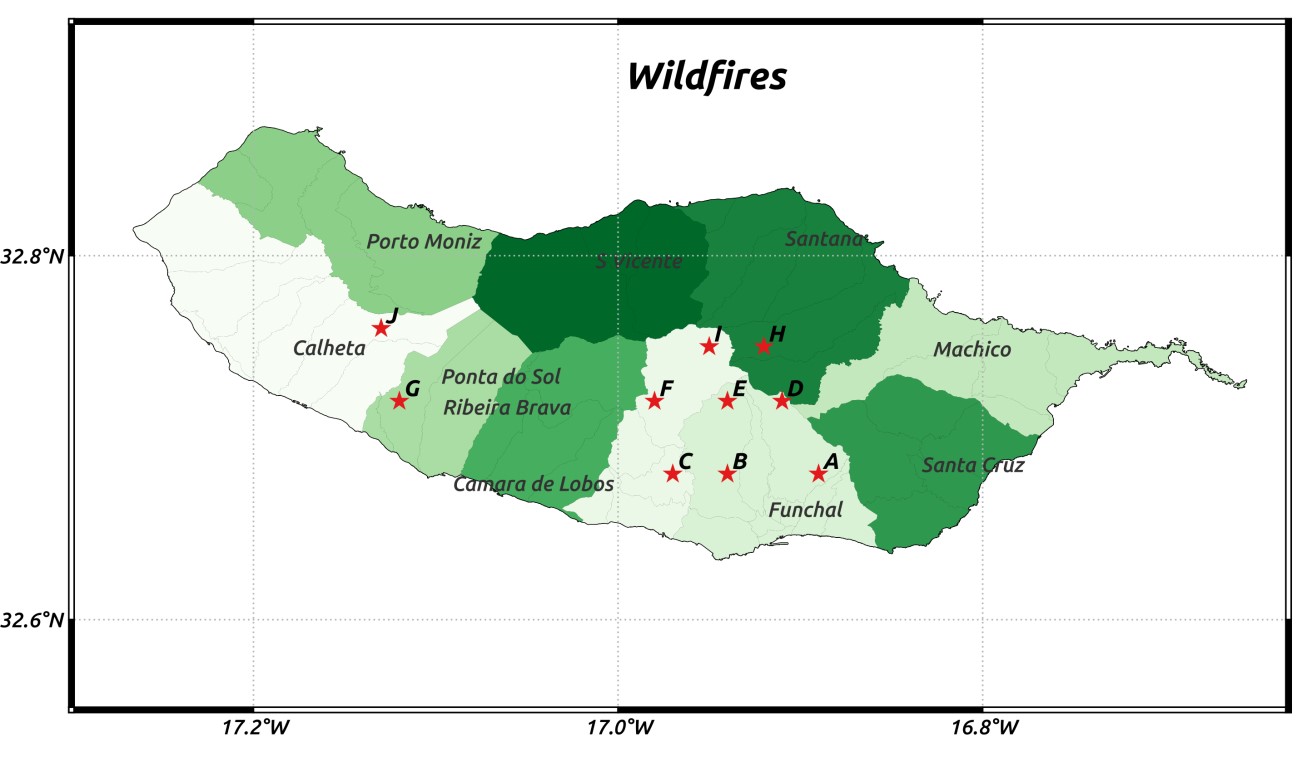
Figure 4.7: Location of fires detected in Madeira Island from 8 to 10 August by the LSA SAF Fire Radiative Power product.
Fig. 4.8 and 4.10 show the FRP values for each of the locations A to J, plotted every 15 min., from 8 to 10 August.
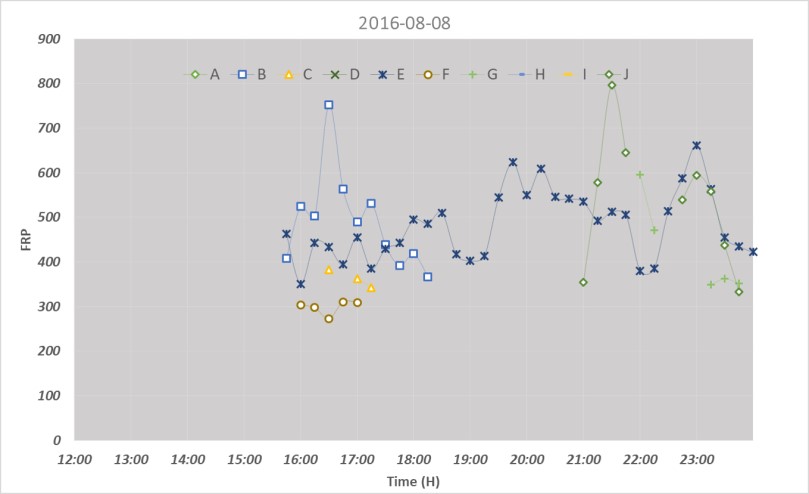
Figure 4.8:FRP values for each of the locations A to J presented in fig. 4.7, as detected by the LSA SAF FRP product (MW/m2), every 15 min., 8 August.
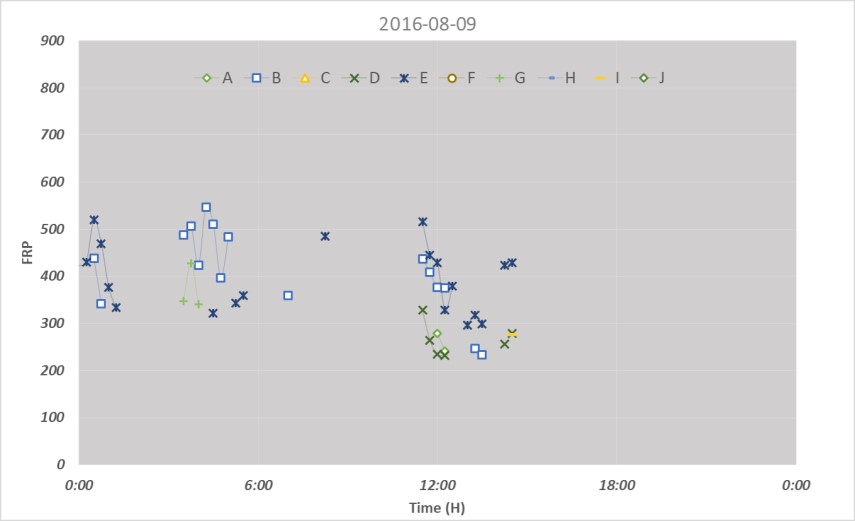
Figure 4.9:FRP values for each of the locations A to J presented in fig. 4.7, as detected by the LSA SAF FRP product (MW/m2), every 15 min., 9 August.
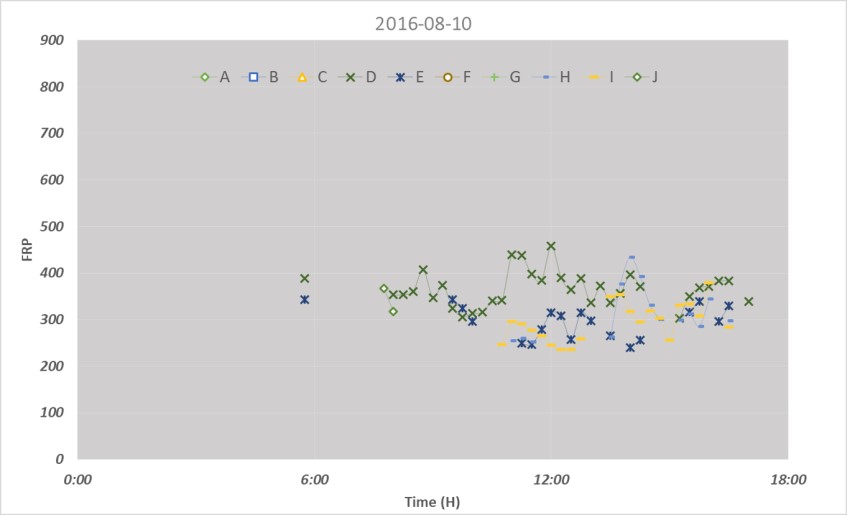
Figure 4.10: FRP values for each of the locations A to J presented in fig. 4.7, as detected by the LSA SAF FRP product (MW/m2), every 15 min., 10 August.
From these figures we can reach conclusions about the intensity and duration of the detected fires during the study period:
- The fires were first detected by satellite (i.e, by the LSA SAF FRP MSG product) at 15:45 UTC on 8 August;
- Fires at locations B and E were identified on 8 August and continued through the next day;
- The strongest fires occurred on 8 August (locations B and J);
- Persistent fires were observed at locations D and E;
- The detected fires were generally weaker on 10 August.
It has been demonstrated in small-scale experimental fires that the amount of radiant heat released in a fire per unit time (i.e. the Fire Radiative Power) correlates to the rate at which fuel is being consumed. This is a result of the combustion process, whereby carbon-based fuel is oxidised to CO2 (and other gaseous and particulate products), with the accompanying release of a certain 'heat yield'. Measuring FRP and integrating it over the lifetime of a fire provides an estimate of the total Fire Radiative Energy (FRE) released, which for landscape fires should be proportional to the total amount of biomass burned (https://landsaf.ipma.pt/en/products/fire-products/frppixel/).
Fig. 4.11 to 4.13 show the energy released for each of the fires, per day, in MJ/m2.
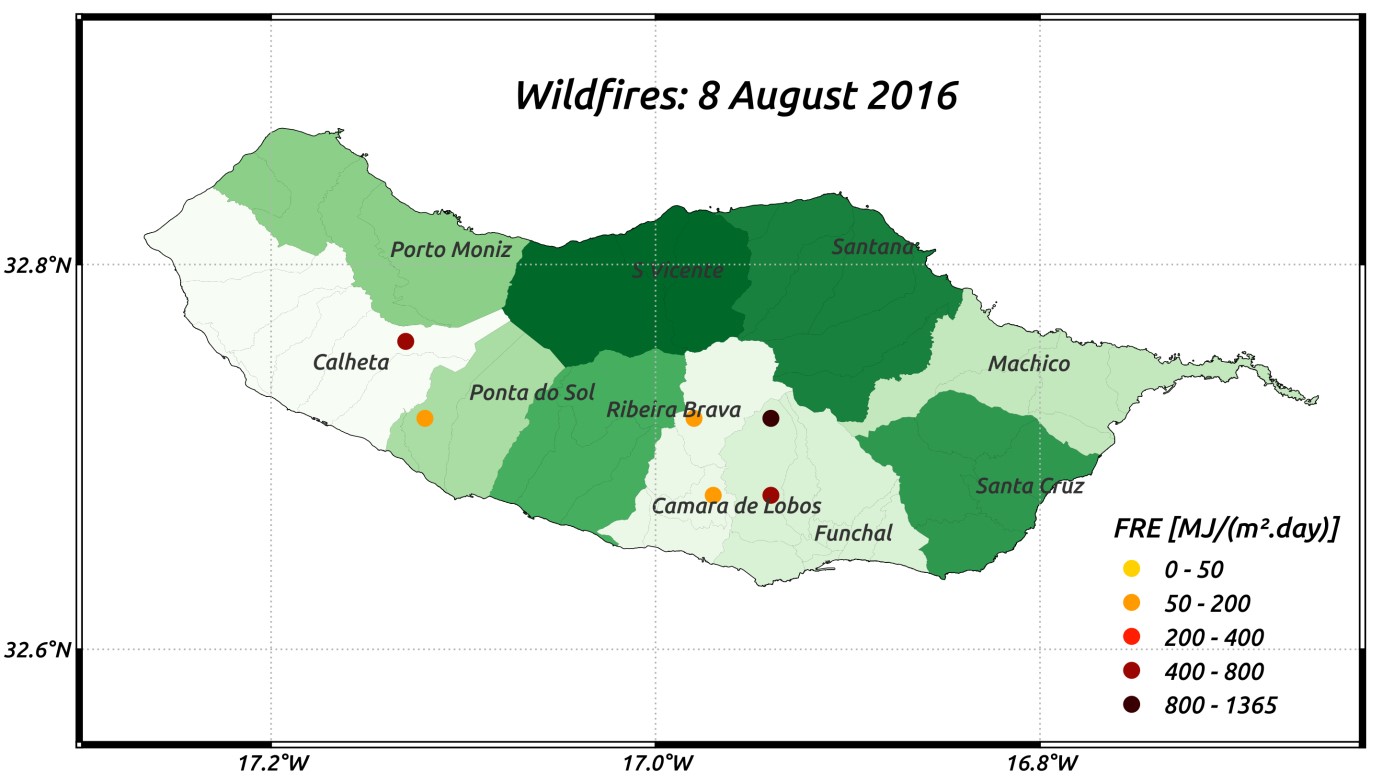
Figure 4.11: Daily radiative energy released by landscape fires in Madeira Island, 8 August 2016, in MJ/m2 day).
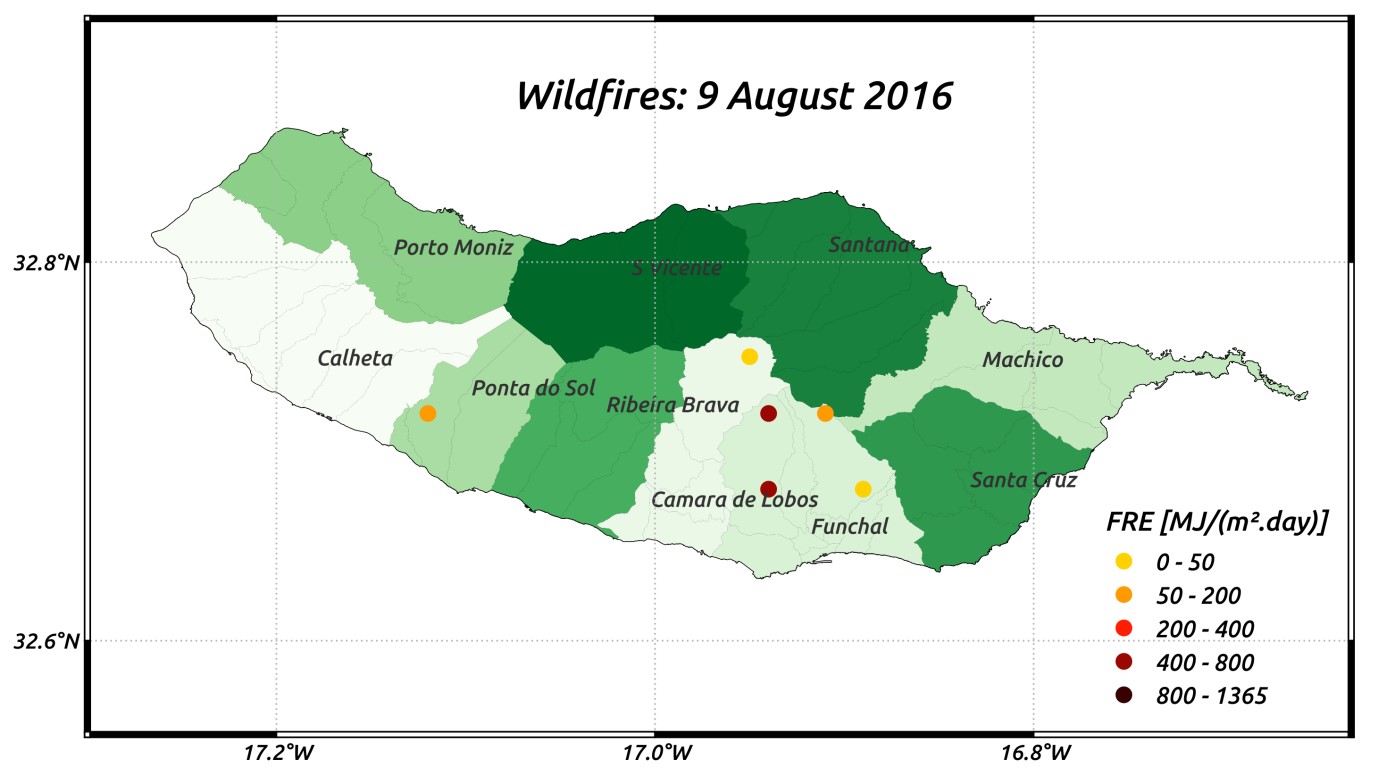
Figure 4.12: Daily radiative energy released by landscape fires in Madeira Island, 9 August 2016, in MJ/m2 day).
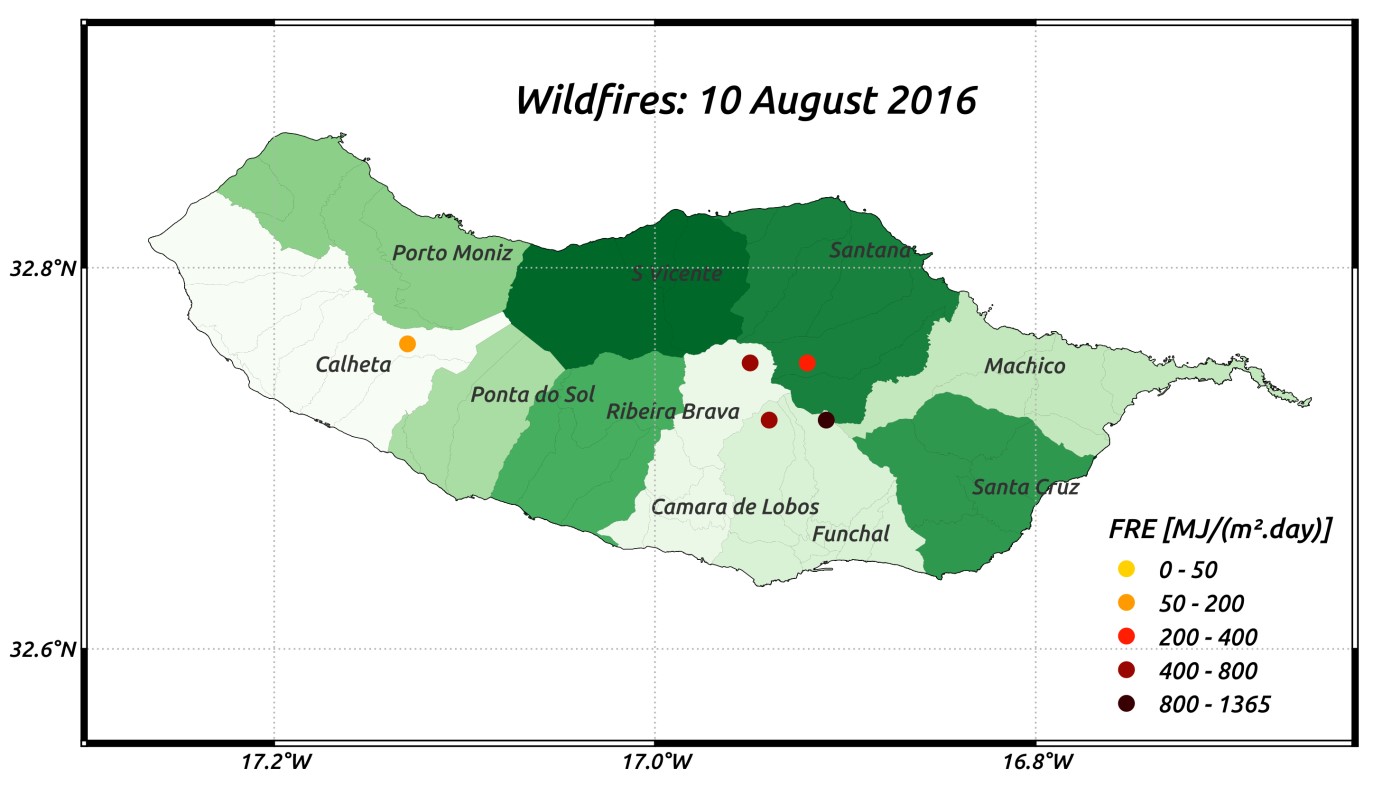
Figure 4.13: Daily radiative energy released by landscape fires in Madeira Island, 10 August 2016, in MJ/m2 day).
The FRP approach therefore provides an alternative to computing wildfire fuel consumption through methods that rely on the mapping of burned area and assuming, measuring or modelling the supposed fuel consumption per unit area. The Global Fire Assimilation System (GFAS) used in the Copernicus Atmosphere Monitoring Service assimilates fire radiative power (FRP) observations from satellite-based sensors to produce daily estimates of biomass burning emissions.
The impact of the fires on the vegetation cover was analysed by computing anomalies of the Fraction of Vegetation Cover product from the LSA SAF (FVC) for a 10-day period before (21-31 July) and after (21-31 August) the fire events. The anomalies were computed taking into account the years 2004-2016 as a reference.
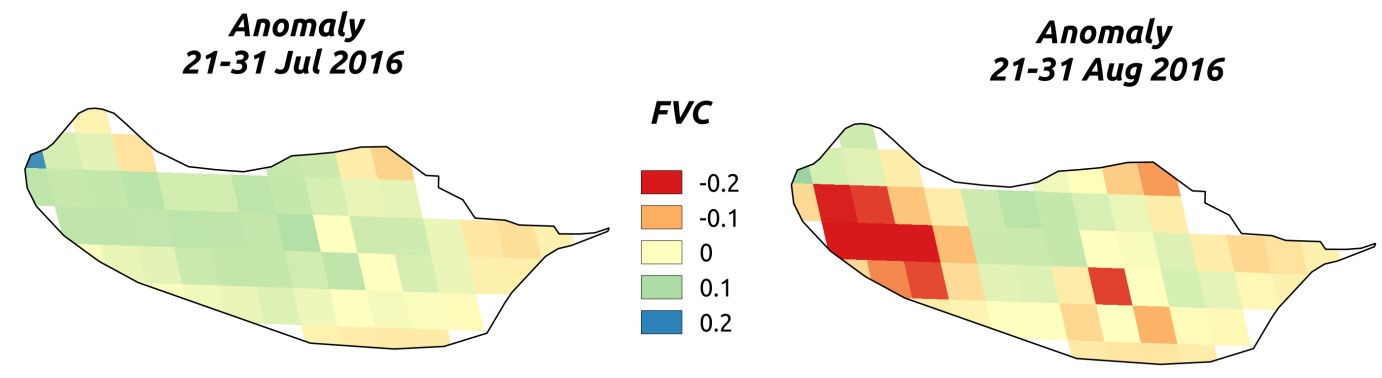
Figure 4.14: Anomalies of LSA SAF FVC for a 10-day period before (21-31 July) and after (21-31 August) the fire events.
The data show a negative anomaly on the FVC after the fire events, mainly in the regions of Funchal and the south-western part of the island. Yet, in the latter region, no fires have been detected by the LSA SAF FRP product. The reason for this may be that the fires were not large or hot enough to be detected in the ~4 km2 of the SEVIRI footprint. In that case, the MODIS FRP product can be used to verify if some hot spots have been detected by the ascending and descending passages of Terra or Aqua satellites. The great advantage of the MODIS FRP product is that it can detect small fires (in optimal - but rare - conditions this can be ~50 m2). On the other hand, it can miss a fire that started and ended between satellite overpasses.
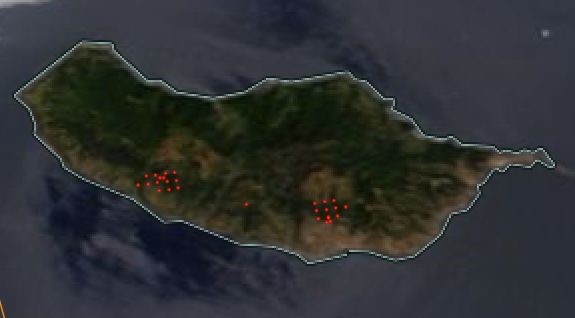
Figure 4.15: Fire pixels as detected by MODIS (AQUA and TERRA) and VIIRS (Suomi NPP) on 8 August. The underlying RGB true color image corresponds to MODIS Terra, and was obtained from corrected reflectance imagery (bands 1 4 3 | red, green, blue) at a 250 m spatial resolution. Source: https://worldview.earthdata.nasa.gov.
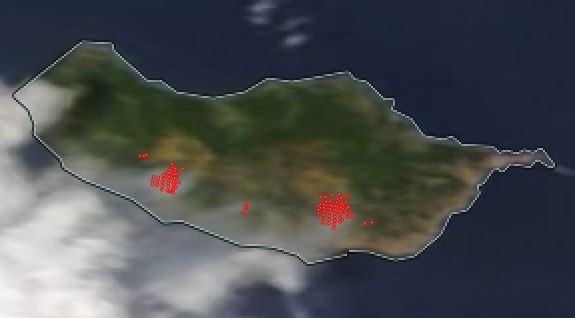
Figure 4.16: Fire pixels as detected by MODIS (AQUA and TERRA) and VIIRS (Suomi NPP) on 9 August. The underlying RGB true color image corresponds to MODIS Terra, and was obtained from corrected reflectance imagery (bands 1 4 3 | red, green, blue) at a 250 m spatial resolution. Source: https://worldview.earthdata.nasa.gov.
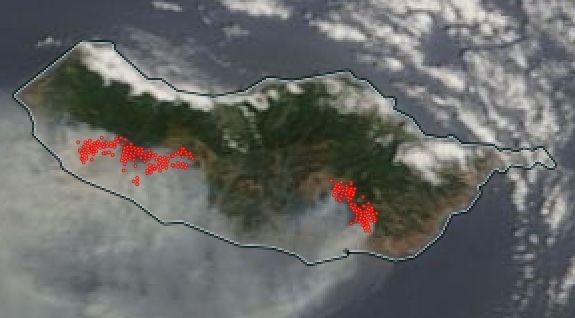
Figure 4.17: Fire pixels as detected by MODIS (AQUA and TERRA) and VIIRS (Suomi NPP) on 10 August. The underlying RGB true color image corresponds to MODIS Terra, and was obtained from corrected reflectance imagery (bands 1 4 3 | red, green, blue) at a 250 m spatial resolution. Source: https://worldview.earthdata.nasa.gov.
As seen in Fig. 4.15 to 4.17, several pixels were classified as hot spots, even under cloud/smoke conditions.
Comparison of the true color MODIS images from 5 August (before the fires) and 14 August (just after the fires), shows the presence of a brown region that coincides with the FVC negative anomaly for the 21-31 August decade.
|
|
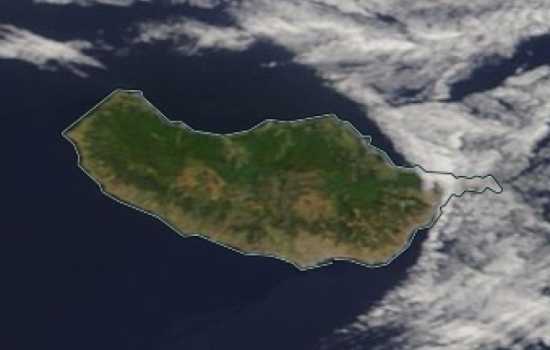
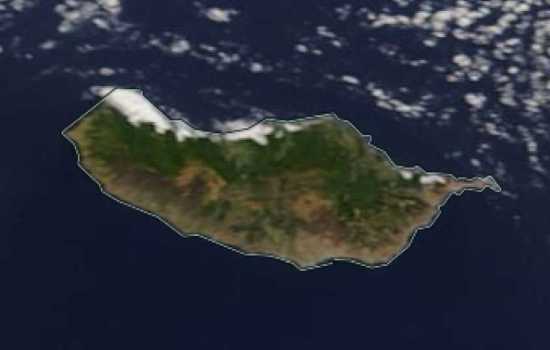
Figure 4.19: The true color MODIS image from 14 August reveals a brownish area that was not seen on 5 August, highlighting the effect of the fires that hit Madeira Island form 8 to 10 August.
Fig. 4.18 and 4.19 - The true color MODIS image from 14 August reveals a brownish area that was not seen on 5 August, highlighting the effect of the fires that hit Madeira Island form 8 to 10 August.
Aerosol Optical Depth (AOD, or Aerosol Optical Thickness) can be used to estimate the amount of smoke in the atmosphere. AOD is a 'non-dimensional' quantity (it having no units of measurement), so higher values of AOD indicate more aerosols, like smoke particles, in the air. An AOD value near 1 indicates quite hazy conditions. If AOD values approach the range of 2 or 3, this would be like being under the ash cloud from a volcanic eruption only a few Km away. AOD indicates the level at which particles in the air (aerosols) prevent light from travelling through the atmosphere. Fig. 4.20 shows the AOD from MODIS /AQUA on 10 August. The dark red colours correspond to AOD values between 0.695 and 1.990. The highest AOD values follow the smoke cloud seen in the MODIS RGB True colour image in the background.
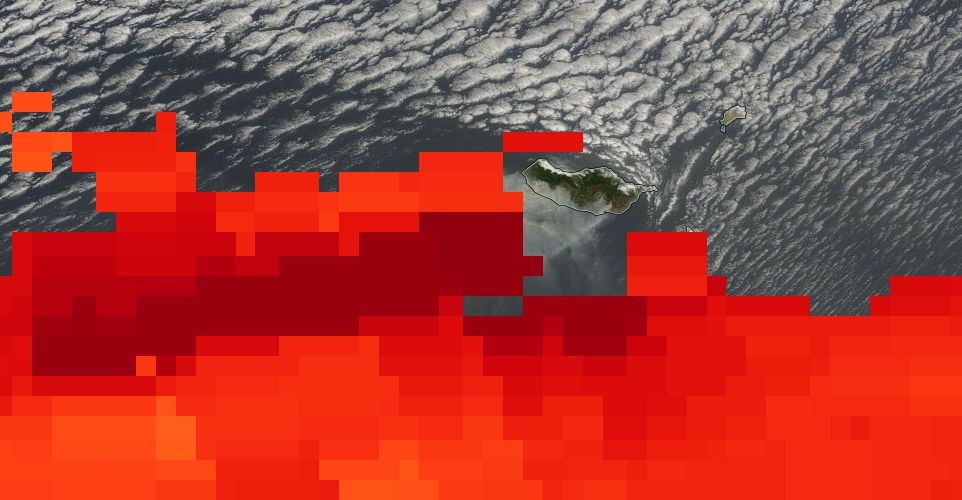
Figure 4.20: The Aerosol Optical Depth (AOD, or Aerosol Optical Thickness) from MODIS(AQUA) on 10 August. The dark red colours in the image correspond to AOD values between 0.695 and 1.990. AOD indicates the level at which particles in the air (aerosols) prevent light from travelling through the atmosphere.