Chapter VII: Detailed case studies
Table of Contents
- Chapter VII: Detailed case studies
- Convection along a convergence line over Hungary (31 May 2011)
- Rapidly developing severe storm over western Hungary (25 May 2010)
Convection along a convergence line over Hungary (31 May 2011)
The surface chart in the left panel of Fig. 1 shows a frequently occurring synoptic situation where there is a high ridge over western Europe and a trough over eastern Europe. A weak cold front was approaching Hungary. A stable convergence line formed before its arrival in the weak south-southeastern flow in the low and middle layers. The sounding from Budapest at 12 UTC (right panel of Fig. 1) shows the presence of sufficient humidity, unstable conditions in the lower tropospheric profile and conditionally unstable or neutral conditions in the mid-troposphere. Wind shear was weak to moderate.
|
|
Figure 1: Surface chart (left) and radiosonde measurements from Budapest (right) on 31 May 2011, 12 UTC
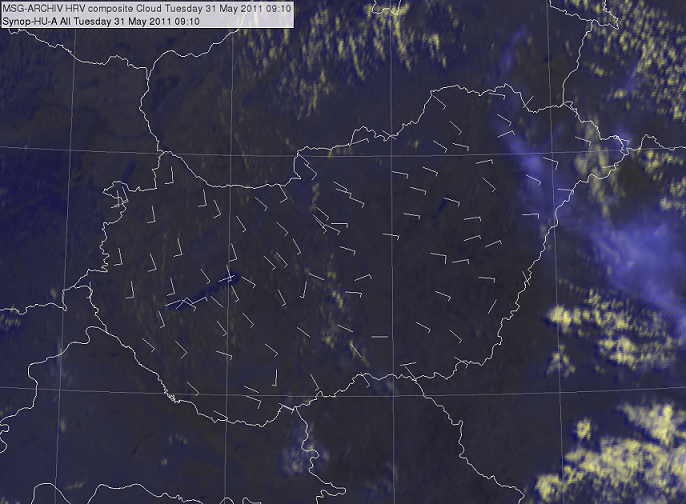
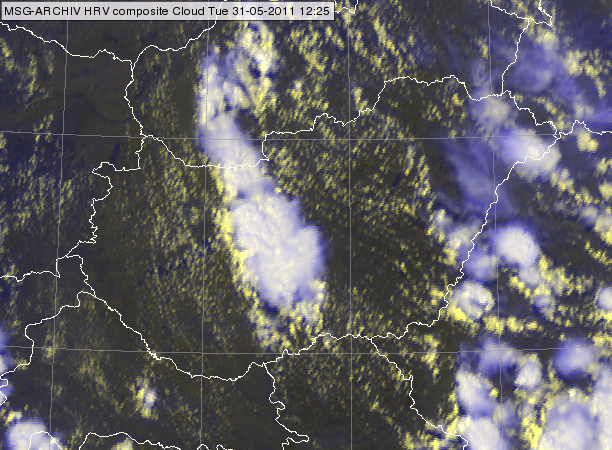
A convergence line could be seen in surface wind measurements at 09 UTC (Fig. 2). Later, from around 09:40 UTC, thunderstorms formed along this convergence line, as seen in Fig. 2. The right panel of Fig. 2 shows the MCS along the convergence line. Also, the cloud streets reveal the orientation of the convergent low-level flow. The evolution of the MCS is clear in the 2-panel (HRV cloud RGB and radar) animation (07:30-17:30 UTC). Outflow boundaries are seen in both satellite and radar images.
|
|
||
|
|
Figure 2: HRV cloud RGB image from 31 May 2011 at 09:10 (left) and 12:25 (right) UTC. The left panel is overlaid with the 10-minute surface wind (9:00-9:10 UTC) measured at automatic stations. Press the orrange play button to see the animation.
Fig. 3 shows the 24 hour Microphysics RGB image, the satellite-retrieved TPW and K-index and the difference between the satellite-retrieved and the NWP forecasted TPW at 08:25 UTC. The 24 hour Microphysics RGB image has visual information about low-level moisture in cloud-free areas. The slightly darker blue 'north-to-south' band over central Hungary indicates increased moisture content in the low levels. This is very likely due to moisture convergence along the convergence line. The satellite-retrieved TPW image (upper right panel of Fig. 3) reflects the increased moisture content nicely. The K-index shows instability in the mid-layer along the convergence line. This is probably a result of convergence at low levels having transported moisture to the mid-levels. The satellite-retrieved moisture content values (bottom right panel) exceeded the numerically forecasted values along the convergence line. This shows that in this case the satellite-retrieved moisture added value to the NWP moisture forecast.
![]()
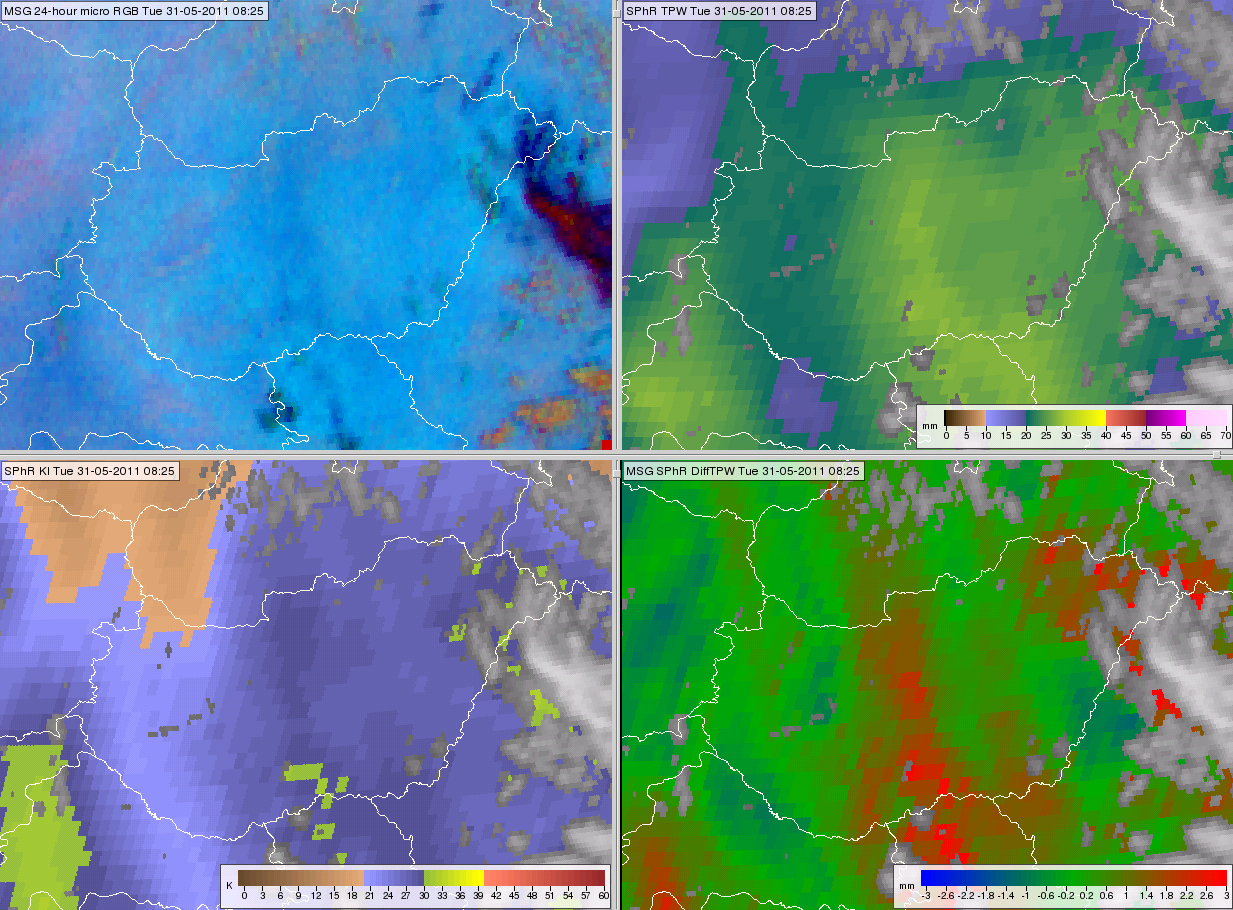
Figure 3: 24 hour Microphysics RGB image (top left), satellite-retrieved TPW (top right), K-Index (bottom left) and the difference between the ECMWF forecasted and the satellite-retrieved TPW (bottom right) from 31 May 2011, 08:25 UTC.
The development of the MCS, surrounding moisture content and mid-layer instability can be followed in a time sequence between 05:10 and 16:10 UTC. Convective clouds formed along the convergence line, as can be seen in the sequence and in Fig. 4. The figure shows the SPhR TPW field from 08:55 UTC, when the area was mainly cloud-free, overlaid with the radar contours of 10 dBZ from 10:45 UTC, by which time the convective clouds had already developed. The convergence caused a local increase in moisture content, and it also acted as a lifting mechanism.
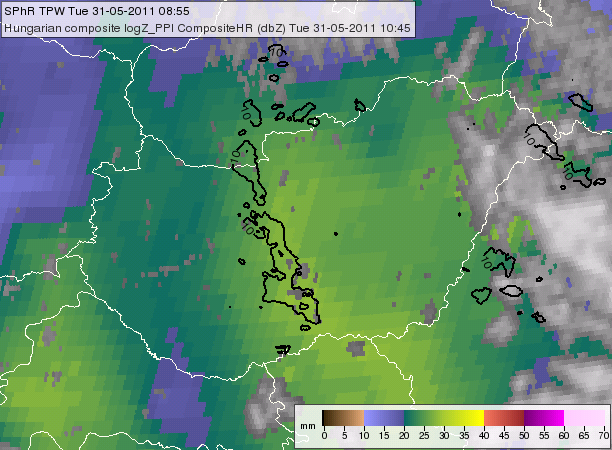
Figure 4: Satellite-retrieved TPW at 08:55 UTC overlaid with the contours of the radar column maximum product from 10:45 UTC.
Rapidly developing severe storm over western Hungary (25 May 2010)
On 25 May 2010 a very interesting convective system developed in central Europe. A severe thunderstorm developed extremely fast over western Hungary (Fig. 5).
 |
 |
Figure 5: Snapshots taken from the surface
The severe MCS developed ahead of a cold front. A complex low-pressure system with long, waving fronts stretched over most of Europe (Fig. 6). The zonal flow of the cold trough over central Europe caused strong west-northwesterly winds (see sounding measurements in Fig. 8). Frontal lifting, strong wind shear (mostly due to a large increase in wind speed in the 0-6 km ASL layer) and strong pressure and temperature gradients (both at 850 and 500 hPa) were present and each of these ingredients likely contributed to the long lifespan and severe nature of the system. More information on the dynamics of mesoscale convective systems can be found in the textbooks of Bluestein, 1993, Markowski and Richardson, 2010, or in the papers of Parker and Johnson, 2000, Rotunno et al., 1988, Bryan et al., 2006. The high over the Mediterranean blocked any further southern movement, so that the low-pressure system slowly moved east. The relatively high dew point depression at mid-levels may also have increased the severity of the situation. Fig. 7 shows the ECMWF forecasted 500 hPa geopotential for 12 and 15 UTC overlaying the IR10.8 image. The image on the right shows the storm in its mature stage.

Figure 6: Surface chart from 25 May 2010, 12 UTC
 |
 |
Figure 7: Meteosat SEVIRI IR10.8 image overlaid with forecasted 500 hPa geopotential, 25 May 2011, 12 (left) and 18 (right) UTC

Figure 8: Radiosonde data from 25 May 2010, 12 UTC measured at Poprad-Ganovce, Slovakia (upper left), Prostejov, Czech Republic (upper right) and Budapest, Hungary (bottom left). The red arrows indicate the locations of the three radiosonde stations in the 11:55 UTC satellite image (bottom right).
According to the radiosonde measurements in and around Hungary (in Poprad, Budapest and in Prostejov, Fig. 8), the mid-level was dry and wind shear in the 0-6 km layer was moderate to strong.

Figure 9: ECMWF forecasted geopotential height at 500 hPa (solid black lines), wind at 925 hPa, wind shear of the 0-6 km layer (broken lines), MLCAPE (mixed layer CAPE, colors) for 25 May 2011 at 12 (left) and 15 UTC (right).
ECMWF forecasted a favorable environment for the development of supercells. Strong wind shear, moderate CAPE and low-level convergence were analyzed at 12 UTC and forecasted for 15 UTC over western Hungary (Fig. 9). Thomson index values were high in this area in the 12 UTC ECMWF analysis (Fig. 10). The ECMWF-derived Supercell Composite Parameter (Fig. 11) was extremely high in the NWP data at 12 and 15 UTC. (Definitions of the Thomson index and Supercell Composite Parameter are found in the Appendix.)

Figure 10: ECMWF forecasted geopotential height at 500 hPa (solid black lines), wind at 925 hPa, wind shear of the 0-6 km layer (broken lines) and Thomson index (colors) for 25 May 2011, 12 UTC

Figure 11: ECMWF derived Supercell Composite Parameter (colors and lines) for 25 May 2010 at 12 (left) and 15 (right) UTC
Between 11 and 12 UTC, several cells initiated over southern Czech Republic (Fig. 12). These cells formed an MCS, and the system entered northwestern Hungary at about 15:10 UTC (Fig. 13). Here the westernmost cell started to develop much faster than the others, and formed an extensive, highly symmetric and roundish thunderstorm with a 'cold ring' (warm spots embedded within the cold anvil of Cb's), which covered almost two thirds of western Hungary (Figs. 14 and 5). The environmental parameters were different in the Czech Republic and Moravian Highlands (TPW ~20 mm, K-index ~26 °C), where the first cell initiated, than in western Hungary, where the environment was more moist and unstable (TPW ~26-27 mm, K-index ~32-33 °C). The system arrived just at the time for which ECMWF forecasted the most unstable atmosphere. All these parameters (dry mid-layer, strong wind shear, low-level convergence, high moisture content and instability) explain the accelerated development of the thunderstorm. Note that the NWCSAF SPhR mid-layer water vapor content (ML, between 850 and 500 hPa) product shows an even dryer mid-layer than the ECMWF model forecasted - see the bright blue area in the bottom right panels of Figs. 13 and 14, which show the difference between the satellite-retrieved and ECMWF forecasted ML values. In other words, the situation could have been even more favorable for severe thunderstorms.

Figure 12: Meteosat-9 image and SPhR products from 25 May 2010, 11:25 UTC: Day Microphysics RGB image (upper left), TPW (upper right), K-Index (bottom left) and ML (bottom right).

Figure 13: Meteosat-9 images and SPhR products from 25 May 2010, 15:10 UTC: Day Microphysics RGB (upper left), TPW (upper middle), ML (upper right), HRV cloud RGB (bottom left), K-Index (bottom middle) and DiffML (bottom right).

Figure 14: Meteosat-9 images and SPhR products from 25 May 2010, 17:40 UTC: IR10.8 image (upper left), TPW (upper middle), ML (upper right), HRV cloud RGB (bottom left), K-Index (bottom middle) and DiffML (bottom right)
To compare the satellite-retrieved parameters with a radiosonde measurement we looked for a cloud-free station not far from western Hungary. Zagreb was cloud-free at 12 UTC. Fig. 15 shows the Zagreb sounding, while the black arrow in the right panel indicates its location on the DiffML image.
 |
 |
Figure 15: Radiosonde measurement from Zagreb, Croatia on 25 May 2010 at 12 UTC (left), and the difference between satellite-retrieved and NWP forecasted mid-layer water vapor content (right). The black arrow indicates the location of the Zagreb radiosonde station.
Table 1 shows TPW and K-index for Zagreb as measured by radiosonde, forecasted by ECMWF, and derived from satellite products. The SPhR algorithm adjusted the background NWP data for the better by decreasing the forecasted TPW value. This satellite-derived TPW matches the radiosonde measurements more closely than the TPW forecast.
| Radiosonde | SPhR | ECMWF (00+12) | |
|---|---|---|---|
| TPW [mm] | 20.24 | 21.2 | 23.6 |
| K-index [°C] | 26.1 | 24.7 | 26.9 |
Table 1: TPW and K-index values derived from the Zagreb radiosonde measurement, retrieved from satellite data and forecasted by ECMWF model for 25 May 2010, 12 UTC.
As mentioned in Chapter II, even the initial and satellite-corrected profiles can be studied with the SPhR software. We will present an example of this here.
We looked at one cloud-free pixel to see the difference between NWP forecasted and satellite-retrieved temperatures and moisture profiles (optional output). The right panel of Fig. 16 shows the ECMWF forecasted profiles (based on the 00 UTC run, valid for 12 UTC) for the location indicated by the yellow arrow in the left panel. These ECMWF forecasted profiles are interpolated spatially and temporally to the satellite pixel and slot time. Air temperature, relative humidity and dew point temperature values are presented. The background profile shows a dry mid-layer.
 |
 |
Figure 16: Difference between the satellite-retrieved and NWP forecasted mid-layer water vapor content on 25 May 2010, 12 UTC (left). ECMWF forecasted temperature (T), relative humidity (RH) and dew point temperature (TD) profiles (right) for the pixel indicated by the arrow in the left panel. The ECMWF forecast is based on the 00 UTC run and valid for 12 UTC.
Fig. 17 shows the satellite-retrieved and forecasted humidity profiles for the pixel indicated in the left panel of Fig. 16. The profile shows the volume mixing ratio (ppmv, parts per million by volume) against pressure (left panel) and their difference (right panel). The blue curve is the ECMWF forecast profile, while the red curve is the satellite-retrieved humidity profile. For the given pixel the satellite retrieved an even dryer mid-layer than the forecast.

Figure 17: Satellite-retrieved (red curve) and ECMWF forecasted (blue curve) humidity profiles (left) and their difference (right). The profiles correspond to the pixel indicated in Fig. 16. The ECMWF forecast is based on the 00 UTC run and valid for 12 UTC.