Convection along a convergence line over Hungary (31 May 2011)
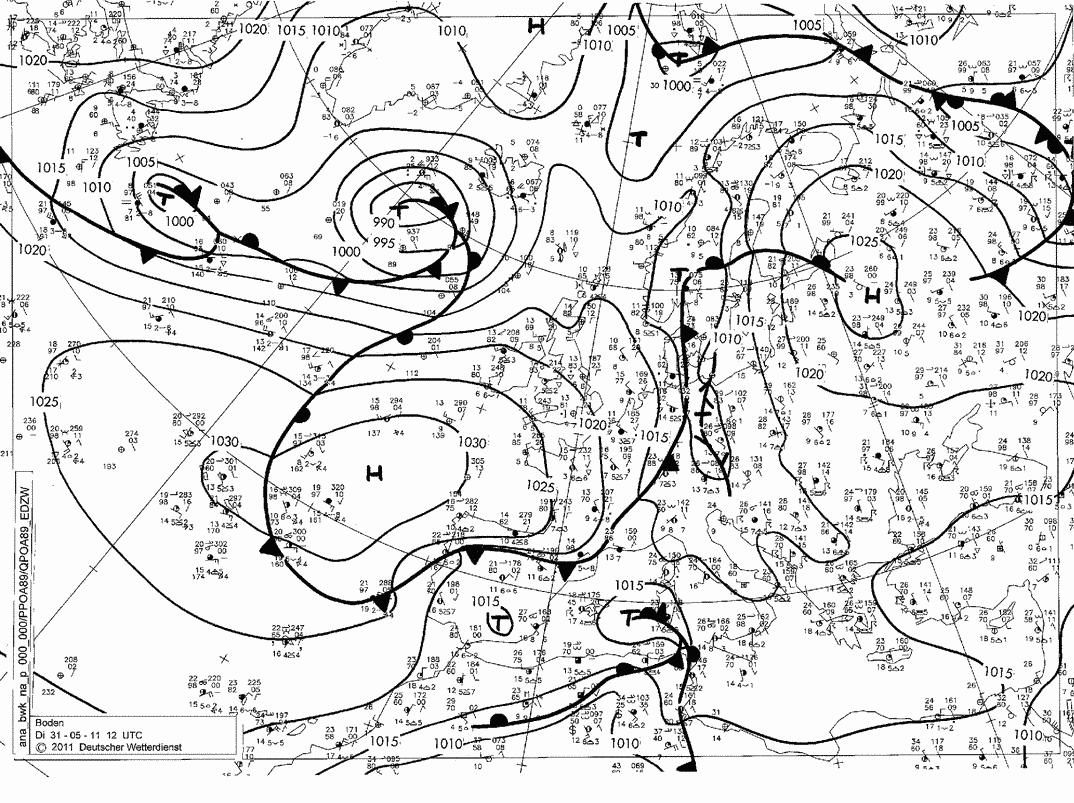
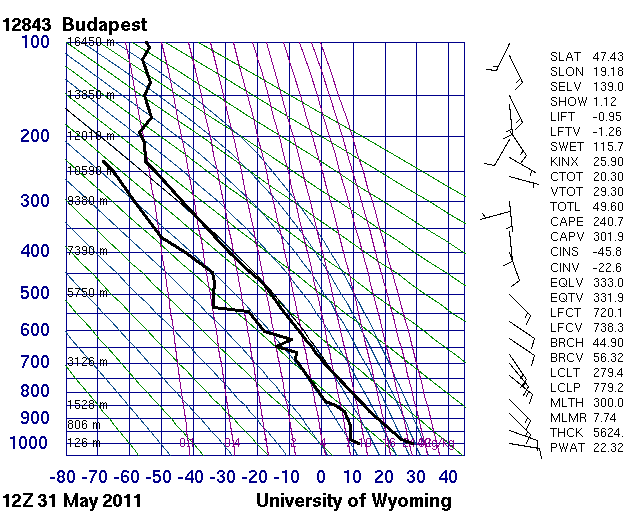
The surface chart in the left panel of Fig. 1 shows a frequently occurring synoptic situation where there is a high ridge over western Europe and a trough over eastern Europe. A weak cold front was approaching Hungary. A stable convergence line formed before its arrival in the weak south-southeastern flow in the low and middle layers. The sounding from Budapest at 12 UTC (right panel of Fig. 1) shows the presence of sufficient humidity, unstable conditions in the lower tropospheric profile and conditionally unstable or neutral conditions in the mid-troposphere. Wind shear was weak to moderate.
|
|
Figure 1: Surface chart (left) and radiosonde measurements from Budapest (right) on 31 May 2011, 12 UTC
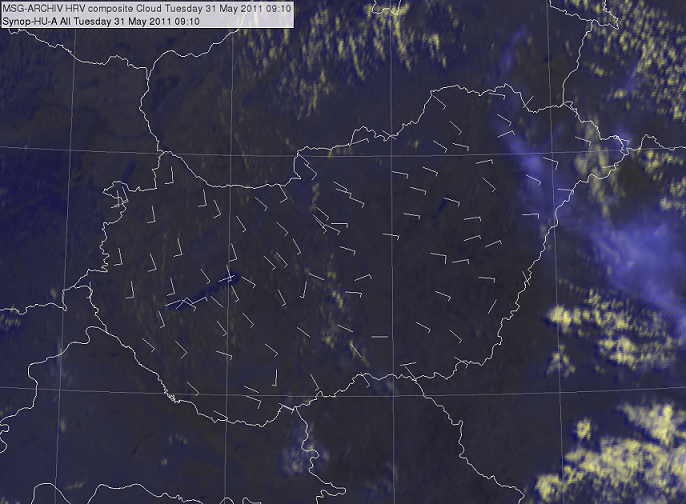
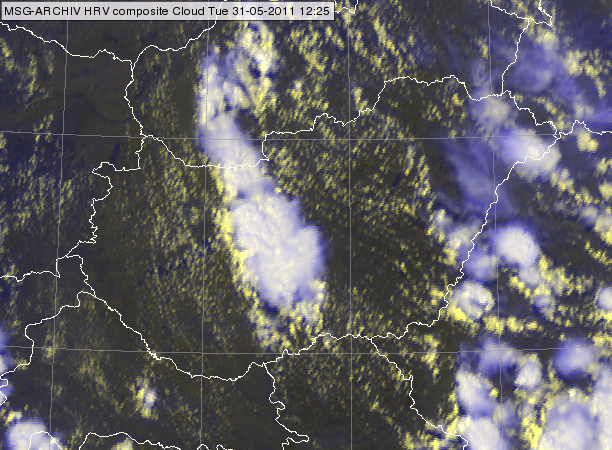
A convergence line could be seen in surface wind measurements at 09 UTC (Fig. 2). Later, from around 09:40 UTC, thunderstorms formed along this convergence line, as seen in Fig. 2. The right panel of Fig. 2 shows the MCS along the convergence line. Also, the cloud streets reveal the orientation of the convergent low-level flow. The evolution of the MCS is clear in the 2-panel (HRV cloud RGB and radar) animation (07:30-17:30 UTC). Outflow boundaries are seen in both satellite and radar images.
|
|
||
|
|
Figure 2: HRV cloud RGB image from 31 May 2011 at 09:10 (left) and 12:25 (right) UTC. The left panel is overlaid with the 10-minute surface wind (9:00-9:10 UTC) measured at automatic stations. Press the orrange play button to see the animation.
Fig. 3 shows the 24 hour Microphysics RGB image, the satellite-retrieved TPW and K-index and the difference between the satellite-retrieved and the NWP forecasted TPW at 08:25 UTC. The 24 hour Microphysics RGB image has visual information about low-level moisture in cloud-free areas. The slightly darker blue 'north-to-south' band over central Hungary indicates increased moisture content in the low levels. This is very likely due to moisture convergence along the convergence line. The satellite-retrieved TPW image (upper right panel of Fig. 3) reflects the increased moisture content nicely. The K-index shows instability in the mid-layer along the convergence line. This is probably a result of convergence at low levels having transported moisture to the mid-levels. The satellite-retrieved moisture content values (bottom right panel) exceeded the numerically forecasted values along the convergence line. This shows that in this case the satellite-retrieved moisture added value to the NWP moisture forecast.
![]()
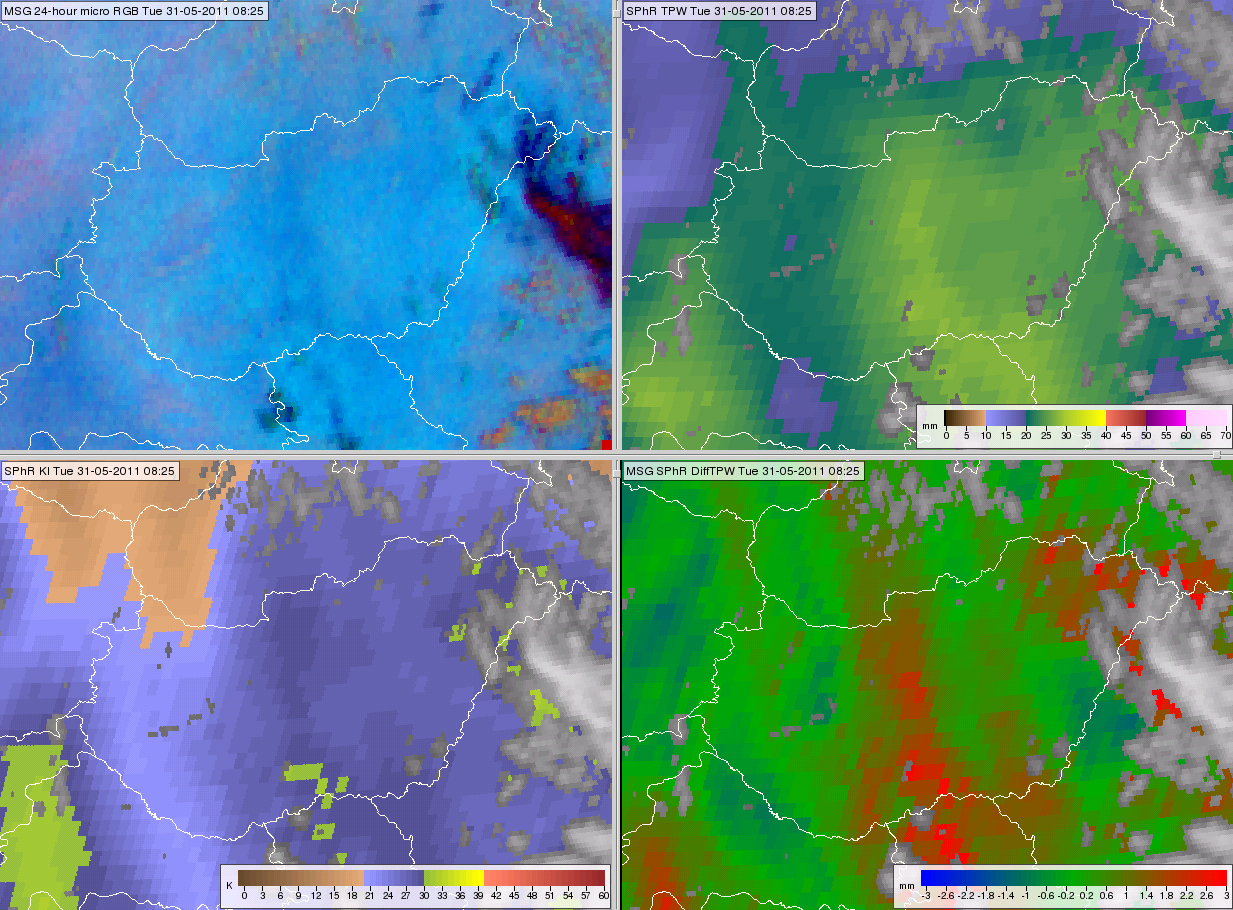
Figure 3: 24 hour Microphysics RGB image (top left), satellite-retrieved TPW (top right), K-Index (bottom left) and the difference between the ECMWF forecasted and the satellite-retrieved TPW (bottom right) from 31 May 2011, 08:25 UTC.
The development of the MCS, surrounding moisture content and mid-layer instability can be followed in a time sequence between 05:10 and 16:10 UTC. Convective clouds formed along the convergence line, as can be seen in the sequence and in Fig. 4. The figure shows the SPhR TPW field from 08:55 UTC, when the area was mainly cloud-free, overlaid with the radar contours of 10 dBZ from 10:45 UTC, by which time the convective clouds had already developed. The convergence caused a local increase in moisture content, and it also acted as a lifting mechanism.
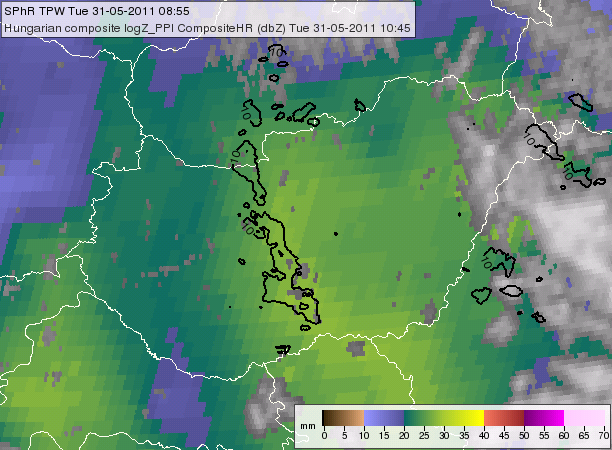
Figure 4: Satellite-retrieved TPW at 08:55 UTC overlaid with the contours of the radar column maximum product from 10:45 UTC.