Exercises

Excercise 1

Arrange the 3 images in the right chronological order (21 September 2021 at 06:00 UTC to 22 September 2021 at 09:00 UTC).

The 500 hPa geopotential height is depicted with cyan and the mean sea level pressure with black isolines.

Note 1: You can click on the images and use the arrows on the keyboard to move through them.

Note 2: Imagine time increasing from left to right.


Excercise 2

Assign the correct development stage to the following three upper-level lows.

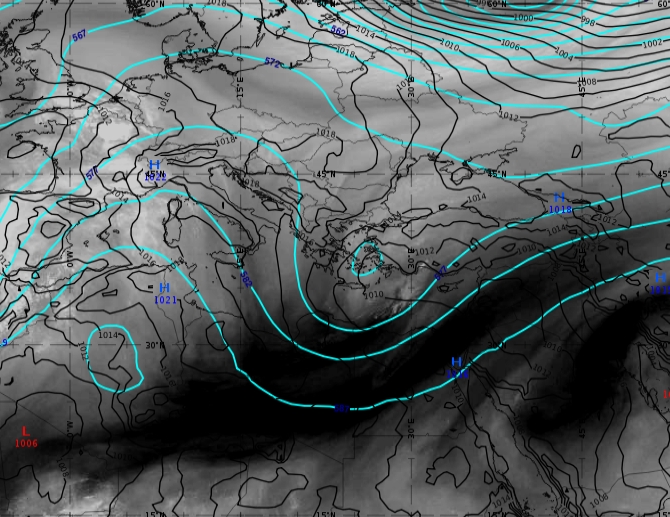
  • IR10.8 μm: 16 August 2021 at 00:00 UTC

 The upper-level trough stage
 The tear-off stage
 The cut-off stage
  • IR10.8 μm: 8 September 2021 at 06:00 UTC

 The upper-level trough stage
 The tear-off stage
 The cut-off stage
  • IR10.8 μm: 14 September 2021 at 06:00 UTC

 The upper-level trough stage
 The tear-off stage
 The cut-off stage

Excercise 3

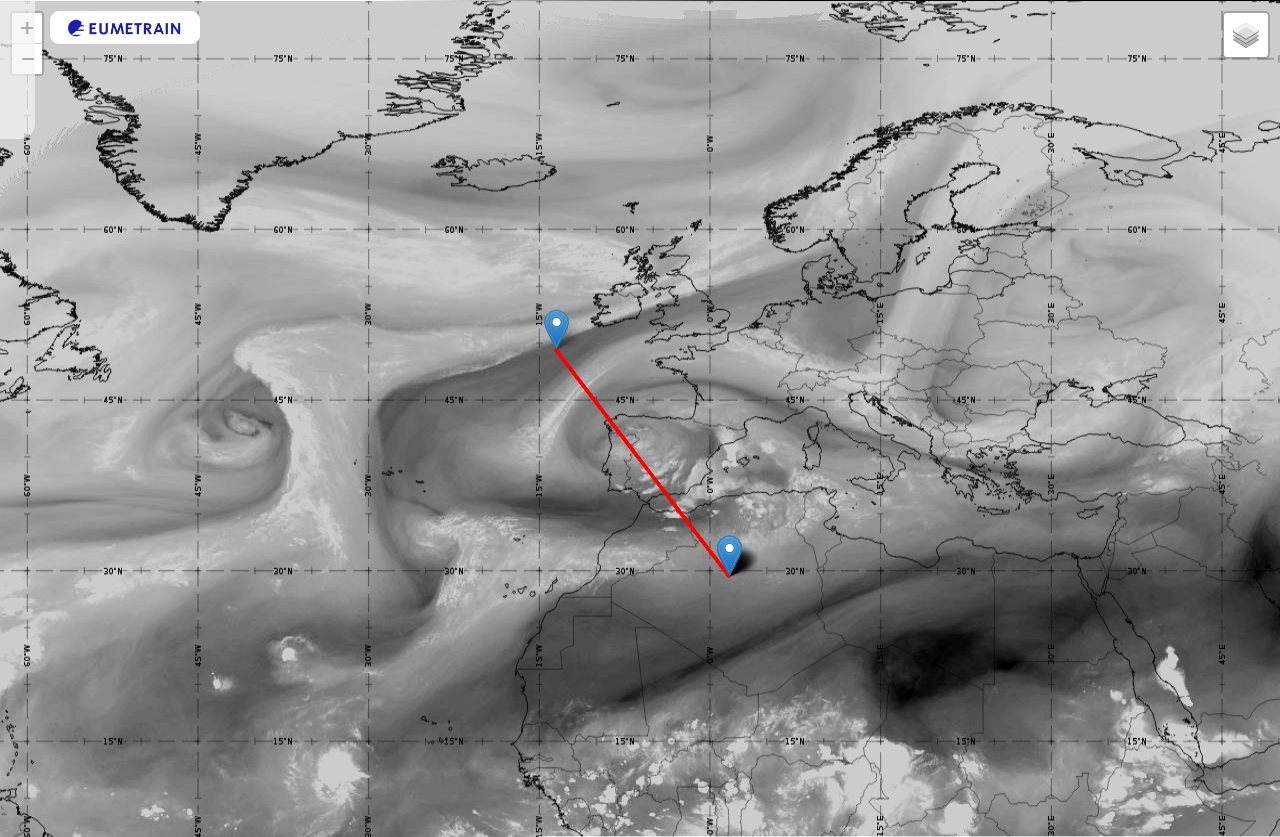
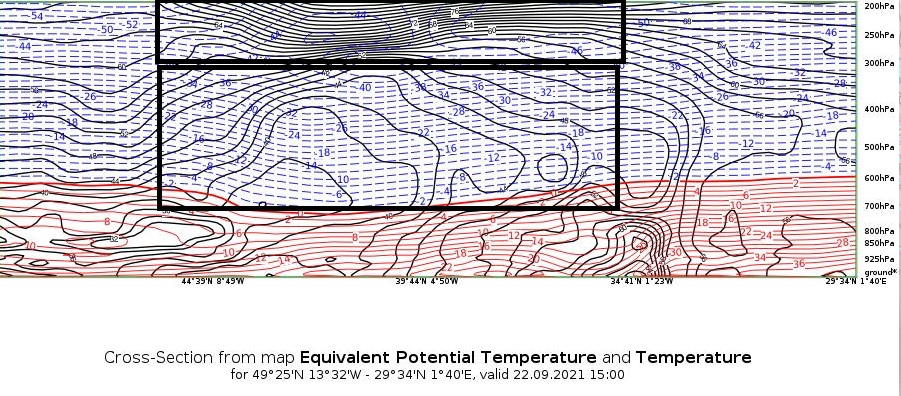
See the following vertical cross section of an ULL from 22 September 2021 at 15:00 UTC. Click on the tropopause depression (that is, where the tropopause is lowest) and on the cold core of this system in the VCS plot.