Vertical Cross Section Cloudspiral: 2nd March 2004:12UTC
Isentropes
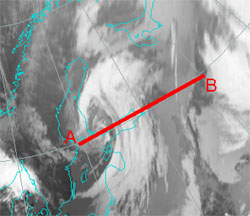
In the 30 hours which have passed after the first Vertical Cross Section was made, a synoptic scale cloud spiral has developed which extends from Finland to Poland. At this time a double structure in the frontal cloud band exists and could be explained with help of the WV images by dry air overflowing the cloud band in high levels. The line of the Vertical Cross section goes through a more northern part of the cloud band.
The VCS was laid from position A to B.
Temperature Advection
The Isentropes show a configuration which is very typical for an occlusion front: a well developed isentropic trough. The western baroclinic boundary is from about 450 hPa downward. This configuration contradicts somehow to the history of the development of the “growing cloud spiral” as this part of the cloud band has developed and became enhanced only after the existence of a distinct cloud spiral.
TA is also typical for an occlusion stage. There is intensive WA in and in front of the center of the isntropic trough and CA in high levels above. Only above the tropopause intensive WA can be seen again.
Convergence
Both baroclinic boundaries at the border of the isentropic trough but especially the western one are accompanied by maxima of convergence. Which indicates the weather activity of the cloud band.
Vertical Motion (Omega)
Also the upward motion shows a very typical distribution for an occlusion cloud band, namely an intensive maximum in the centre of the isentropic trough. In this case the very distinct values support the weather activity. Of interest is also the double structure of maxima of upward motion. A maximum in low levels usually indicates in several parameters the processes connected to the surface low. As there is a very intensive surface low existing in this case, the maximum of upward motion at about 850 hpa might be connected to this low.
Vorticity Advection
The main phenomena in the vertical distribution of this parameter is the intensive maximum of PVA in a thick layer of the troposphere. The low layers also show secondary maxima but not as distinct as for instance in the omega field just discussed.
PV
There is still a very distinct PV anomaly showing values of 2 units (very probably stratospheric air) down to 600 hPa. This is the same situation as in the intial stage 30 hours before, but one has to take into consideration that the whole system is now about 15 degerees more to the south.