Question 1:
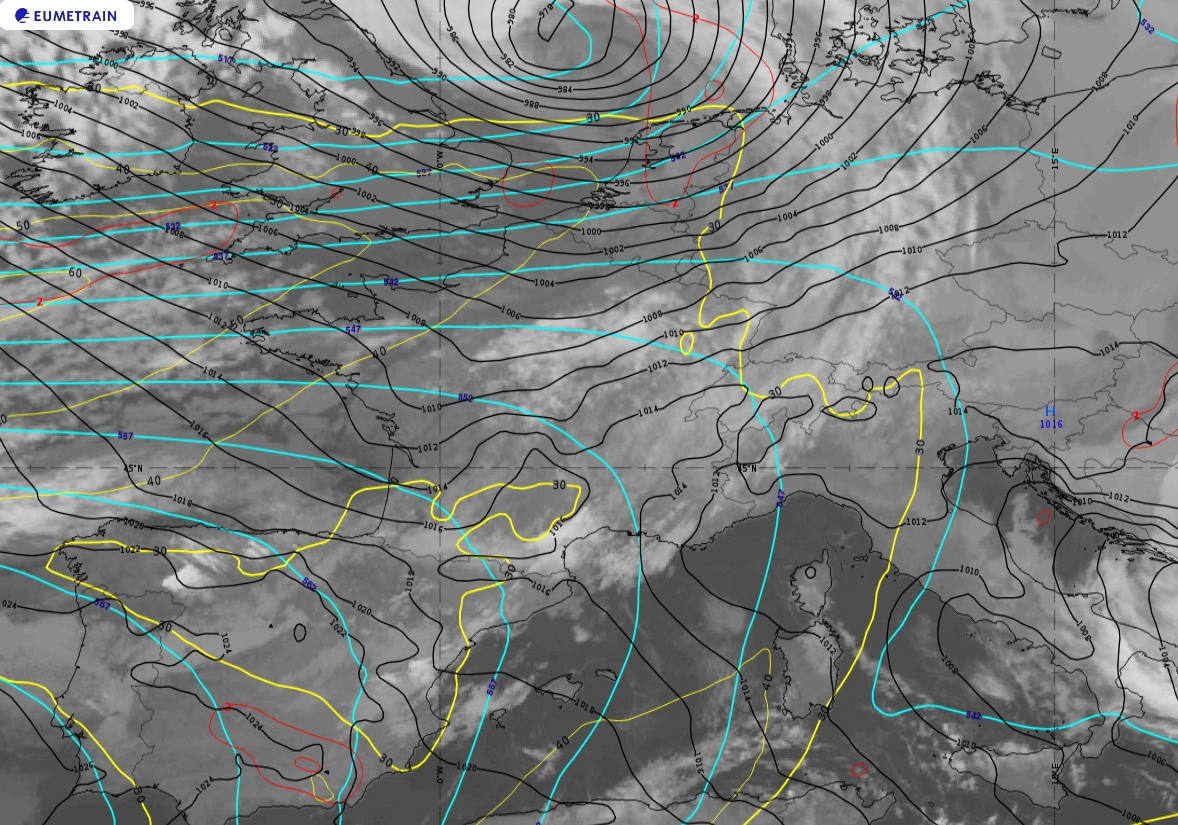
On May 11, 2019 at 12:00 UTC, the western part of the Alps is affected by a westerly flow that crosses the Alps. At lower levels, the flow deviates around the mountain chain. Where would you expect the low to form (click on the region with the mouse).
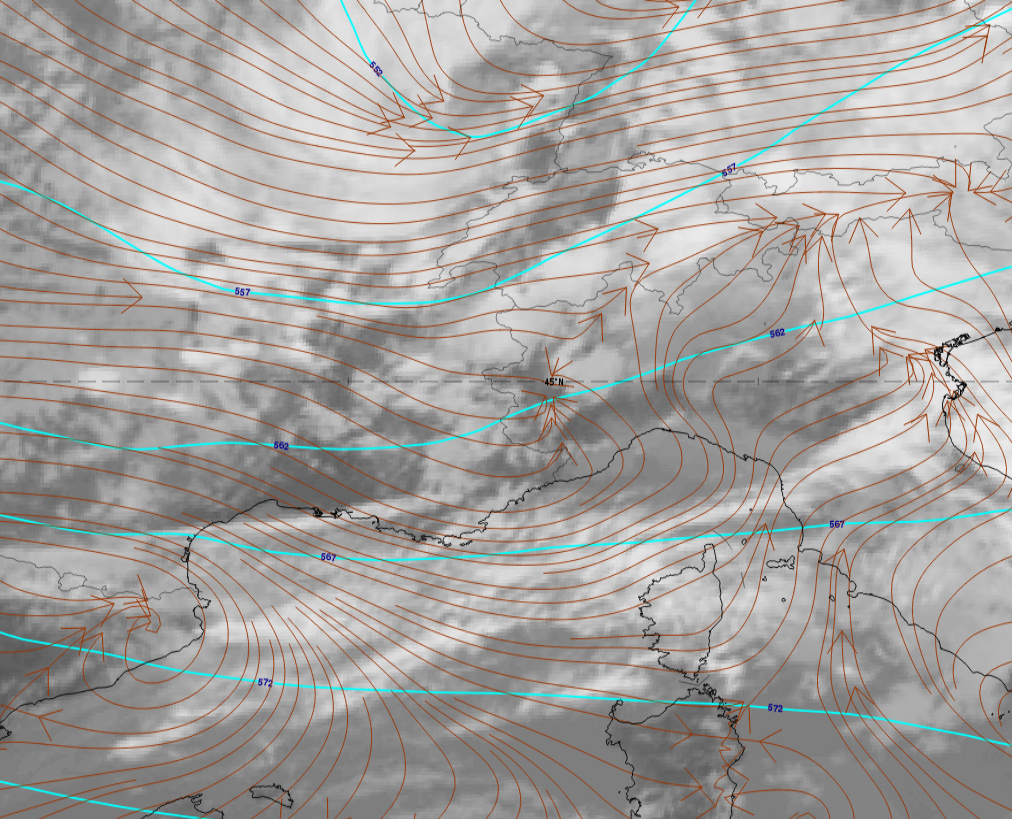
Figure 1: IR10.8 image from May 11, 2019 at 12:00 UTC. Geopotential height at 500 hPa (cyan) and streamlines at 1,000 hPa (brown).
Question 2:
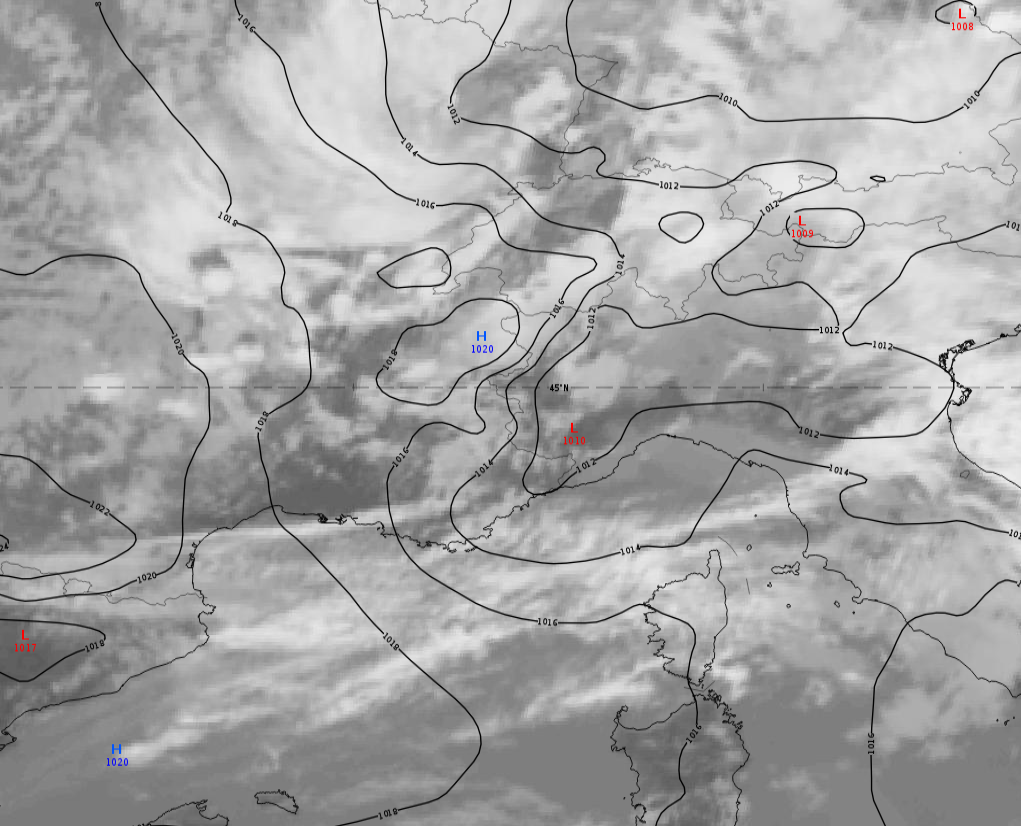
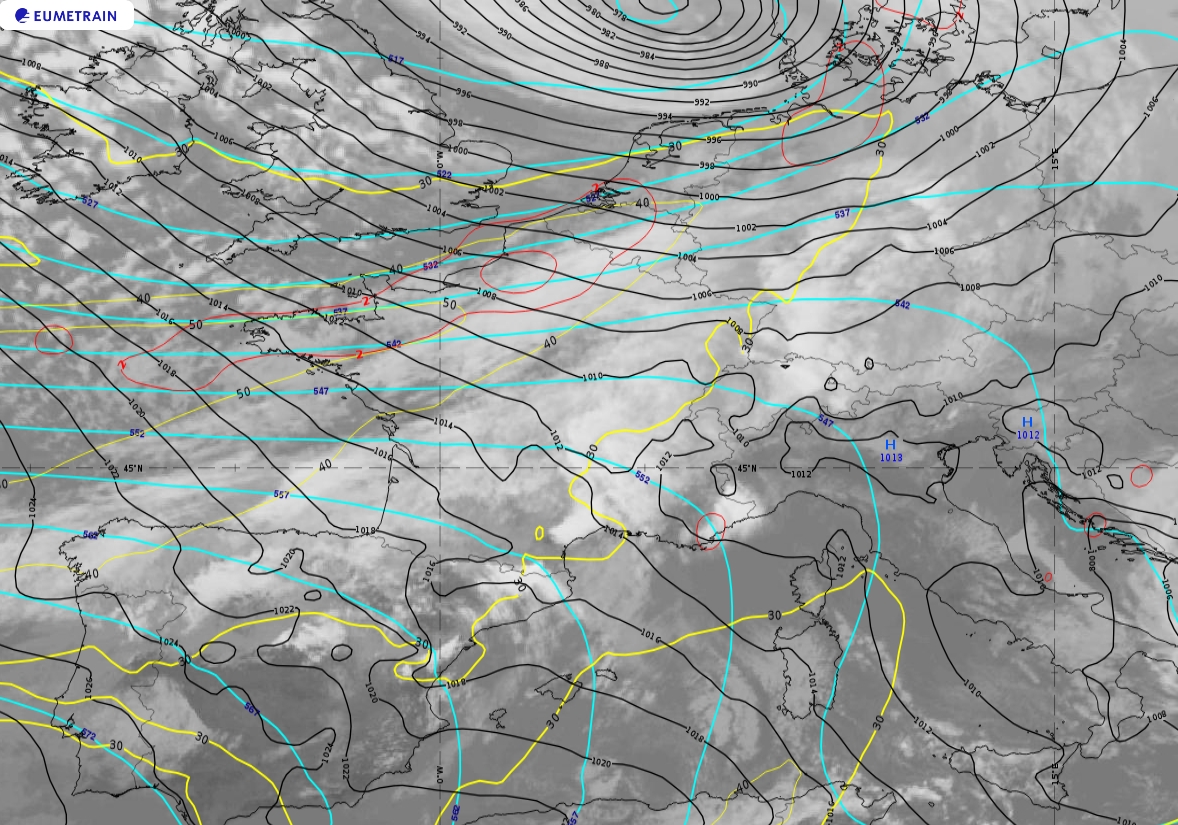
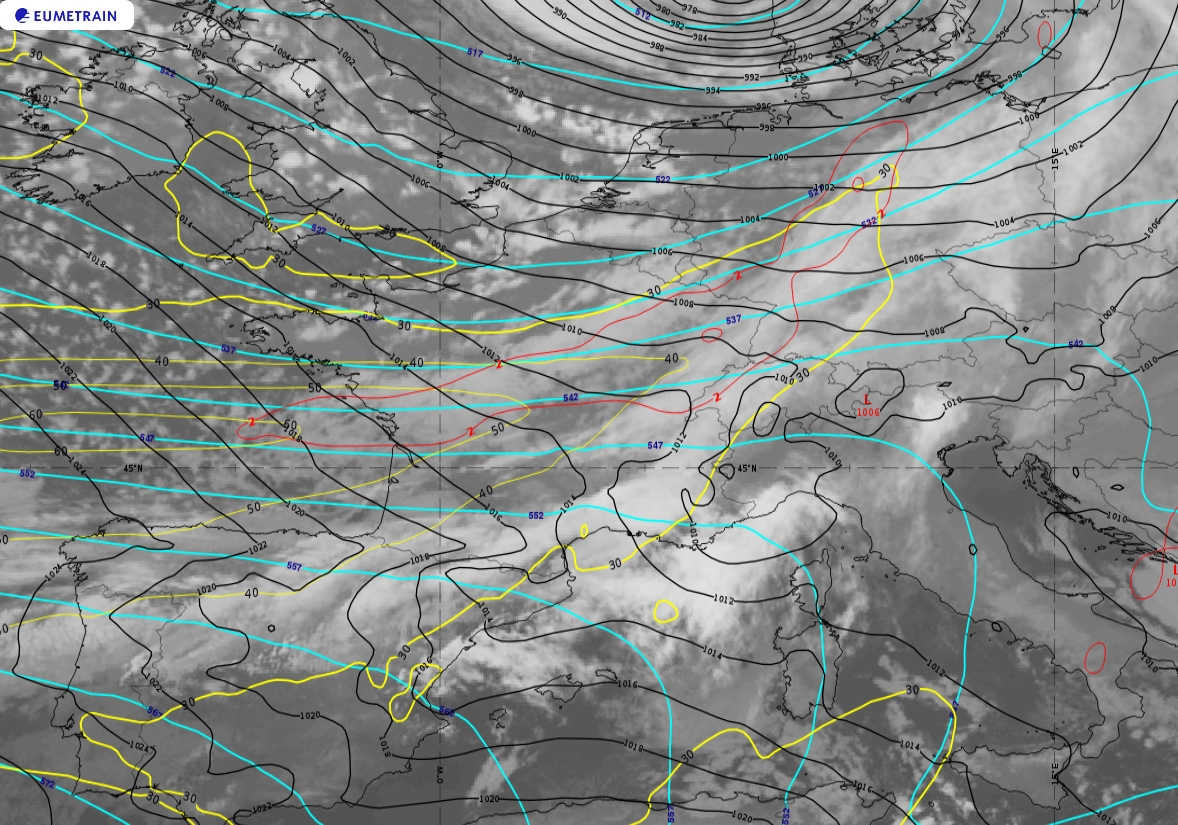
Do you see the potential for a leeward vortex to develop and strengthen, according to the parameters displayed in the figure below? Look carefully at the upper-level triggers.
Figure 3: IR10.8 image loop from February 11, 2018 at 06/12/18 UTC. Mean sea level pressure (black), geopotential height at 500 hPa (cyan), isotachs at 300 hPa (yellow) and cyclonic vorticity advection at 300 hPa (red).
Note: to access the gallery of images click
here
Question 3:
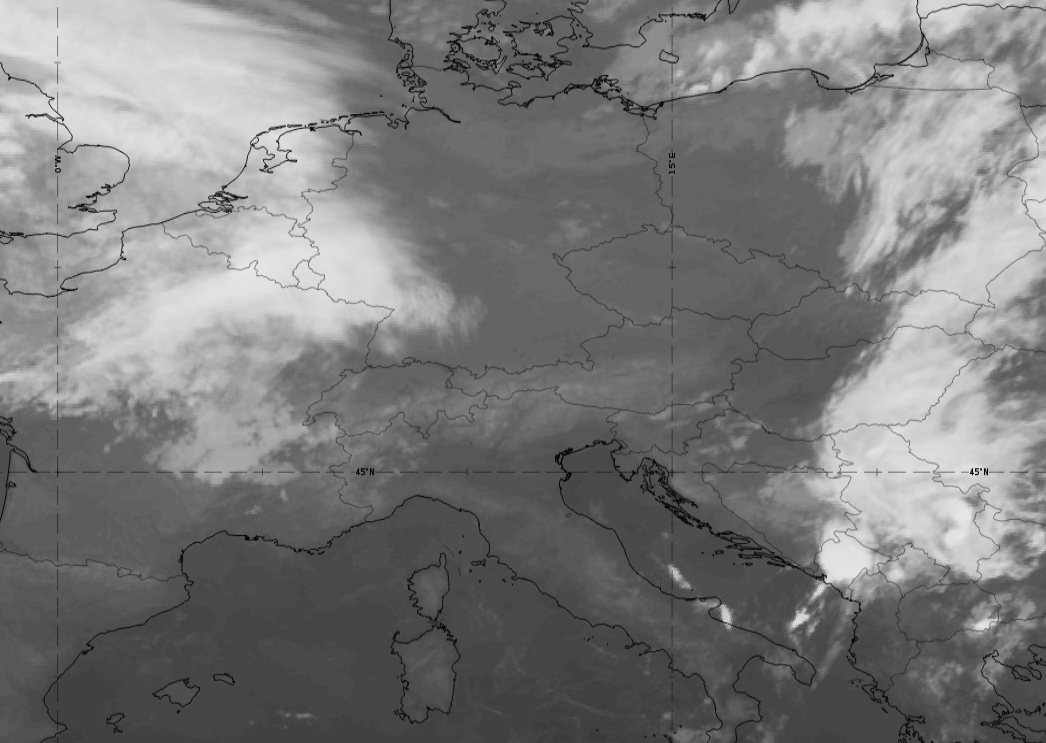
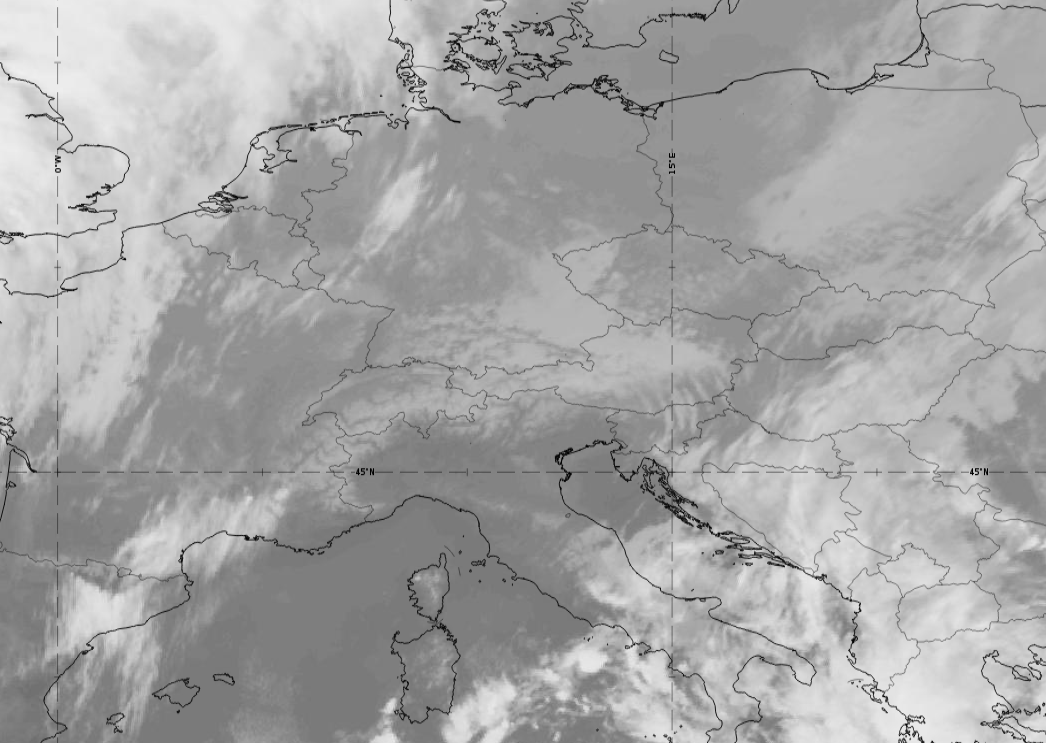
Which of the following IR10.8 satellite images shows a blocking situation, where parts of the airflow cross the mountain chain while other parts deviate around it?
A)B)
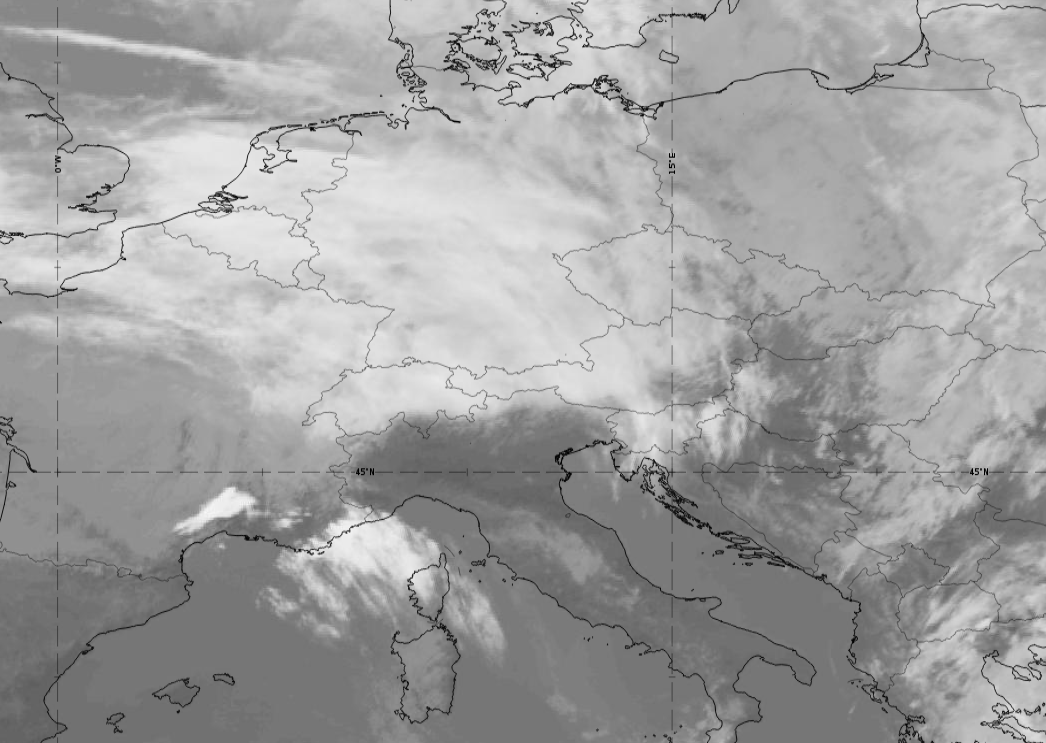
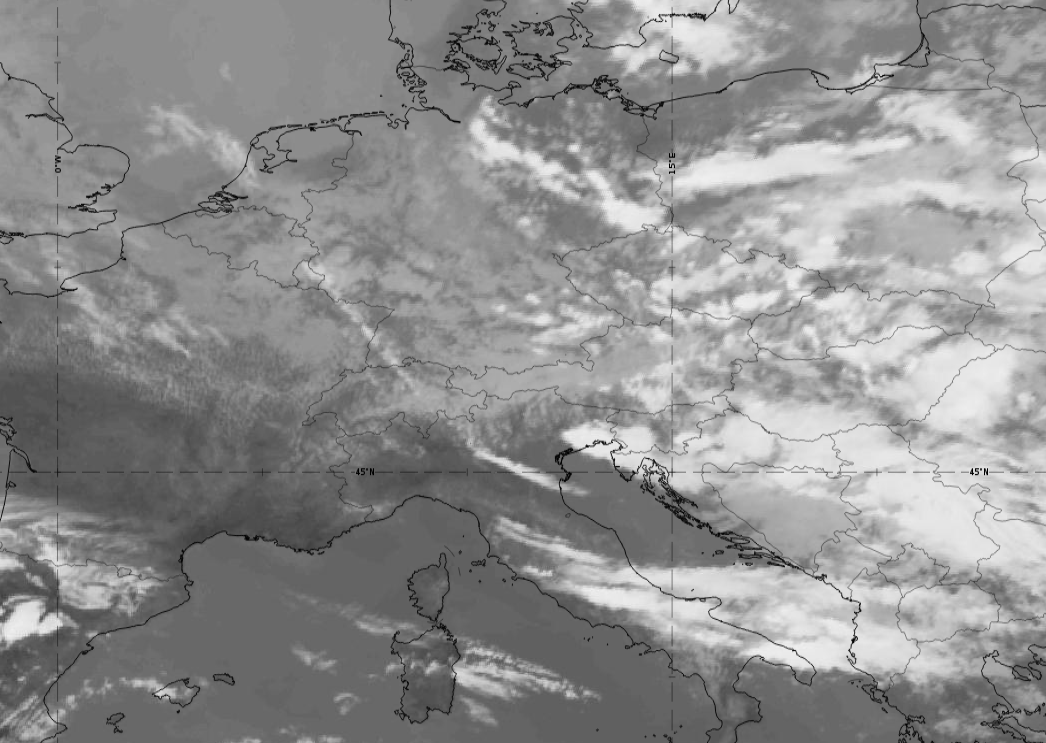
C)D)
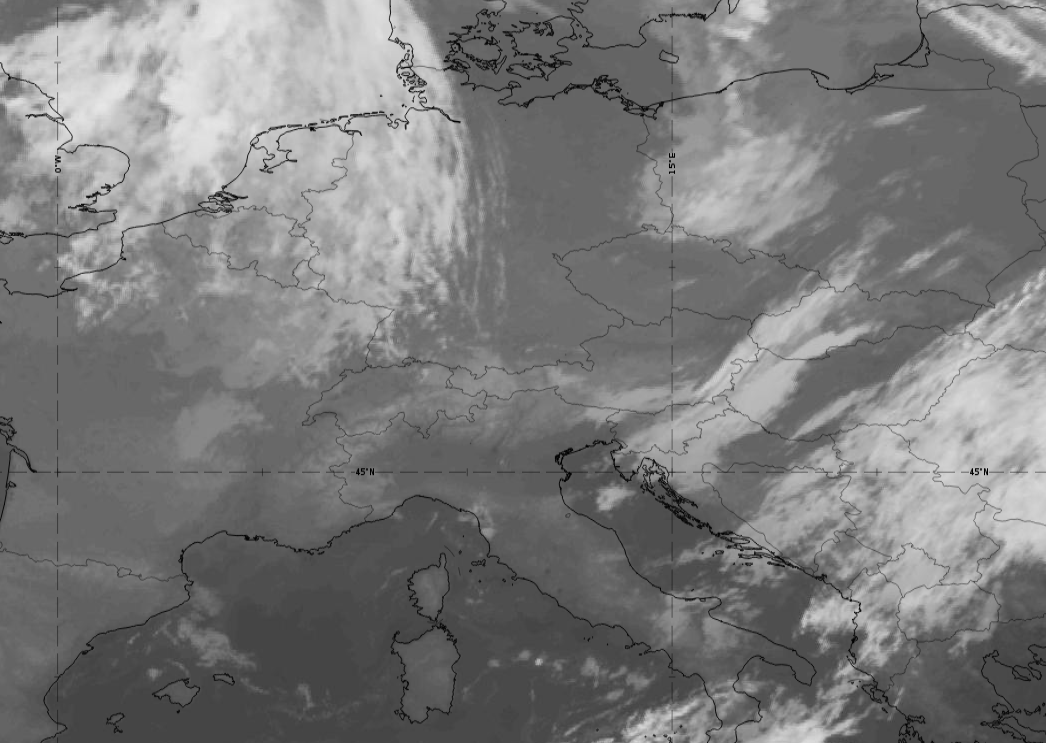
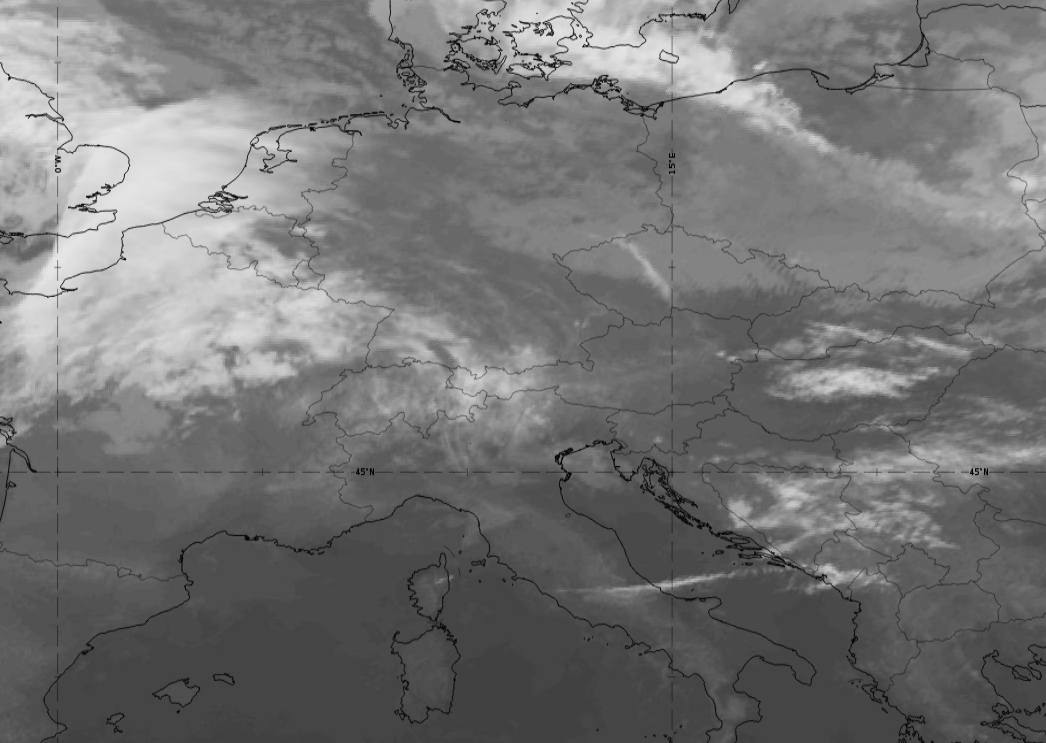
E)F)